
|
|||||
|
 | |
| |
| |
| |
| |
| |
|
Gene: SLC15A1 |
Gene summary for SLC15A1 |
| Gene information | Species | Human | Gene symbol | SLC15A1 | Gene ID | 6564 |
| Gene name | solute carrier family 15 member 1 | |
| Gene Alias | HPECT1 | |
| Cytomap | 13q32.2-q32.3 | |
| Gene Type | protein-coding | GO ID | GO:0006810 | UniProtAcc | B2CQT6 |
Top |
Malignant transformation analysis |
| Identification of the aberrant gene expression in precancerous and cancerous lesions by comparing the gene expression of stem-like cells in diseased tissues with normal stem cells |
| Entrez ID | Symbol | Replicates | Species | Organ | Tissue | Adj P-value | Log2FC | Malignancy |
| 6564 | SLC15A1 | NAFLD1 | Human | Liver | NAFLD | 1.18e-10 | 1.07e+00 | -0.04 |
| 6564 | SLC15A1 | HCC1_Meng | Human | Liver | HCC | 3.26e-18 | -8.03e-02 | 0.0246 |
| 6564 | SLC15A1 | HCC2_Meng | Human | Liver | HCC | 7.94e-04 | -2.43e-02 | 0.0107 |
| 6564 | SLC15A1 | HCC2 | Human | Liver | HCC | 1.12e-04 | 2.67e+00 | 0.5341 |
| 6564 | SLC15A1 | S028 | Human | Liver | HCC | 3.22e-02 | 2.52e-01 | 0.2503 |
| 6564 | SLC15A1 | S029 | Human | Liver | HCC | 1.82e-07 | 4.12e-01 | 0.2581 |
| 6564 | SLC15A1 | Pat01-B | Human | Stomach | GC | 3.29e-51 | 9.79e-01 | 0.5754 |
| 6564 | SLC15A1 | Pat03-B | Human | Stomach | GC | 9.48e-26 | 6.54e-01 | 0.3693 |
| 6564 | SLC15A1 | Pat17-B | Human | Stomach | GC | 2.00e-06 | 2.68e-01 | 0.3109 |
| Page: 1 |
| Tissue | Expression Dynamics | Abbreviation |
| GC | 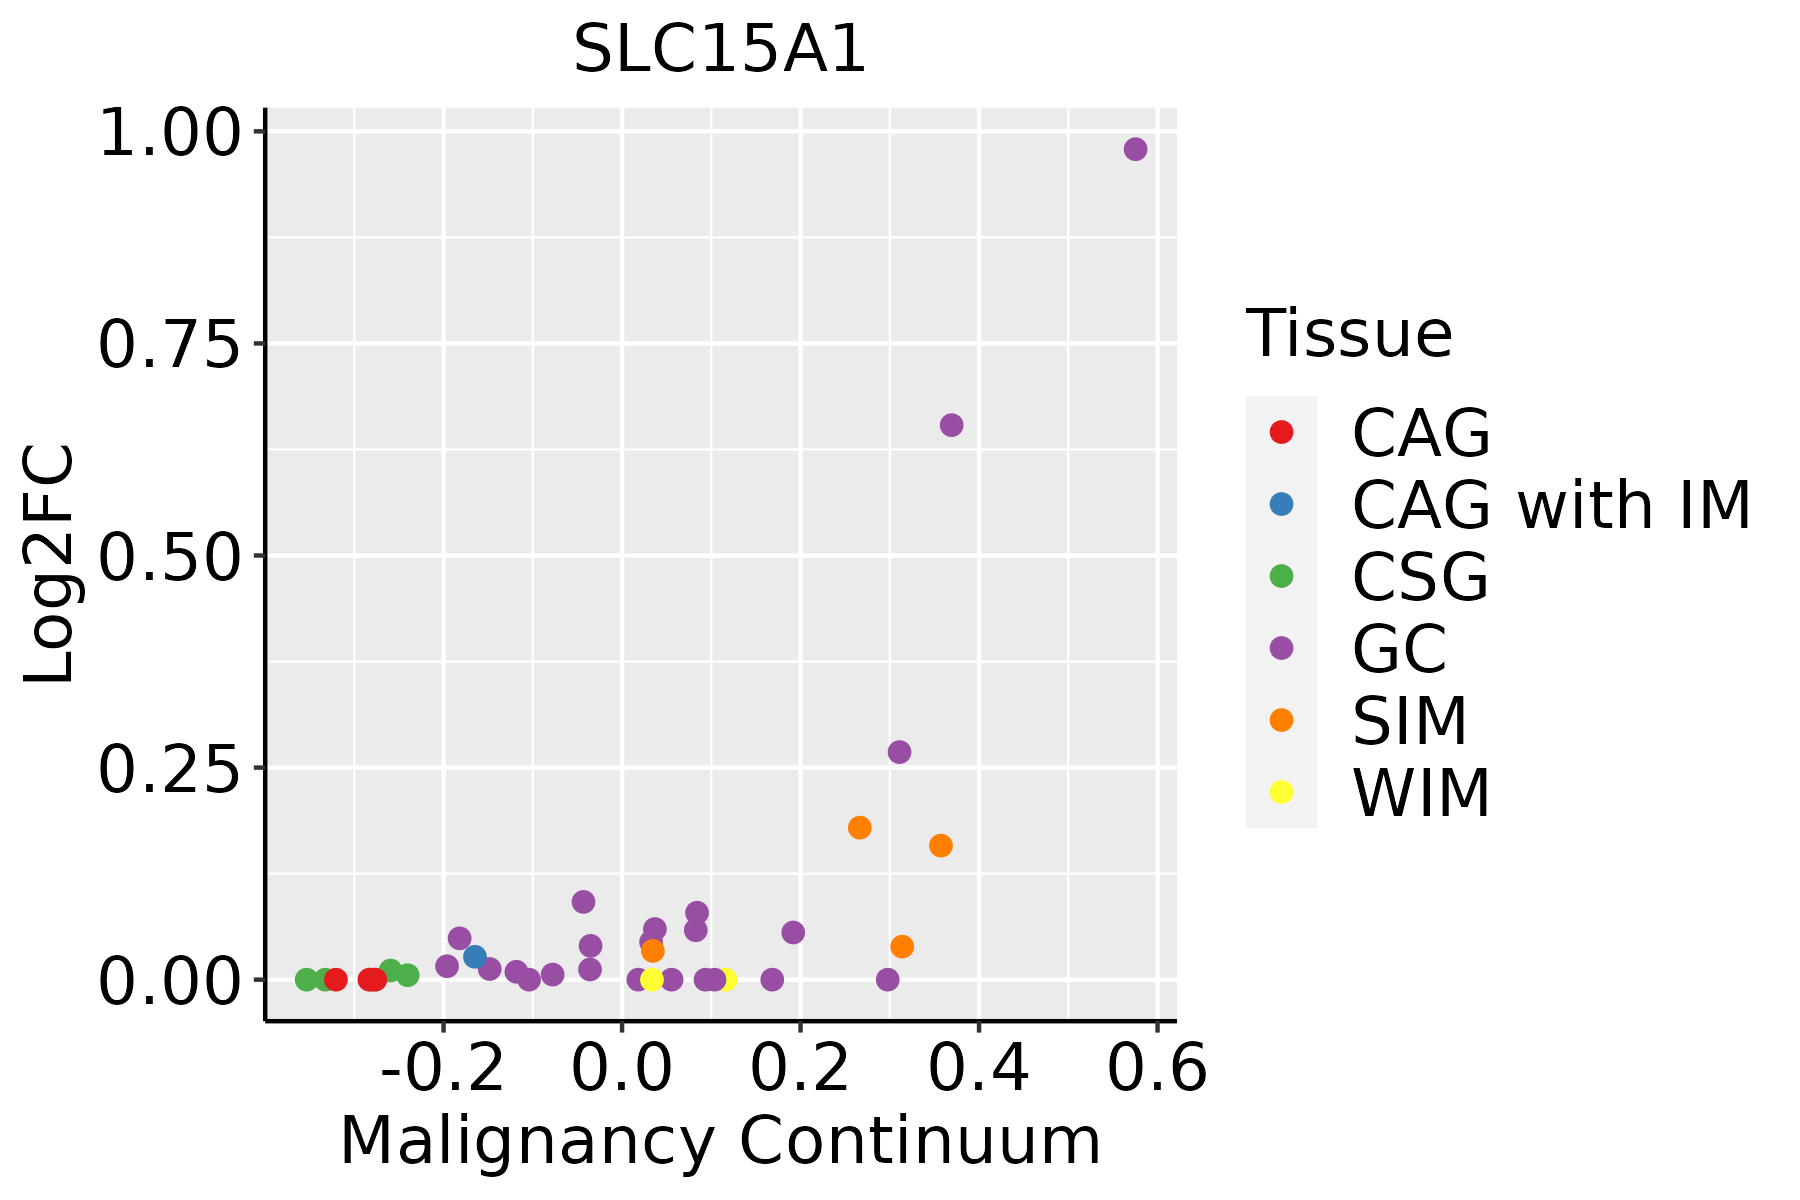 | CAG: Chronic atrophic gastritis |
| CAG with IM: Chronic atrophic gastritis with intestinal metaplasia | ||
| CSG: Chronic superficial gastritis | ||
| GC: Gastric cancer | ||
| SIM: Severe intestinal metaplasia | ||
| WIM: Wild intestinal metaplasia | ||
| Liver | 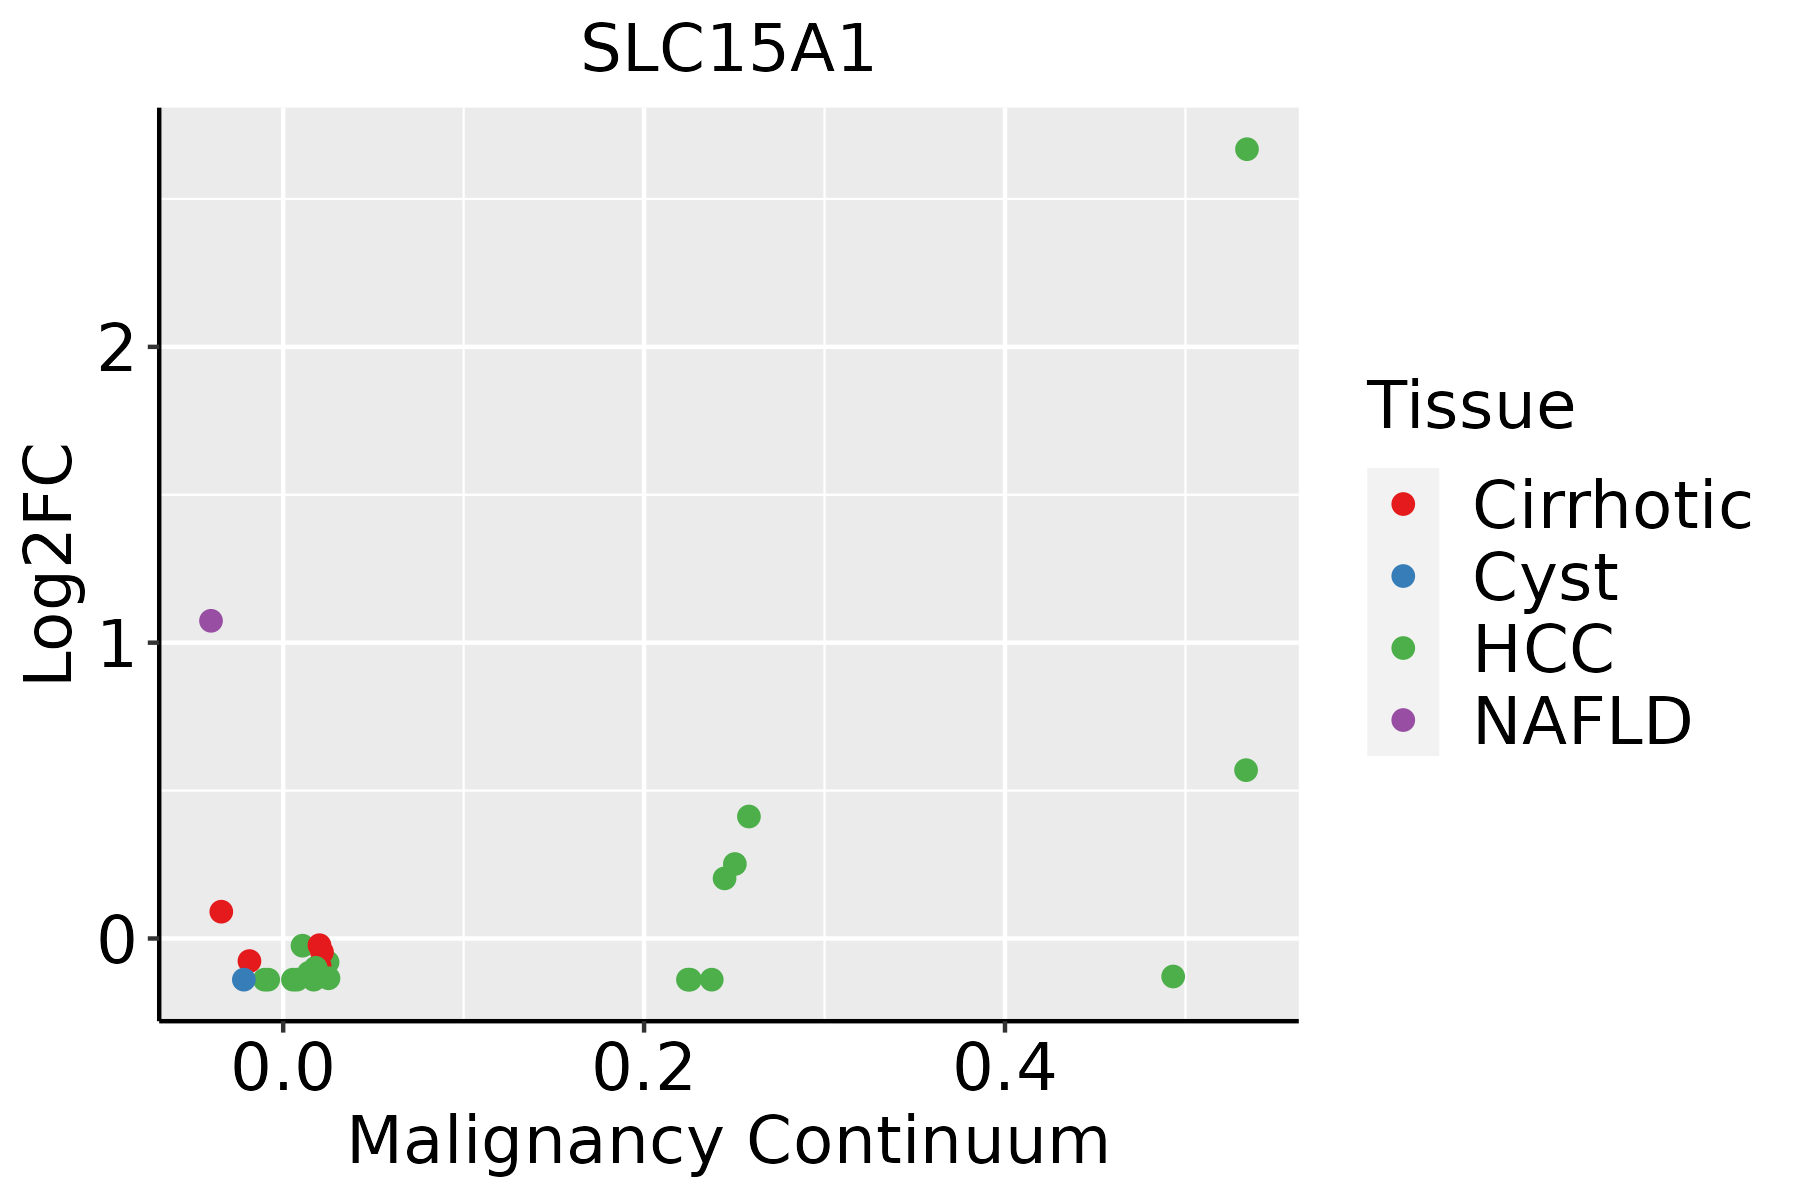 | HCC: Hepatocellular carcinoma |
| NAFLD: Non-alcoholic fatty liver disease |
| ∗log2FC in expression of this searched gene in stem-like cells from each diseased tissue sample relative to stem-like cells in normal samples in each tissue plotted against the malignancy continuum. Samples are colored based on if they are from different disease stage. |
Top |
Malignant transformation related pathway analysis |
| Find out the enriched GO biological processes and KEGG pathways involved in transition from healthy to precancer to cancer |
| Tissue | Disease Stage | Enriched GO biological Processes |
| Colorectum | AD |  |
| Colorectum | SER |  |
| Colorectum | MSS |  |
| Colorectum | MSI-H |  |
| Colorectum | FAP |  |
| ∗Top 15 enriched GO BP terms are showed in the bar plot of each disease state in each tissue. Each row represents a significant GO biological process which is colored according to the -log10(p.adjust). |
| Page: 1 2 3 4 5 6 7 8 9 |
| GO ID | Tissue | Disease Stage | Description | Gene Ratio | Bg Ratio | pvalue | p.adjust | Count |
| GO:19026007 | Liver | HCC | proton transmembrane transport | 87/7958 | 157/18723 | 7.27e-04 | 4.42e-03 | 87 |
| GO:19026006 | Stomach | GC | proton transmembrane transport | 35/1159 | 157/18723 | 2.33e-11 | 5.06e-09 | 35 |
| GO:00158335 | Stomach | GC | peptide transport | 32/1159 | 264/18723 | 2.13e-04 | 3.61e-03 | 32 |
| GO:00428863 | Stomach | GC | amide transport | 34/1159 | 301/18723 | 5.16e-04 | 7.28e-03 | 34 |
| GO:0006857 | Stomach | GC | oligopeptide transport | 5/1159 | 16/18723 | 2.21e-03 | 2.18e-02 | 5 |
| Page: 1 |
| Pathway ID | Tissue | Disease Stage | Description | Gene Ratio | Bg Ratio | pvalue | p.adjust | qvalue | Count |
| Page: 1 |
Top |
Cell-cell communication analysis |
| Identification of potential cell-cell interactions between two cell types and their ligand-receptor pairs for different disease states |
| Ligand | Receptor | LRpair | Pathway | Tissue | Disease Stage |
| Page: 1 |
Top |
Single-cell gene regulatory network inference analysis |
| Find out the significant the regulons (TFs) and the target genes of each regulon across cell types for different disease states |
| TF | Cell Type | Tissue | Disease Stage | Target Gene | RSS | Regulon Activity |
| ∗The dot plots of a searched regulon are shown for all cell subpopulations in each disease state of each tissue based on the regulon specific score inferred using pySCENIC and by calculating the average expression. |
| Page: 1 |
Top |
Somatic mutation of malignant transformation related genes |
| Annotation of somatic variants for genes involved in malignant transformation |
| Hugo Symbol | Variant Class | Variant Classification | dbSNP RS | HGVSc | HGVSp | HGVSp Short | SWISSPROT | BIOTYPE | SIFT | PolyPhen | Tumor Sample Barcode | Tissue | Histology | Sex | Age | Stage | Therapy Types | Drugs | Outcome |
| SLC15A1 | SNV | Missense_Mutation | novel | c.1880N>A | p.Ala627Asp | p.A627D | P46059 | protein_coding | deleterious(0) | probably_damaging(0.999) | TCGA-AC-A8OR-01 | Breast | breast invasive carcinoma | Female | >=65 | I/II | Unknown | Unknown | SD |
| SLC15A1 | SNV | Missense_Mutation | rs199996553 | c.160N>A | p.Ala54Thr | p.A54T | P46059 | protein_coding | tolerated(0.26) | benign(0.036) | TCGA-AR-A2LE-01 | Breast | breast invasive carcinoma | Female | >=65 | I/II | Hormone Therapy | tamoxiphen | PD |
| SLC15A1 | SNV | Missense_Mutation | c.1774N>T | p.Thr592Ser | p.T592S | P46059 | protein_coding | tolerated(0.09) | probably_damaging(0.999) | TCGA-B6-A0IJ-01 | Breast | breast invasive carcinoma | Female | <65 | I/II | Unknown | Unknown | SD | |
| SLC15A1 | SNV | Missense_Mutation | c.896N>T | p.Gln299Leu | p.Q299L | P46059 | protein_coding | deleterious(0) | probably_damaging(1) | TCGA-BH-A0BP-01 | Breast | breast invasive carcinoma | Female | >=65 | I/II | Unknown | Unknown | SD | |
| SLC15A1 | SNV | Missense_Mutation | c.933N>A | p.Met311Ile | p.M311I | P46059 | protein_coding | deleterious(0) | possibly_damaging(0.877) | TCGA-BH-A0HF-01 | Breast | breast invasive carcinoma | Female | >=65 | I/II | Hormone Therapy | arimidex | SD | |
| SLC15A1 | SNV | Missense_Mutation | novel | c.1059N>G | p.Phe353Leu | p.F353L | P46059 | protein_coding | tolerated(0.51) | benign(0) | TCGA-EW-A3E8-01 | Breast | breast invasive carcinoma | Female | <65 | I/II | Hormone Therapy | anastrozole | SD |
| SLC15A1 | insertion | Nonsense_Mutation | novel | c.1486_1487insGTCTGCCTACTGTGGTTTGTGAAAATGTTAATATTGGAGCAAGGT | p.Glu496delinsGlyLeuProThrValValCysGluAsnValAsnIleGlyAlaArgTer | p.E496delinsGLPTVVCENVNIGAR* | P46059 | protein_coding | TCGA-A8-A07R-01 | Breast | breast invasive carcinoma | Female | >=65 | III/IV | Ancillary | zoledronic | SD | ||
| SLC15A1 | SNV | Missense_Mutation | rs372092782 | c.1180G>A | p.Glu394Lys | p.E394K | P46059 | protein_coding | tolerated(0.07) | possibly_damaging(0.531) | TCGA-C5-A2LZ-01 | Cervix | cervical & endocervical cancer | Female | >=65 | III/IV | Unknown | Unknown | PD |
| SLC15A1 | SNV | Missense_Mutation | rs764058347 | c.1906N>A | p.Val636Met | p.V636M | P46059 | protein_coding | deleterious(0) | probably_damaging(0.965) | TCGA-DG-A2KL-01 | Cervix | cervical & endocervical cancer | Female | <65 | I/II | Chemotherapy | cisplatin | SD |
| SLC15A1 | SNV | Missense_Mutation | novel | c.978N>C | p.Gln326His | p.Q326H | P46059 | protein_coding | deleterious(0) | probably_damaging(0.997) | TCGA-VS-A959-01 | Cervix | cervical & endocervical cancer | Female | >=65 | I/II | Unknown | Unknown | SD |
| Page: 1 2 3 4 5 6 7 8 9 |
Top |
Related drugs of malignant transformation related genes |
| Identification of chemicals and drugs interact with genes involved in malignant transfromation |
| (DGIdb 4.0) |
| Entrez ID | Symbol | Category | Interaction Types | Drug Claim Name | Drug Name | PMIDs |
| 6564 | SLC15A1 | DRUGGABLE GENOME, TRANSPORTER | inhibitor | 178101226 | ||
| 6564 | SLC15A1 | DRUGGABLE GENOME, TRANSPORTER | hmg coa reductase inhibitors | |||
| 6564 | SLC15A1 | DRUGGABLE GENOME, TRANSPORTER | inhibitor | 178101414 | ||
| 6564 | SLC15A1 | DRUGGABLE GENOME, TRANSPORTER | 178101319 | |||
| 6564 | SLC15A1 | DRUGGABLE GENOME, TRANSPORTER | 178101375 | |||
| 6564 | SLC15A1 | DRUGGABLE GENOME, TRANSPORTER | GLYCYLSARCOSINE | GLYCYLSARCOSINE | 22584254 | |
| 6564 | SLC15A1 | DRUGGABLE GENOME, TRANSPORTER | fluvastatin | FLUVASTATIN | ||
| 6564 | SLC15A1 | DRUGGABLE GENOME, TRANSPORTER | ACYCLOVIR | ACYCLOVIR | 12821497 | |
| 6564 | SLC15A1 | DRUGGABLE GENOME, TRANSPORTER | 178101217 | |||
| 6564 | SLC15A1 | DRUGGABLE GENOME, TRANSPORTER | inhibitor | 329968426 |
| Page: 1 |

Copyright 2023-Present -The University of Texas Health Science Center at Houston |