
|
|||||
|
 | |
| |
| |
| |
| |
| |
|
Gene: SLC14A1 |
Gene summary for SLC14A1 |
| Gene information | Species | Human | Gene symbol | SLC14A1 | Gene ID | 6563 |
| Gene name | solute carrier family 14 member 1 (Kidd blood group) | |
| Gene Alias | HUT11 | |
| Cytomap | 18q12.3 | |
| Gene Type | protein-coding | GO ID | GO:0006810 | UniProtAcc | Q13336 |
Top |
Malignant transformation analysis |
| Identification of the aberrant gene expression in precancerous and cancerous lesions by comparing the gene expression of stem-like cells in diseased tissues with normal stem cells |
| Entrez ID | Symbol | Replicates | Species | Organ | Tissue | Adj P-value | Log2FC | Malignancy |
| 6563 | SLC14A1 | P2T-E | Human | Esophagus | ESCC | 5.17e-27 | 1.09e+00 | 0.1177 |
| 6563 | SLC14A1 | P8T-E | Human | Esophagus | ESCC | 2.93e-15 | 4.81e-01 | 0.0889 |
| 6563 | SLC14A1 | P61T-E | Human | Esophagus | ESCC | 2.42e-03 | 1.07e-01 | 0.099 |
| 6563 | SLC14A1 | P76T-E | Human | Esophagus | ESCC | 4.16e-22 | 5.80e-01 | 0.1207 |
| 6563 | SLC14A1 | P79T-E | Human | Esophagus | ESCC | 1.47e-14 | 4.72e-01 | 0.1154 |
| 6563 | SLC14A1 | GSM5252126_BPH283PrGF_Via | Human | Prostate | BPH | 6.26e-23 | 1.09e+00 | -0.1771 |
| 6563 | SLC14A1 | GSM5252127_BPH283PrSF_Via | Human | Prostate | BPH | 3.16e-07 | 7.62e-01 | -0.1453 |
| 6563 | SLC14A1 | GSM5252128_BPH327PrGF_Via | Human | Prostate | BPH | 3.49e-39 | 1.28e+00 | -0.1688 |
| 6563 | SLC14A1 | GSM5252129_BPH327PrSF_Via | Human | Prostate | BPH | 2.09e-17 | 1.22e+00 | -0.1697 |
| 6563 | SLC14A1 | GSM5252130_BPH340PrGF_Via | Human | Prostate | BPH | 9.50e-58 | 2.11e+00 | -0.1972 |
| 6563 | SLC14A1 | GSM5252131_BPH340PrSF_Via | Human | Prostate | BPH | 3.60e-62 | 2.10e+00 | -0.2126 |
| 6563 | SLC14A1 | GSM5252132_BPH389PrGF | Human | Prostate | BPH | 9.31e-10 | 1.68e+00 | -0.2247 |
| 6563 | SLC14A1 | GSM5252133_BPH389PrSF | Human | Prostate | BPH | 1.73e-04 | 1.81e+00 | -0.2027 |
| 6563 | SLC14A1 | GSM5252134_BPH511PrG_Fcol_3GEX | Human | Prostate | BPH | 8.51e-20 | 1.23e+00 | -0.1433 |
| 6563 | SLC14A1 | GSM5252135_BPH511PrPUr_Fcol_3GEX | Human | Prostate | BPH | 1.85e-19 | 1.42e+00 | -0.1833 |
| 6563 | SLC14A1 | GSM5252136_BPH556PrGA1_Fcol | Human | Prostate | BPH | 7.53e-28 | 1.71e+00 | -0.23 |
| 6563 | SLC14A1 | GSM5252137_BPH556PrGA2_Fcol | Human | Prostate | BPH | 3.84e-20 | 2.04e+00 | -0.23 |
| 6563 | SLC14A1 | 047563_1562-all-cells | Human | Prostate | BPH | 6.49e-22 | 8.40e-02 | 0.0791 |
| 6563 | SLC14A1 | 048752_1579-all-cells | Human | Prostate | BPH | 2.52e-60 | 9.70e-01 | 0.1008 |
| 6563 | SLC14A1 | 052095_1628-all-cells | Human | Prostate | BPH | 9.75e-23 | 6.74e-01 | 0.1032 |
| Page: 1 2 3 |
| Tissue | Expression Dynamics | Abbreviation |
| Esophagus | 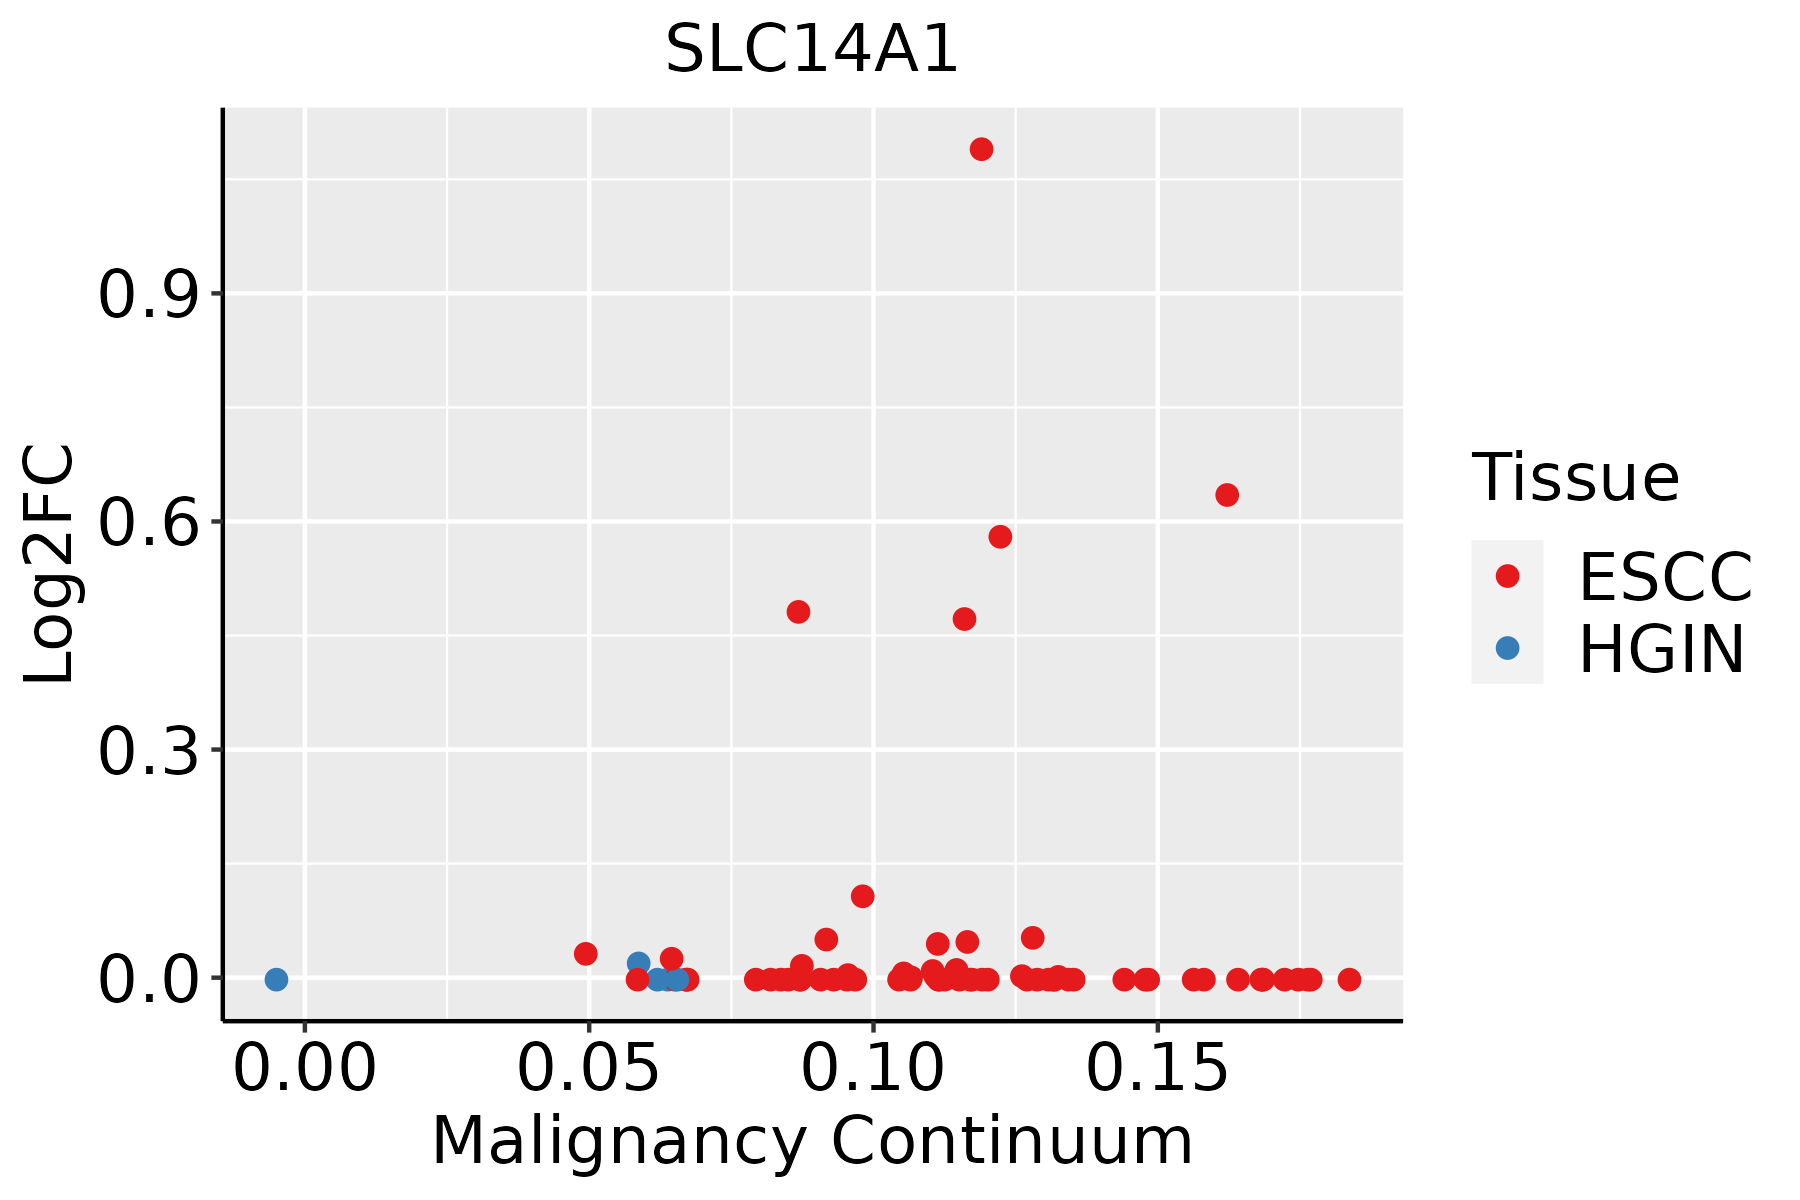 | ESCC: Esophageal squamous cell carcinoma |
| HGIN: High-grade intraepithelial neoplasias | ||
| LGIN: Low-grade intraepithelial neoplasias | ||
| Prostate | 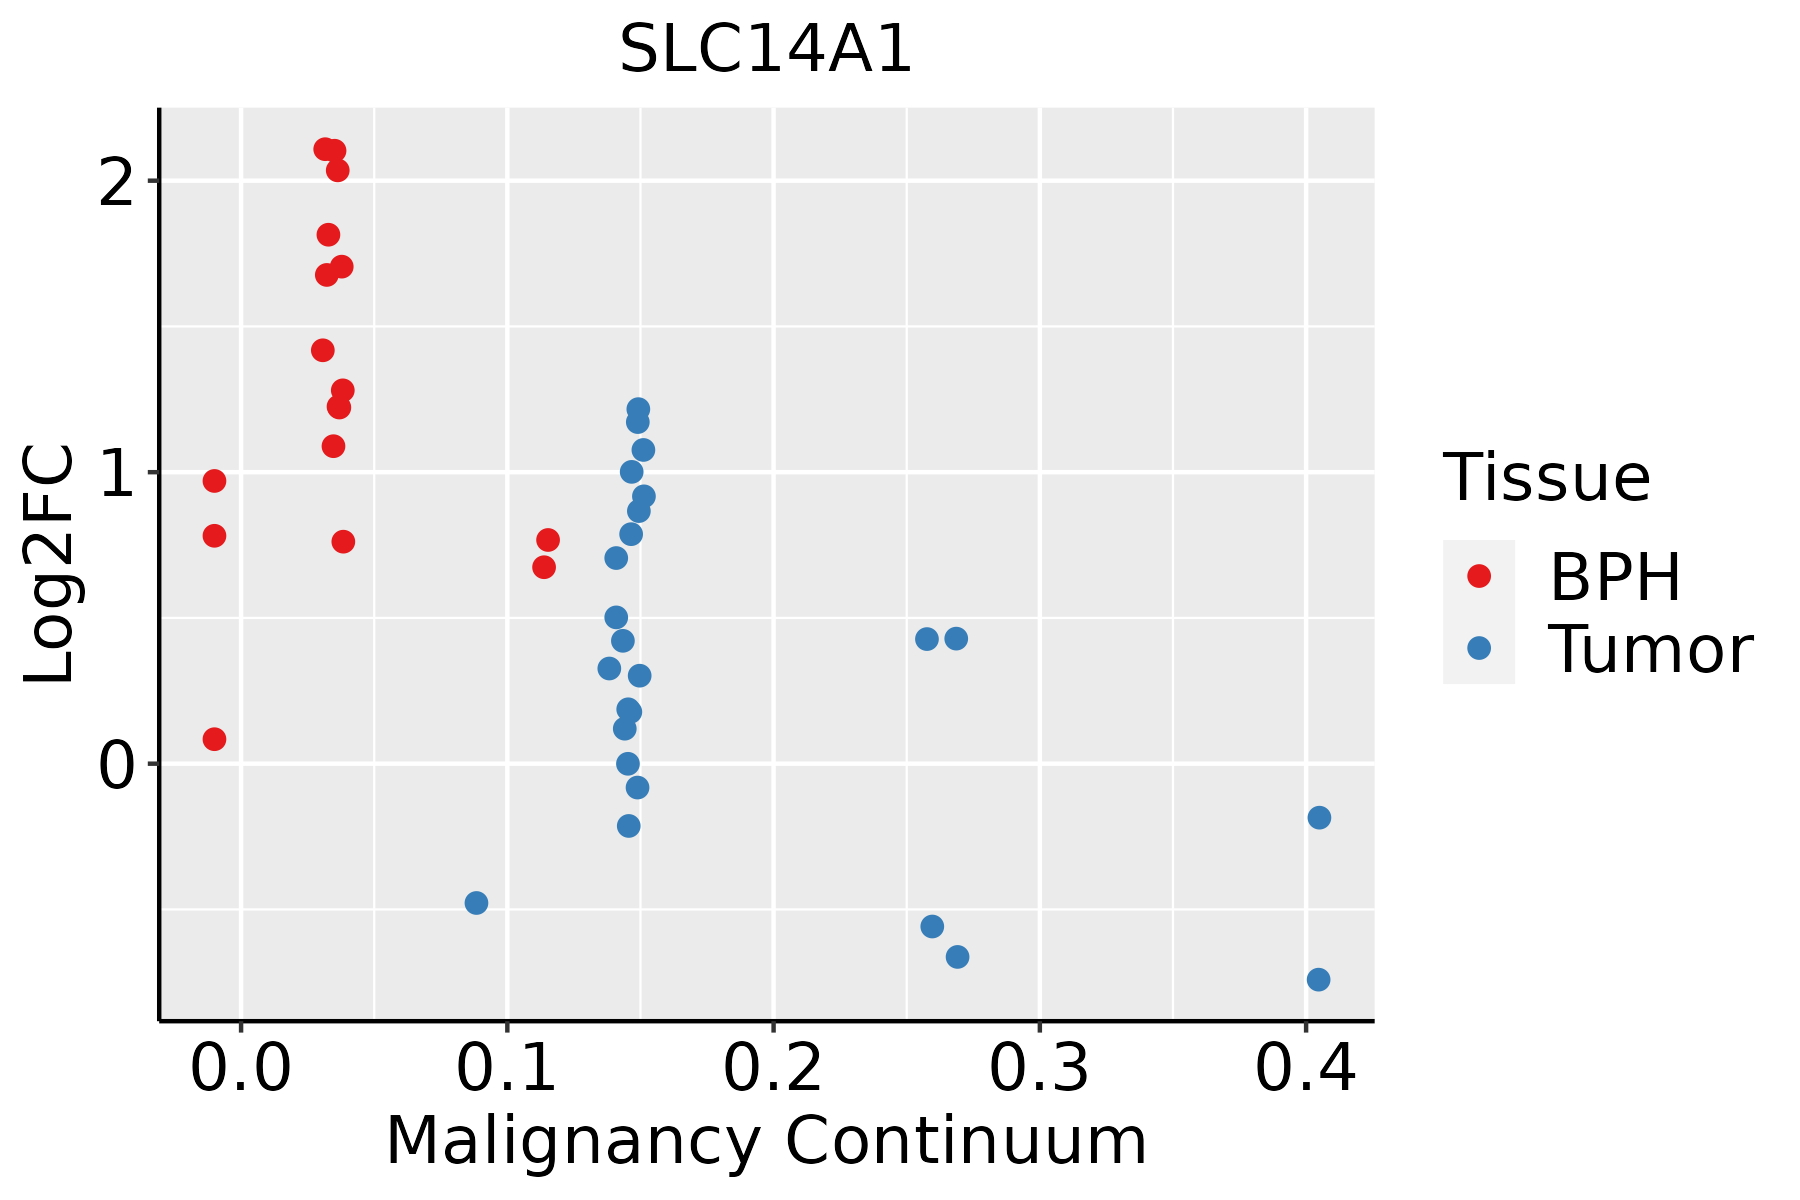 | BPH: Benign Prostatic Hyperplasia |
| ∗log2FC in expression of this searched gene in stem-like cells from each diseased tissue sample relative to stem-like cells in normal samples in each tissue plotted against the malignancy continuum. Samples are colored based on if they are from different disease stage. |
Top |
Malignant transformation related pathway analysis |
| Find out the enriched GO biological processes and KEGG pathways involved in transition from healthy to precancer to cancer |
| Tissue | Disease Stage | Enriched GO biological Processes |
| Colorectum | AD |  |
| Colorectum | SER |  |
| Colorectum | MSS |  |
| Colorectum | MSI-H |  |
| Colorectum | FAP |  |
| ∗Top 15 enriched GO BP terms are showed in the bar plot of each disease state in each tissue. Each row represents a significant GO biological process which is colored according to the -log10(p.adjust). |
| Page: 1 2 3 4 5 6 7 8 9 |
| GO ID | Tissue | Disease Stage | Description | Gene Ratio | Bg Ratio | pvalue | p.adjust | Count |
| Page: 1 |
| Pathway ID | Tissue | Disease Stage | Description | Gene Ratio | Bg Ratio | pvalue | p.adjust | qvalue | Count |
| Page: 1 |
Top |
Cell-cell communication analysis |
| Identification of potential cell-cell interactions between two cell types and their ligand-receptor pairs for different disease states |
| Ligand | Receptor | LRpair | Pathway | Tissue | Disease Stage |
| Page: 1 |
Top |
Single-cell gene regulatory network inference analysis |
| Find out the significant the regulons (TFs) and the target genes of each regulon across cell types for different disease states |
| TF | Cell Type | Tissue | Disease Stage | Target Gene | RSS | Regulon Activity |
| ∗The dot plots of a searched regulon are shown for all cell subpopulations in each disease state of each tissue based on the regulon specific score inferred using pySCENIC and by calculating the average expression. |
| Page: 1 |
Top |
Somatic mutation of malignant transformation related genes |
| Annotation of somatic variants for genes involved in malignant transformation |
| Hugo Symbol | Variant Class | Variant Classification | dbSNP RS | HGVSc | HGVSp | HGVSp Short | SWISSPROT | BIOTYPE | SIFT | PolyPhen | Tumor Sample Barcode | Tissue | Histology | Sex | Age | Stage | Therapy Types | Drugs | Outcome |
| SLC14A1 | SNV | Missense_Mutation | rs760579000 | c.886N>C | p.Trp296Arg | p.W296R | Q13336 | protein_coding | deleterious(0) | probably_damaging(0.999) | TCGA-AO-A128-01 | Breast | breast invasive carcinoma | Female | <65 | I/II | Chemotherapy | doxorubicin | SD |
| SLC14A1 | SNV | Missense_Mutation | novel | c.934N>T | p.Met312Leu | p.M312L | Q13336 | protein_coding | tolerated(0.4) | benign(0.001) | TCGA-LL-A73Y-01 | Breast | breast invasive carcinoma | Female | >=65 | I/II | Chemotherapy | taxotere | SD |
| SLC14A1 | deletion | Frame_Shift_Del | novel | c.906delN | p.Gly303GlufsTer16 | p.G303Efs*16 | Q13336 | protein_coding | TCGA-EW-A2FV-01 | Breast | breast invasive carcinoma | Female | <65 | III/IV | Chemotherapy | docetaxel | SD | ||
| SLC14A1 | SNV | Missense_Mutation | novel | c.167C>T | p.Ala56Val | p.A56V | Q13336 | protein_coding | tolerated(0.35) | benign(0.359) | TCGA-AA-3663-01 | Colorectum | colon adenocarcinoma | Male | <65 | I/II | Unknown | Unknown | SD |
| SLC14A1 | SNV | Missense_Mutation | novel | c.284C>T | p.Thr95Ile | p.T95I | Q13336 | protein_coding | deleterious(0) | benign(0.295) | TCGA-AA-3688-01 | Colorectum | colon adenocarcinoma | Male | >=65 | III/IV | Unknown | Unknown | SD |
| SLC14A1 | SNV | Missense_Mutation | novel | c.1189N>T | p.Pro397Ser | p.P397S | Q13336 | protein_coding | tolerated(0.11) | benign(0.072) | TCGA-AA-3950-01 | Colorectum | colon adenocarcinoma | Female | >=65 | I/II | Unknown | Unknown | SD |
| SLC14A1 | SNV | Missense_Mutation | c.92N>T | p.Ala31Val | p.A31V | Q13336 | protein_coding | tolerated_low_confidence(0.26) | benign(0.001) | TCGA-AA-3968-01 | Colorectum | colon adenocarcinoma | Female | <65 | I/II | Unknown | Unknown | SD | |
| SLC14A1 | SNV | Missense_Mutation | c.1236N>A | p.Asn412Lys | p.N412K | Q13336 | protein_coding | deleterious(0) | probably_damaging(0.91) | TCGA-AD-A5EJ-01 | Colorectum | colon adenocarcinoma | Female | >=65 | I/II | Unknown | Unknown | SD | |
| SLC14A1 | SNV | Missense_Mutation | novel | c.166N>A | p.Ala56Thr | p.A56T | Q13336 | protein_coding | tolerated(0.66) | benign(0.028) | TCGA-AZ-4315-01 | Colorectum | colon adenocarcinoma | Male | <65 | I/II | Unknown | Unknown | SD |
| SLC14A1 | SNV | Missense_Mutation | c.421N>G | p.Leu141Val | p.L141V | Q13336 | protein_coding | deleterious(0.02) | probably_damaging(0.96) | TCGA-AZ-6598-01 | Colorectum | colon adenocarcinoma | Female | >=65 | I/II | Unknown | Unknown | SD |
| Page: 1 2 3 4 5 6 |
Top |
Related drugs of malignant transformation related genes |
| Identification of chemicals and drugs interact with genes involved in malignant transfromation |
| (DGIdb 4.0) |
| Entrez ID | Symbol | Category | Interaction Types | Drug Claim Name | Drug Name | PMIDs |
| 6563 | SLC14A1 | TRANSPORTER | inhibitor | 252827538 |
| Page: 1 |

Copyright 2023-Present -The University of Texas Health Science Center at Houston |