
|
|||||
|
 | |
| |
| |
| |
| |
| |
|
Gene: SLC12A9 |
Gene summary for SLC12A9 |
| Gene information | Species | Human | Gene symbol | SLC12A9 | Gene ID | 56996 |
| Gene name | solute carrier family 12 member 9 | |
| Gene Alias | CCC6 | |
| Cytomap | 7q22.1 | |
| Gene Type | protein-coding | GO ID | GO:0006810 | UniProtAcc | Q9BXP2 |
Top |
Malignant transformation analysis |
| Identification of the aberrant gene expression in precancerous and cancerous lesions by comparing the gene expression of stem-like cells in diseased tissues with normal stem cells |
| Entrez ID | Symbol | Replicates | Species | Organ | Tissue | Adj P-value | Log2FC | Malignancy |
| 56996 | SLC12A9 | LZE22T | Human | Esophagus | ESCC | 1.21e-03 | 3.61e-01 | 0.068 |
| 56996 | SLC12A9 | LZE24T | Human | Esophagus | ESCC | 4.20e-10 | 2.76e-01 | 0.0596 |
| 56996 | SLC12A9 | P1T-E | Human | Esophagus | ESCC | 7.27e-13 | 4.51e-01 | 0.0875 |
| 56996 | SLC12A9 | P2T-E | Human | Esophagus | ESCC | 4.05e-58 | 8.88e-01 | 0.1177 |
| 56996 | SLC12A9 | P4T-E | Human | Esophagus | ESCC | 3.25e-10 | 2.07e-01 | 0.1323 |
| 56996 | SLC12A9 | P5T-E | Human | Esophagus | ESCC | 1.25e-08 | 9.82e-02 | 0.1327 |
| 56996 | SLC12A9 | P8T-E | Human | Esophagus | ESCC | 1.22e-16 | 2.87e-01 | 0.0889 |
| 56996 | SLC12A9 | P9T-E | Human | Esophagus | ESCC | 1.45e-11 | 2.56e-01 | 0.1131 |
| 56996 | SLC12A9 | P10T-E | Human | Esophagus | ESCC | 2.79e-16 | 2.88e-01 | 0.116 |
| 56996 | SLC12A9 | P11T-E | Human | Esophagus | ESCC | 3.13e-06 | 2.66e-01 | 0.1426 |
| 56996 | SLC12A9 | P12T-E | Human | Esophagus | ESCC | 5.03e-22 | 4.52e-01 | 0.1122 |
| 56996 | SLC12A9 | P15T-E | Human | Esophagus | ESCC | 1.83e-28 | 5.67e-01 | 0.1149 |
| 56996 | SLC12A9 | P16T-E | Human | Esophagus | ESCC | 3.83e-27 | 4.59e-01 | 0.1153 |
| 56996 | SLC12A9 | P17T-E | Human | Esophagus | ESCC | 2.68e-02 | 1.78e-01 | 0.1278 |
| 56996 | SLC12A9 | P19T-E | Human | Esophagus | ESCC | 1.20e-05 | 3.47e-01 | 0.1662 |
| 56996 | SLC12A9 | P20T-E | Human | Esophagus | ESCC | 5.35e-36 | 6.02e-01 | 0.1124 |
| 56996 | SLC12A9 | P21T-E | Human | Esophagus | ESCC | 4.23e-28 | 4.65e-01 | 0.1617 |
| 56996 | SLC12A9 | P22T-E | Human | Esophagus | ESCC | 2.24e-06 | 1.37e-01 | 0.1236 |
| 56996 | SLC12A9 | P23T-E | Human | Esophagus | ESCC | 7.55e-36 | 7.92e-01 | 0.108 |
| 56996 | SLC12A9 | P24T-E | Human | Esophagus | ESCC | 5.97e-11 | 2.35e-01 | 0.1287 |
| Page: 1 2 3 4 5 |
| Tissue | Expression Dynamics | Abbreviation |
| Esophagus | 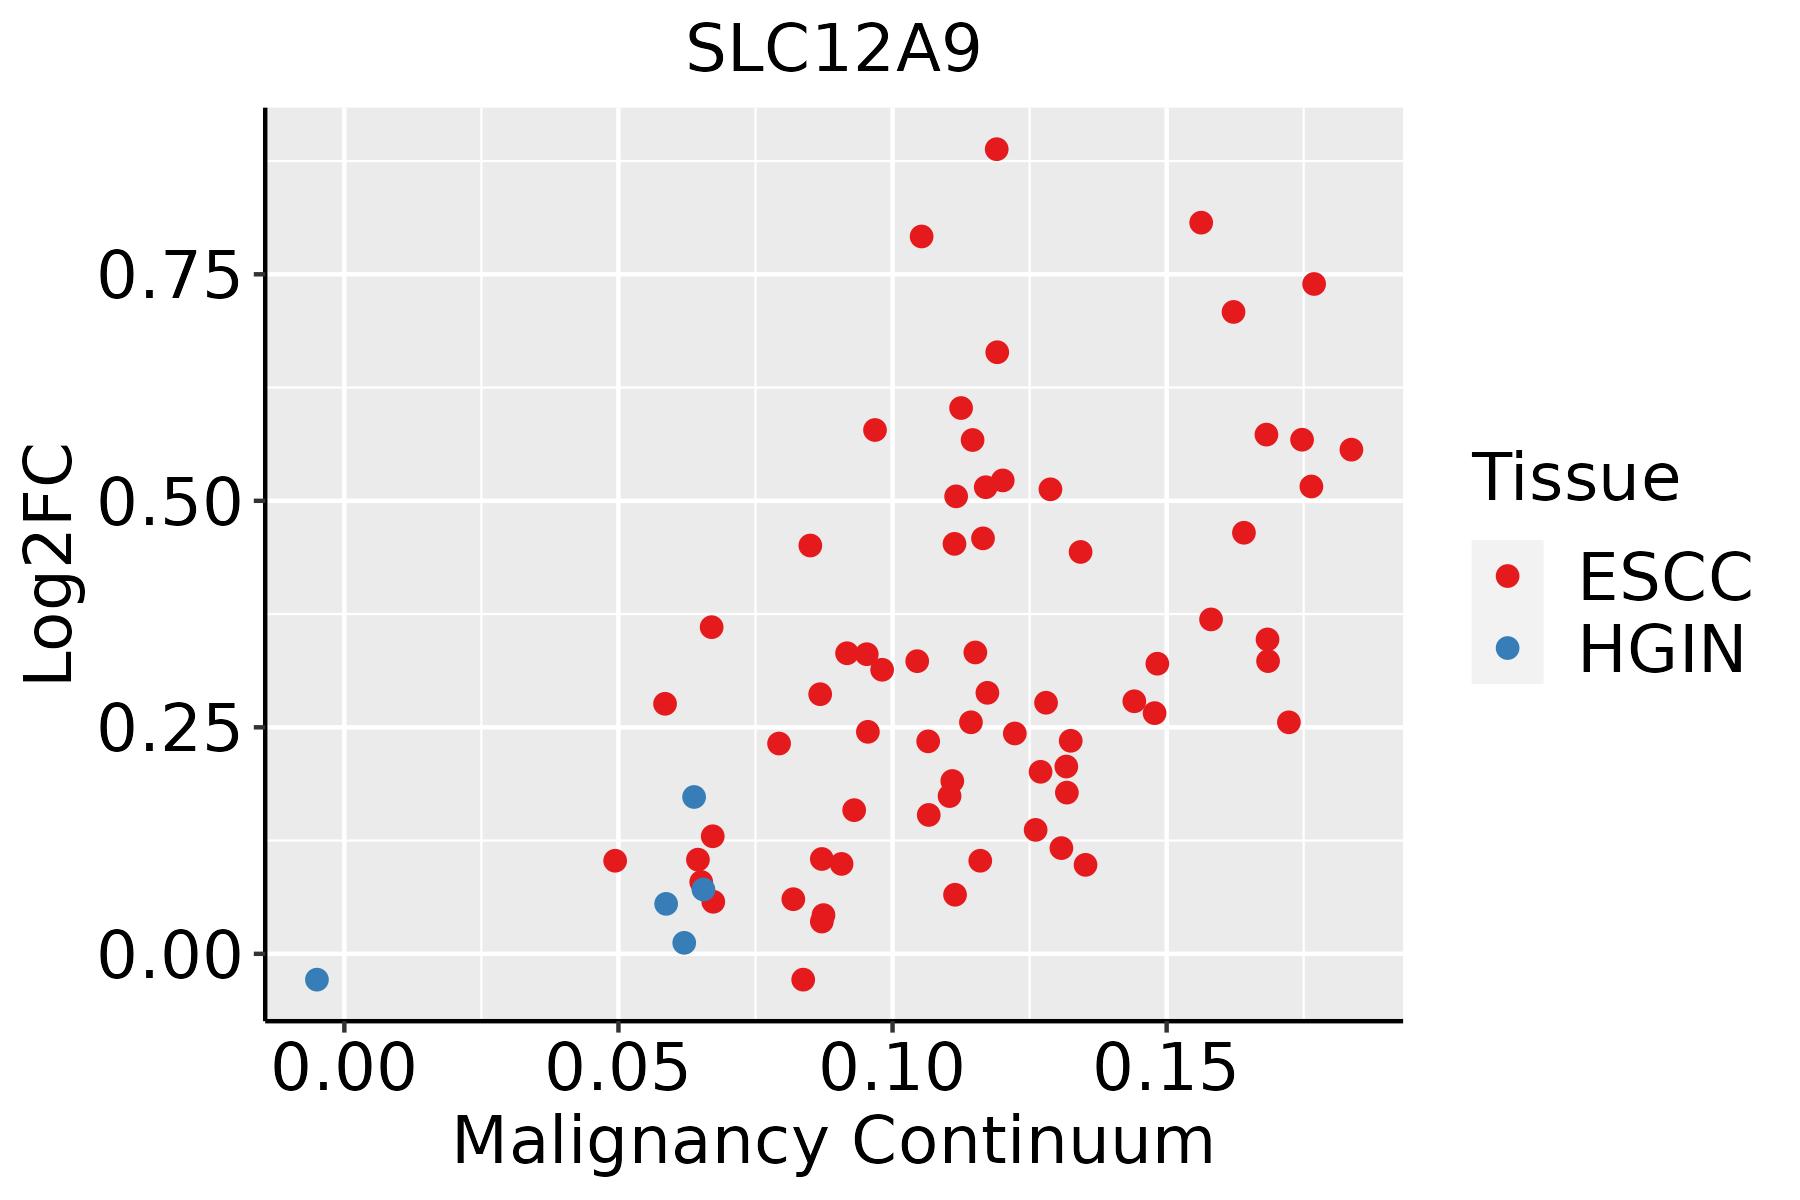 | ESCC: Esophageal squamous cell carcinoma |
| HGIN: High-grade intraepithelial neoplasias | ||
| LGIN: Low-grade intraepithelial neoplasias | ||
| Liver |  | HCC: Hepatocellular carcinoma |
| NAFLD: Non-alcoholic fatty liver disease | ||
| Oral Cavity |  | EOLP: Erosive Oral lichen planus |
| LP: leukoplakia | ||
| NEOLP: Non-erosive oral lichen planus | ||
| OSCC: Oral squamous cell carcinoma | ||
| Skin | 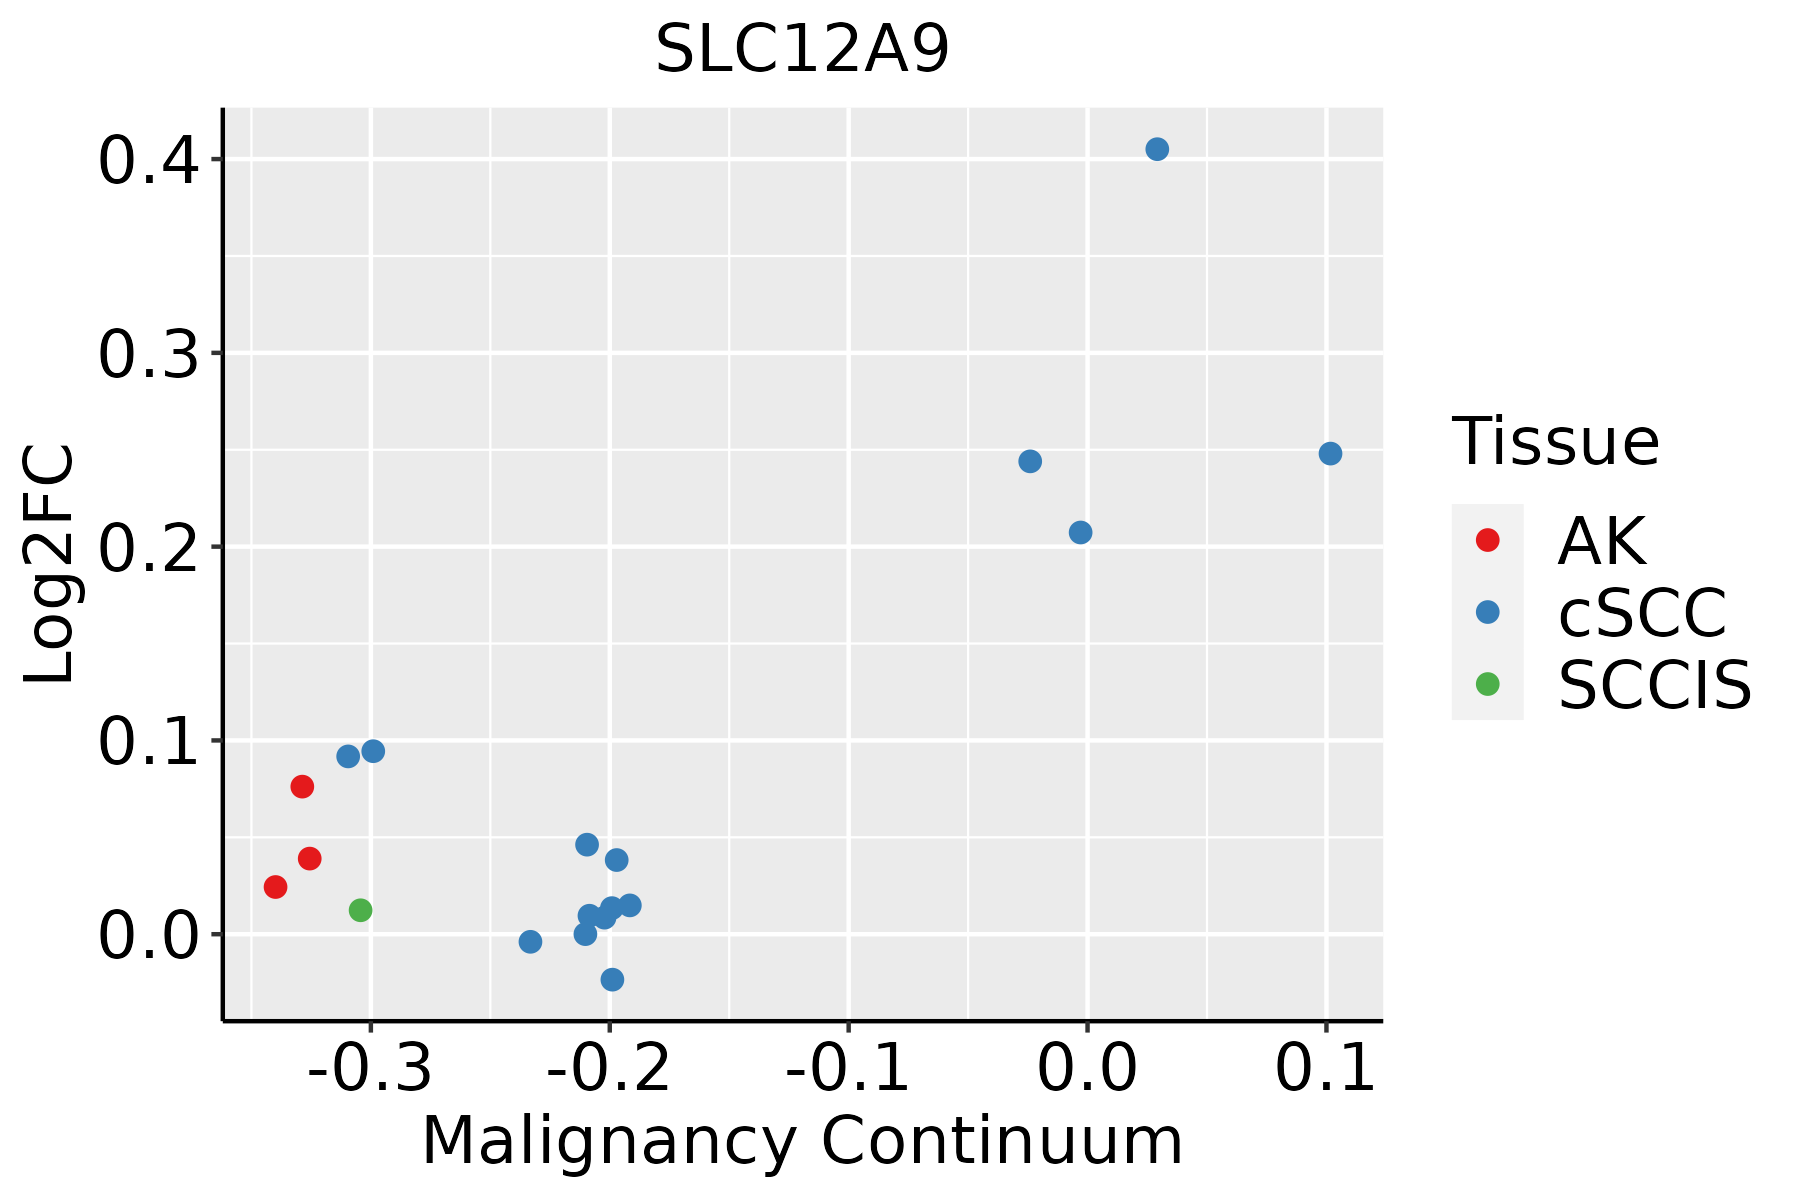 | AK: Actinic keratosis |
| cSCC: Cutaneous squamous cell carcinoma | ||
| SCCIS:squamous cell carcinoma in situ | ||
| Thyroid | 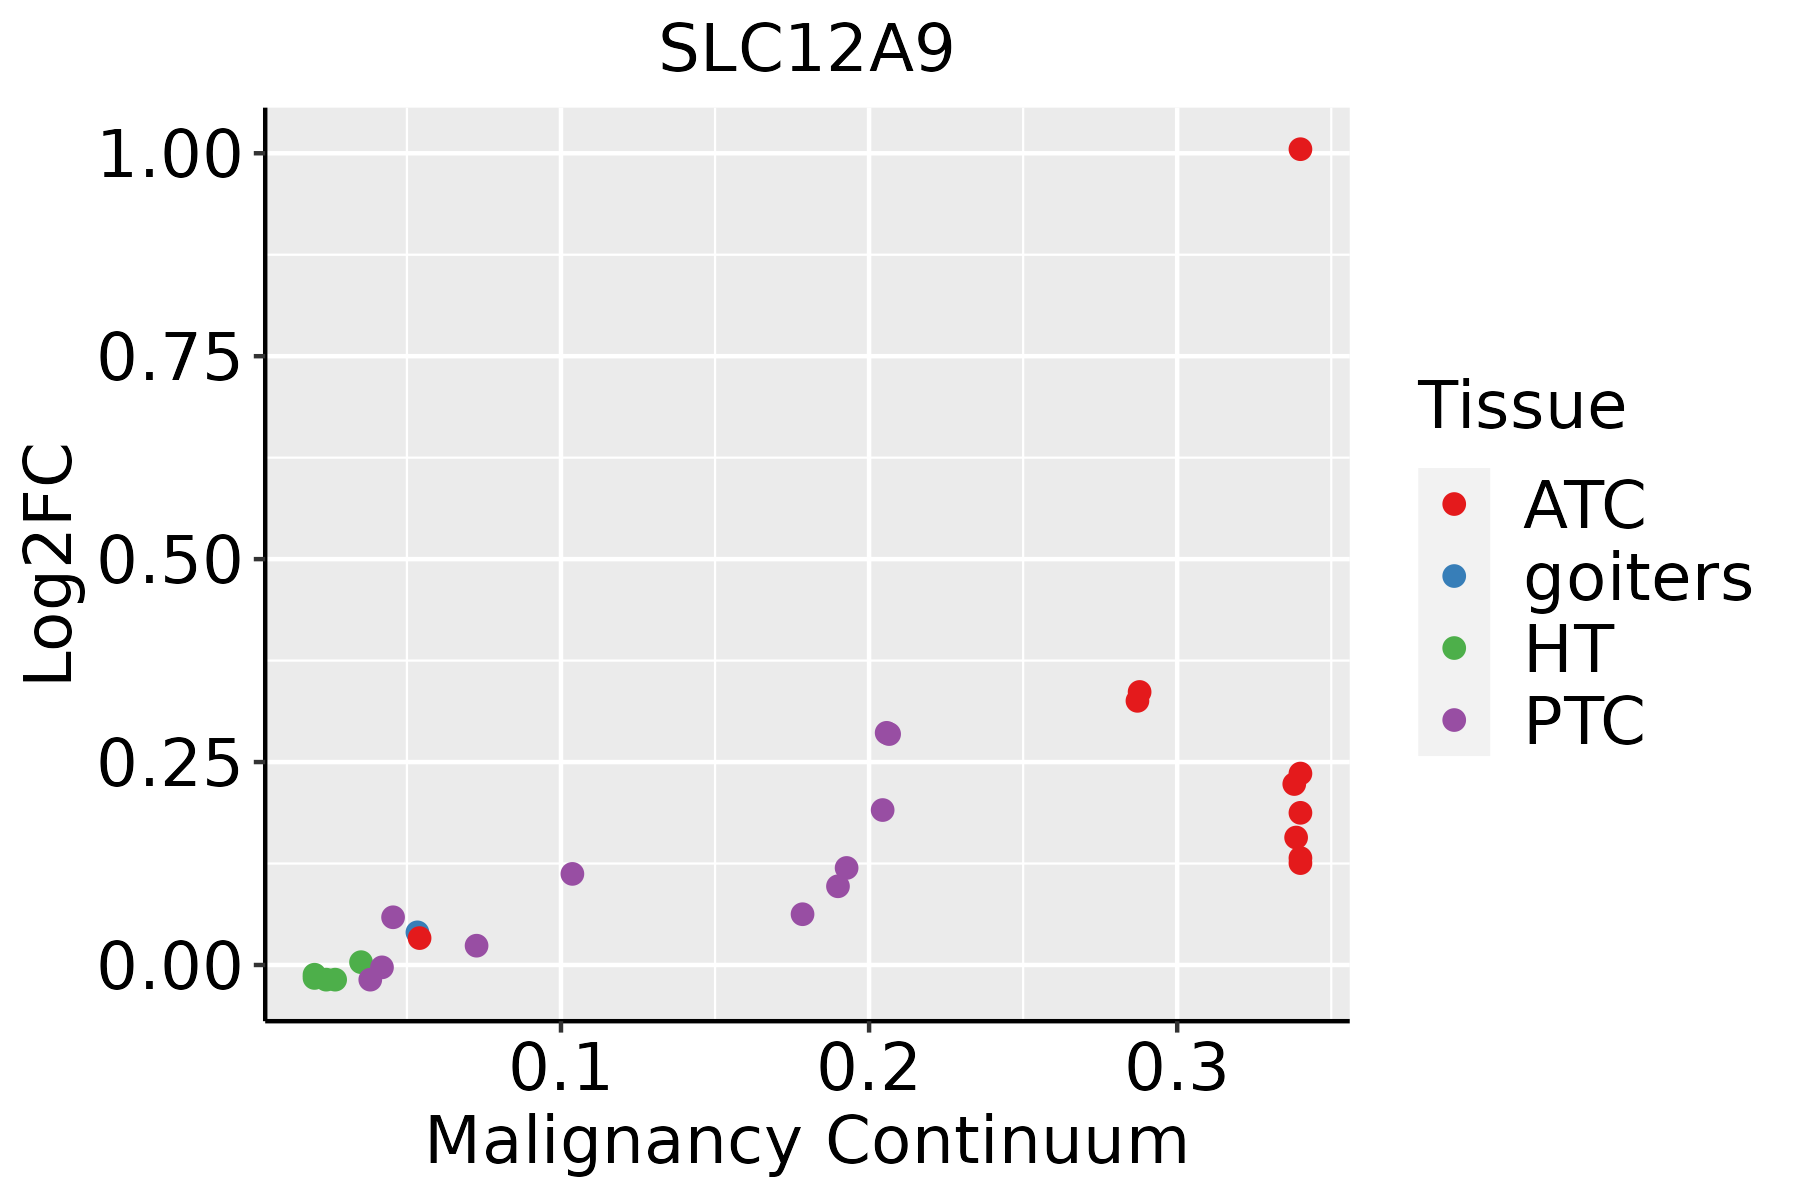 | ATC: Anaplastic thyroid cancer |
| HT: Hashimoto's thyroiditis | ||
| PTC: Papillary thyroid cancer |
| ∗log2FC in expression of this searched gene in stem-like cells from each diseased tissue sample relative to stem-like cells in normal samples in each tissue plotted against the malignancy continuum. Samples are colored based on if they are from different disease stage. |
Top |
Malignant transformation related pathway analysis |
| Find out the enriched GO biological processes and KEGG pathways involved in transition from healthy to precancer to cancer |
| Tissue | Disease Stage | Enriched GO biological Processes |
| Colorectum | AD |  |
| Colorectum | SER |  |
| Colorectum | MSS |  |
| Colorectum | MSI-H |  |
| Colorectum | FAP |  |
| ∗Top 15 enriched GO BP terms are showed in the bar plot of each disease state in each tissue. Each row represents a significant GO biological process which is colored according to the -log10(p.adjust). |
| Page: 1 2 3 4 5 6 7 8 9 |
| GO ID | Tissue | Disease Stage | Description | Gene Ratio | Bg Ratio | pvalue | p.adjust | Count |
| GO:003253520 | Esophagus | ESCC | regulation of cellular component size | 227/8552 | 383/18723 | 4.77e-08 | 8.60e-07 | 227 |
| GO:00083619 | Esophagus | ESCC | regulation of cell size | 107/8552 | 181/18723 | 1.81e-04 | 1.16e-03 | 107 |
| GO:003253522 | Liver | HCC | regulation of cellular component size | 217/7958 | 383/18723 | 1.28e-08 | 3.14e-07 | 217 |
| GO:00083614 | Liver | HCC | regulation of cell size | 95/7958 | 181/18723 | 4.15e-03 | 1.81e-02 | 95 |
| GO:003253519 | Oral cavity | OSCC | regulation of cellular component size | 201/7305 | 383/18723 | 4.80e-08 | 8.88e-07 | 201 |
| GO:00083618 | Oral cavity | OSCC | regulation of cell size | 92/7305 | 181/18723 | 7.86e-04 | 4.26e-03 | 92 |
| GO:0032535110 | Oral cavity | LP | regulation of cellular component size | 128/4623 | 383/18723 | 6.56e-05 | 8.80e-04 | 128 |
| GO:0032535111 | Skin | cSCC | regulation of cellular component size | 131/4864 | 383/18723 | 1.89e-04 | 1.59e-03 | 131 |
| GO:0032535112 | Thyroid | PTC | regulation of cellular component size | 181/5968 | 383/18723 | 1.70e-10 | 5.64e-09 | 181 |
| GO:000836115 | Thyroid | PTC | regulation of cell size | 83/5968 | 181/18723 | 5.45e-05 | 4.84e-04 | 83 |
| GO:003253526 | Thyroid | ATC | regulation of cellular component size | 191/6293 | 383/18723 | 2.51e-11 | 8.69e-10 | 191 |
| GO:000836122 | Thyroid | ATC | regulation of cell size | 89/6293 | 181/18723 | 1.01e-05 | 1.00e-04 | 89 |
| Page: 1 |
| Pathway ID | Tissue | Disease Stage | Description | Gene Ratio | Bg Ratio | pvalue | p.adjust | qvalue | Count |
| Page: 1 |
Top |
Cell-cell communication analysis |
| Identification of potential cell-cell interactions between two cell types and their ligand-receptor pairs for different disease states |
| Ligand | Receptor | LRpair | Pathway | Tissue | Disease Stage |
| Page: 1 |
Top |
Single-cell gene regulatory network inference analysis |
| Find out the significant the regulons (TFs) and the target genes of each regulon across cell types for different disease states |
| TF | Cell Type | Tissue | Disease Stage | Target Gene | RSS | Regulon Activity |
| ∗The dot plots of a searched regulon are shown for all cell subpopulations in each disease state of each tissue based on the regulon specific score inferred using pySCENIC and by calculating the average expression. |
| Page: 1 |
Top |
Somatic mutation of malignant transformation related genes |
| Annotation of somatic variants for genes involved in malignant transformation |
| Hugo Symbol | Variant Class | Variant Classification | dbSNP RS | HGVSc | HGVSp | HGVSp Short | SWISSPROT | BIOTYPE | SIFT | PolyPhen | Tumor Sample Barcode | Tissue | Histology | Sex | Age | Stage | Therapy Types | Drugs | Outcome |
| SLC12A9 | SNV | Missense_Mutation | c.1576N>A | p.His526Asn | p.H526N | Q9BXP2 | protein_coding | deleterious(0) | probably_damaging(0.998) | TCGA-A8-A08J-01 | Breast | breast invasive carcinoma | Female | <65 | III/IV | Unknown | Unknown | PD | |
| SLC12A9 | SNV | Missense_Mutation | c.692N>A | p.Ser231Tyr | p.S231Y | Q9BXP2 | protein_coding | deleterious(0.03) | probably_damaging(0.935) | TCGA-AC-A23H-01 | Breast | breast invasive carcinoma | Female | >=65 | I/II | Unknown | Unknown | PD | |
| SLC12A9 | SNV | Missense_Mutation | novel | c.1855N>T | p.Leu619Phe | p.L619F | Q9BXP2 | protein_coding | tolerated(0.1) | benign(0.414) | TCGA-AR-A5QM-01 | Breast | breast invasive carcinoma | Female | <65 | I/II | Hormone Therapy | anastrozole | PD |
| SLC12A9 | insertion | Frame_Shift_Ins | novel | c.712_713insCCCTTCTT | p.His238ProfsTer13 | p.H238Pfs*13 | Q9BXP2 | protein_coding | TCGA-AN-A0FX-01 | Breast | breast invasive carcinoma | Female | <65 | I/II | Unknown | Unknown | SD | ||
| SLC12A9 | insertion | In_Frame_Ins | novel | c.713_714insTTTATTTATTTATTTTGAGATGGAGTCTTG | p.His238_Phe239insLeuPheIleTyrPheGluMetGluSerCys | p.H238_F239insLFIYFEMESC | Q9BXP2 | protein_coding | TCGA-AN-A0FX-01 | Breast | breast invasive carcinoma | Female | <65 | I/II | Unknown | Unknown | SD | ||
| SLC12A9 | insertion | Frame_Shift_Ins | novel | c.712_713insCAGTTTTTGTGGAGCTGGGGTTTCACAATGTTGCCCAGGTTAGTTTT | p.His238ProfsTer26 | p.H238Pfs*26 | Q9BXP2 | protein_coding | TCGA-AO-A03T-01 | Breast | breast invasive carcinoma | Female | <65 | I/II | Chemotherapy | cyclophosphamide | SD | ||
| SLC12A9 | insertion | Frame_Shift_Ins | novel | c.2147_2148insTTTGCACAACAGA | p.Gly717LeufsTer51 | p.G717Lfs*51 | Q9BXP2 | protein_coding | TCGA-AQ-A04J-01 | Breast | breast invasive carcinoma | Female | <65 | I/II | Chemotherapy | cytoxan | SD | ||
| SLC12A9 | SNV | Missense_Mutation | c.643G>A | p.Gly215Arg | p.G215R | Q9BXP2 | protein_coding | tolerated(0.19) | benign(0.014) | TCGA-2W-A8YY-01 | Cervix | cervical & endocervical cancer | Female | <65 | I/II | Chemotherapy | cisplatin | CR | |
| SLC12A9 | SNV | Missense_Mutation | c.1954N>A | p.Asp652Asn | p.D652N | Q9BXP2 | protein_coding | tolerated(0.46) | benign(0.001) | TCGA-Q1-A5R2-01 | Cervix | cervical & endocervical cancer | Female | <65 | I/II | Chemotherapy | cisplatin | PR | |
| SLC12A9 | SNV | Missense_Mutation | novel | c.2300G>T | p.Arg767Leu | p.R767L | Q9BXP2 | protein_coding | deleterious(0) | probably_damaging(1) | TCGA-5M-AAT4-01 | Colorectum | colon adenocarcinoma | Male | >=65 | III/IV | Unknown | Unknown | PD |
| Page: 1 2 3 4 5 6 7 8 9 10 |
Top |
Related drugs of malignant transformation related genes |
| Identification of chemicals and drugs interact with genes involved in malignant transfromation |
| (DGIdb 4.0) |
| Entrez ID | Symbol | Category | Interaction Types | Drug Claim Name | Drug Name | PMIDs |
| Page: 1 |

Copyright 2023-Present -The University of Texas Health Science Center at Houston |