
|
|||||
|
 | |
| |
| |
| |
| |
| |
|
Gene: SLC12A7 |
Gene summary for SLC12A7 |
| Gene information | Species | Human | Gene symbol | SLC12A7 | Gene ID | 10723 |
| Gene name | solute carrier family 12 member 7 | |
| Gene Alias | KCC4 | |
| Cytomap | 5p15.33 | |
| Gene Type | protein-coding | GO ID | GO:0006810 | UniProtAcc | Q9Y666 |
Top |
Malignant transformation analysis |
| Identification of the aberrant gene expression in precancerous and cancerous lesions by comparing the gene expression of stem-like cells in diseased tissues with normal stem cells |
| Entrez ID | Symbol | Replicates | Species | Organ | Tissue | Adj P-value | Log2FC | Malignancy |
| 10723 | SLC12A7 | HTA11_3410_2000001011 | Human | Colorectum | AD | 6.63e-03 | 1.72e-01 | 0.0155 |
| 10723 | SLC12A7 | HTA11_2487_2000001011 | Human | Colorectum | SER | 5.90e-07 | 4.07e-01 | -0.1808 |
| 10723 | SLC12A7 | HTA11_1938_2000001011 | Human | Colorectum | AD | 9.42e-10 | 6.06e-01 | -0.0811 |
| 10723 | SLC12A7 | HTA11_78_2000001011 | Human | Colorectum | AD | 1.57e-02 | 3.15e-01 | -0.1088 |
| 10723 | SLC12A7 | HTA11_347_2000001011 | Human | Colorectum | AD | 1.03e-14 | 4.37e-01 | -0.1954 |
| 10723 | SLC12A7 | HTA11_411_2000001011 | Human | Colorectum | SER | 6.66e-03 | 5.84e-01 | -0.2602 |
| 10723 | SLC12A7 | HTA11_3361_2000001011 | Human | Colorectum | AD | 7.23e-07 | 4.55e-01 | -0.1207 |
| 10723 | SLC12A7 | HTA11_83_2000001011 | Human | Colorectum | SER | 1.12e-08 | 5.71e-01 | -0.1526 |
| 10723 | SLC12A7 | HTA11_696_2000001011 | Human | Colorectum | AD | 6.11e-11 | 4.50e-01 | -0.1464 |
| 10723 | SLC12A7 | HTA11_866_2000001011 | Human | Colorectum | AD | 1.46e-10 | 4.37e-01 | -0.1001 |
| 10723 | SLC12A7 | HTA11_1391_2000001011 | Human | Colorectum | AD | 3.11e-22 | 8.08e-01 | -0.059 |
| 10723 | SLC12A7 | HTA11_546_2000001011 | Human | Colorectum | AD | 4.46e-02 | 3.34e-01 | -0.0842 |
| 10723 | SLC12A7 | HTA11_866_3004761011 | Human | Colorectum | AD | 6.20e-12 | 4.98e-01 | 0.096 |
| 10723 | SLC12A7 | HTA11_10711_2000001011 | Human | Colorectum | AD | 5.42e-03 | 2.37e-01 | 0.0338 |
| 10723 | SLC12A7 | HTA11_7696_3000711011 | Human | Colorectum | AD | 1.43e-05 | 2.77e-01 | 0.0674 |
| 10723 | SLC12A7 | HTA11_6818_2000001011 | Human | Colorectum | AD | 3.29e-02 | 3.08e-01 | 0.0112 |
| 10723 | SLC12A7 | HTA11_6818_2000001021 | Human | Colorectum | AD | 1.01e-08 | 4.60e-01 | 0.0588 |
| 10723 | SLC12A7 | HTA11_99999970781_79442 | Human | Colorectum | MSS | 1.51e-06 | 3.96e-01 | 0.294 |
| 10723 | SLC12A7 | HTA11_99999971662_82457 | Human | Colorectum | MSS | 6.67e-34 | 9.71e-01 | 0.3859 |
| 10723 | SLC12A7 | HTA11_99999973899_84307 | Human | Colorectum | MSS | 1.29e-03 | 4.73e-01 | 0.2585 |
| Page: 1 2 3 4 5 6 |
| Tissue | Expression Dynamics | Abbreviation |
| Colorectum (GSE201348) | 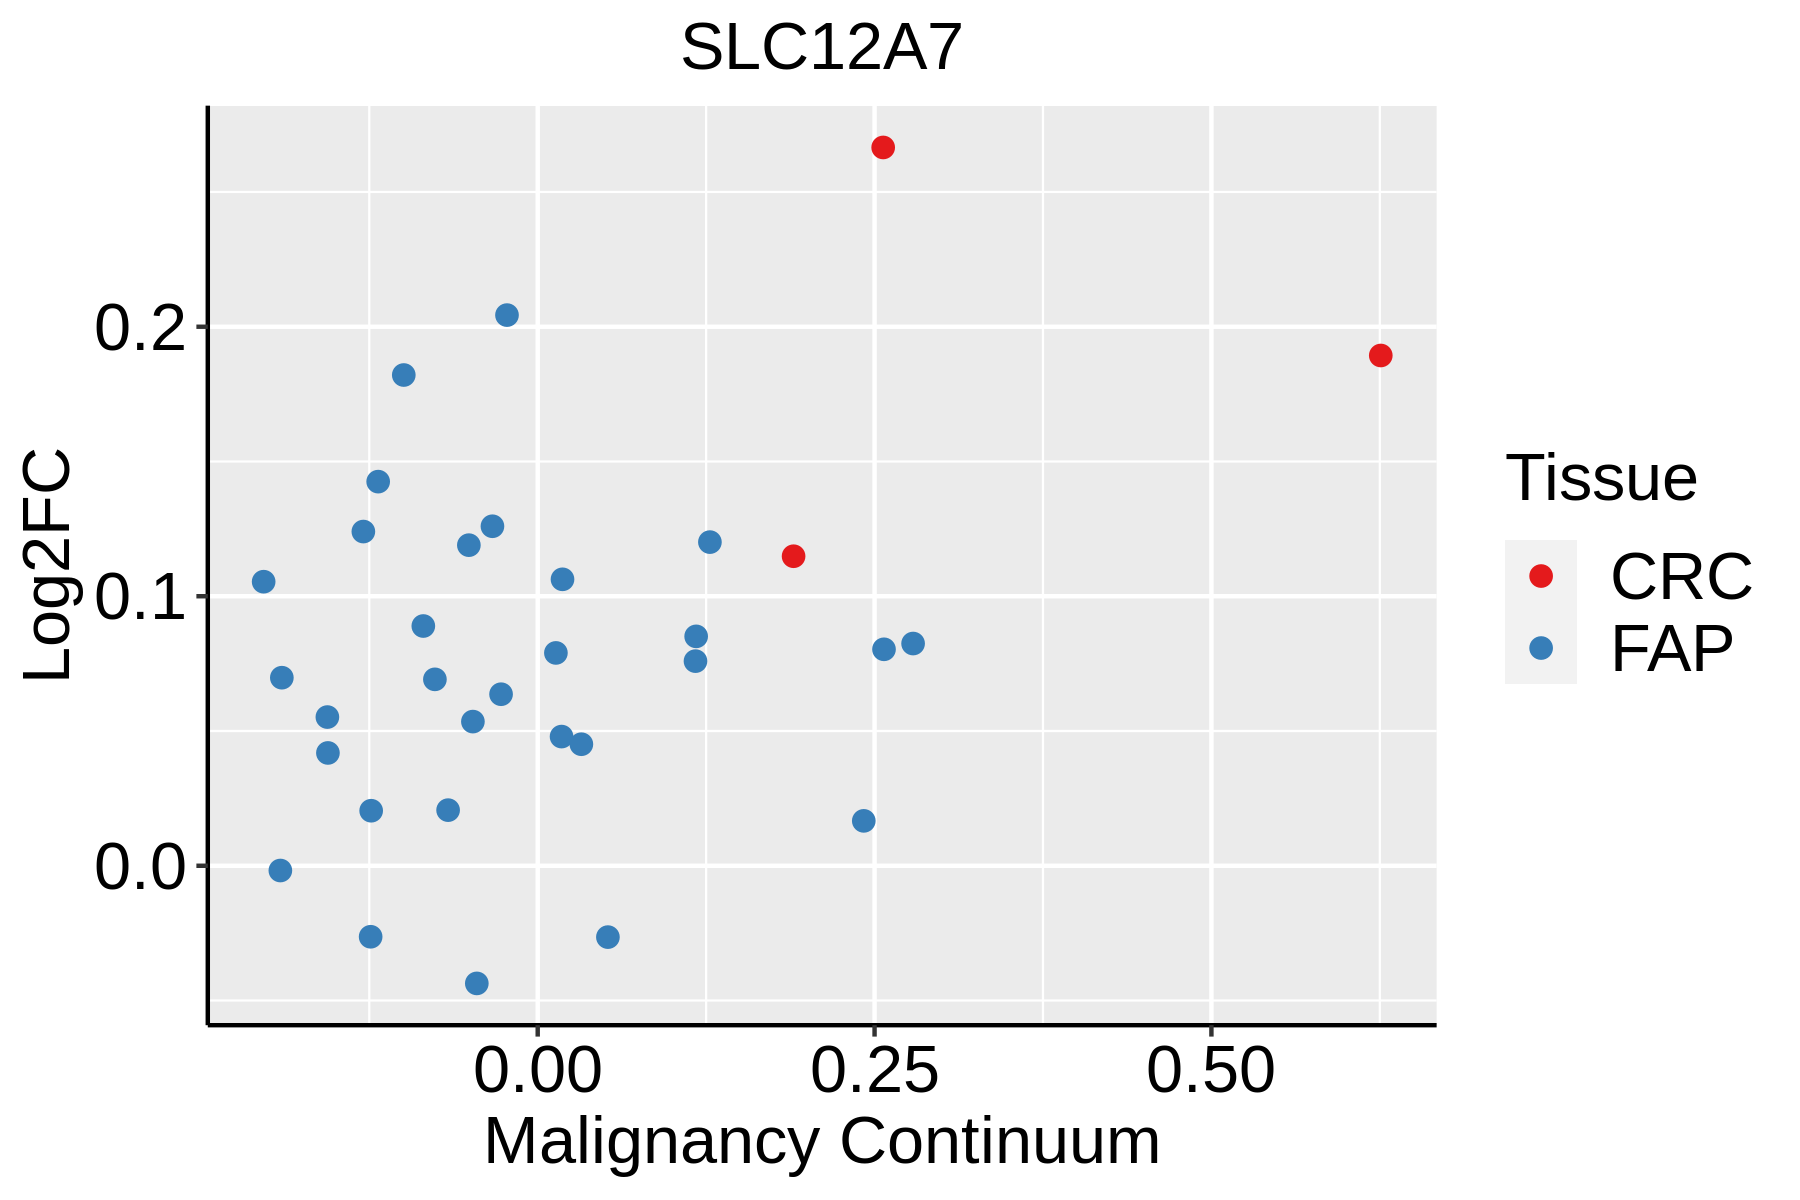 | FAP: Familial adenomatous polyposis |
| CRC: Colorectal cancer | ||
| Colorectum (HTA11) |  | AD: Adenomas |
| SER: Sessile serrated lesions | ||
| MSI-H: Microsatellite-high colorectal cancer | ||
| MSS: Microsatellite stable colorectal cancer | ||
| Esophagus | 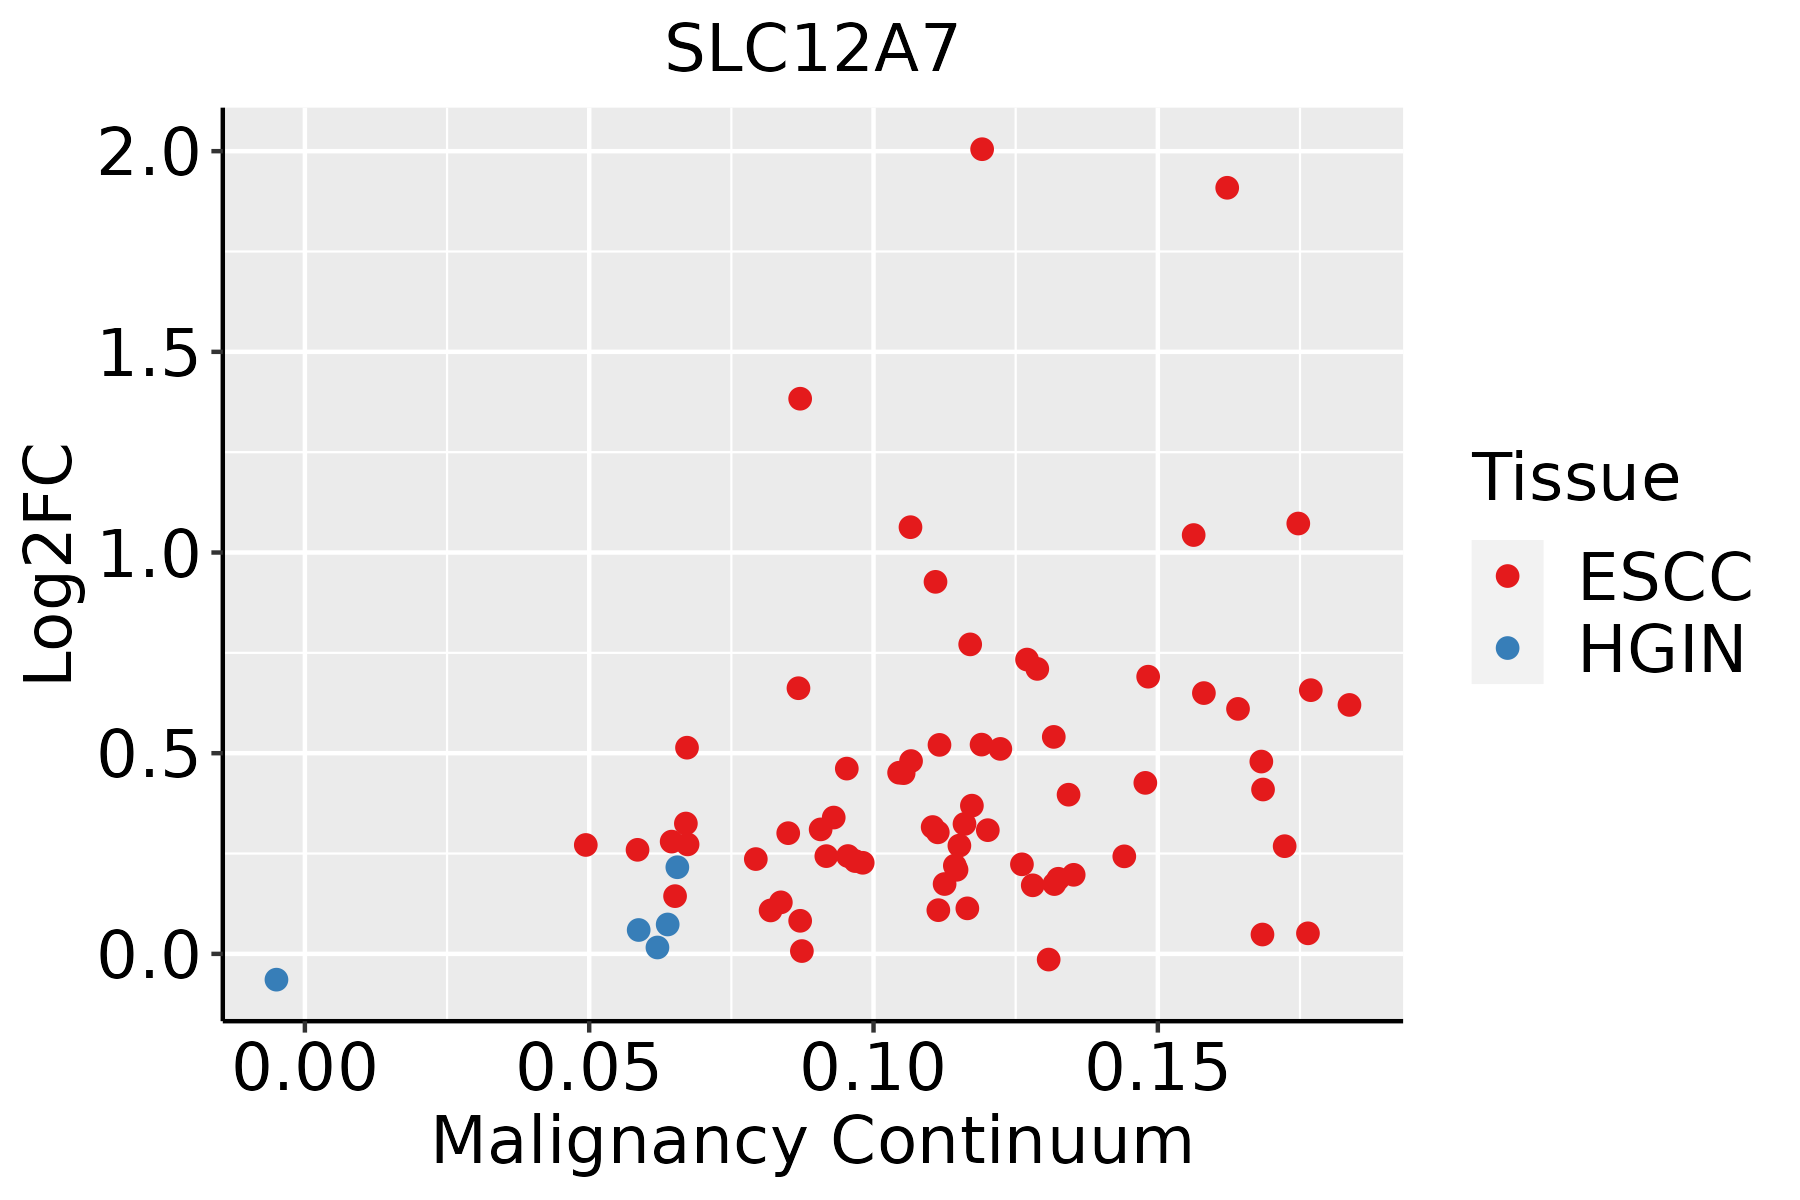 | ESCC: Esophageal squamous cell carcinoma |
| HGIN: High-grade intraepithelial neoplasias | ||
| LGIN: Low-grade intraepithelial neoplasias | ||
| Liver | 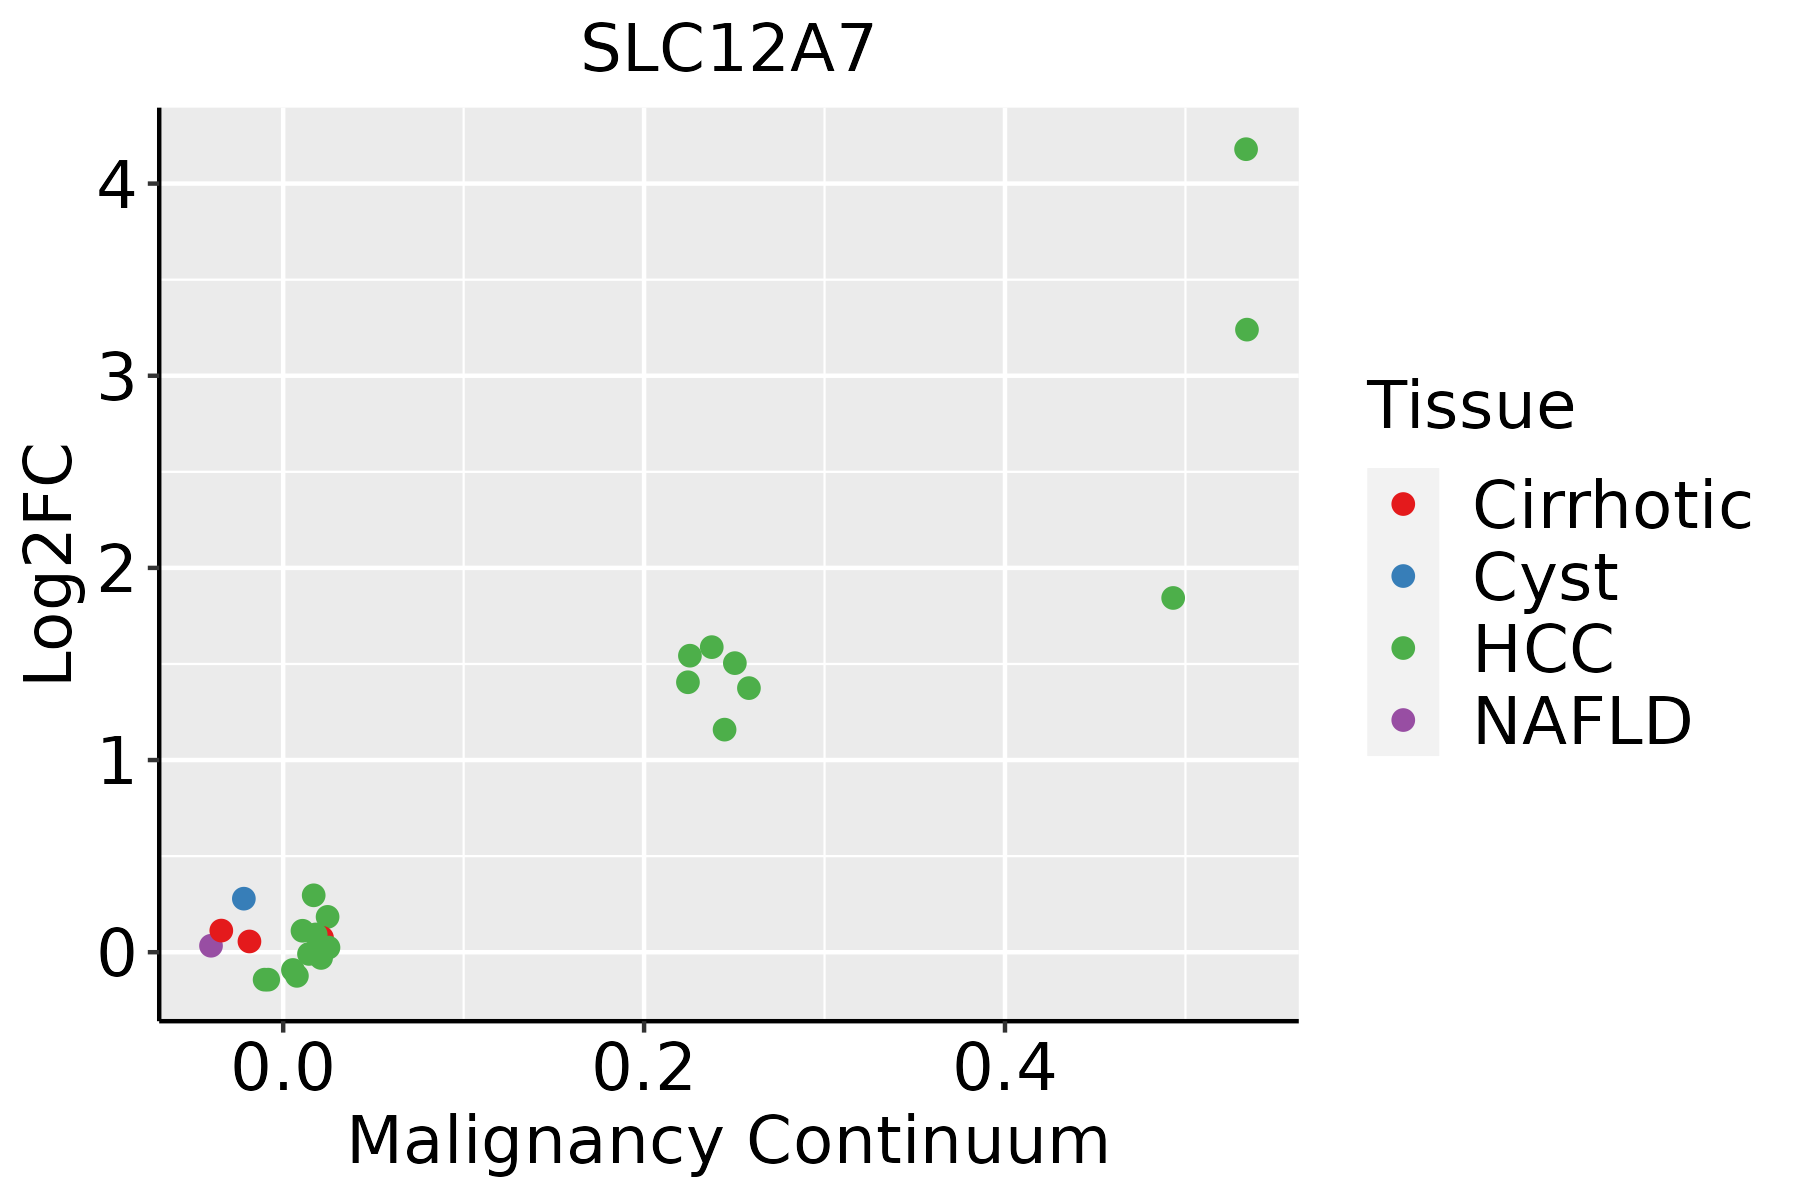 | HCC: Hepatocellular carcinoma |
| NAFLD: Non-alcoholic fatty liver disease | ||
| Lung |  | AAH: Atypical adenomatous hyperplasia |
| AIS: Adenocarcinoma in situ | ||
| IAC: Invasive lung adenocarcinoma | ||
| MIA: Minimally invasive adenocarcinoma | ||
| Oral Cavity | 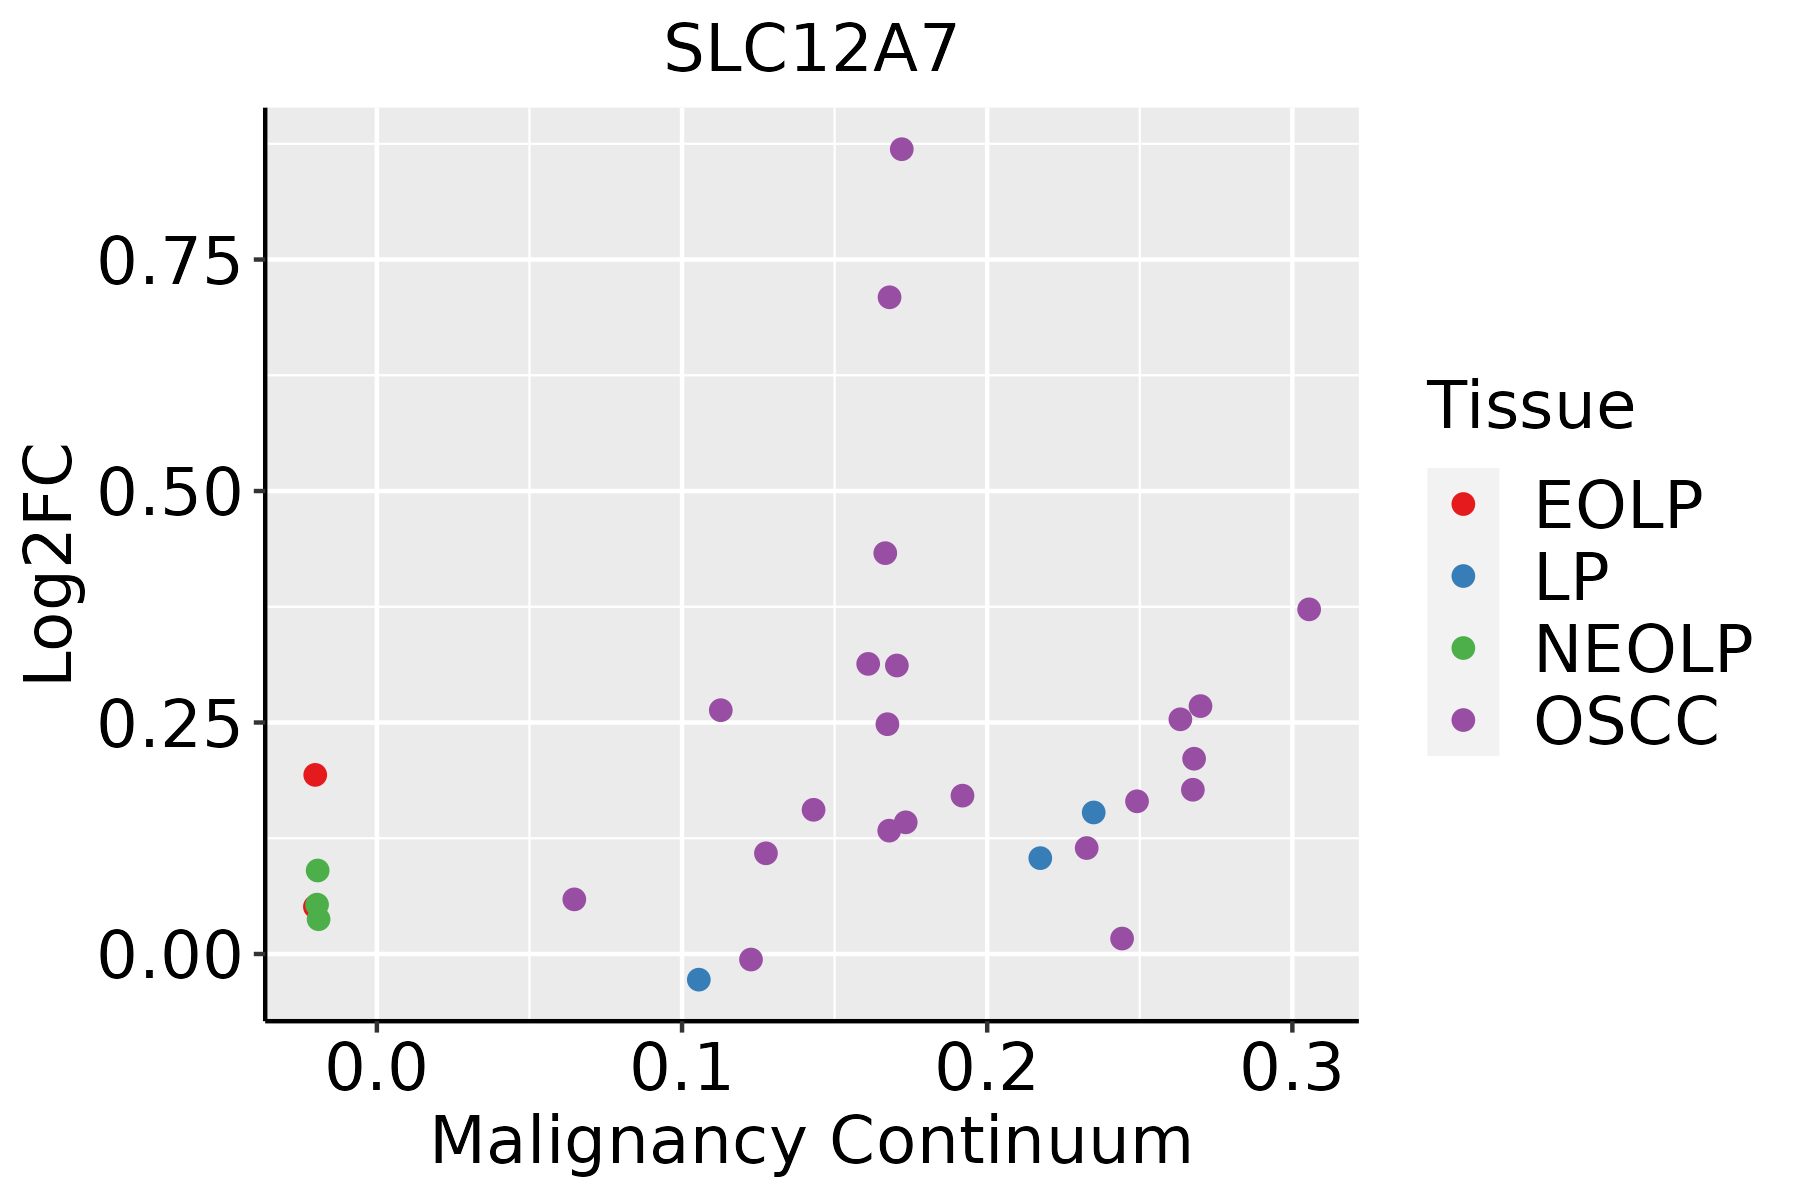 | EOLP: Erosive Oral lichen planus |
| LP: leukoplakia | ||
| NEOLP: Non-erosive oral lichen planus | ||
| OSCC: Oral squamous cell carcinoma |
| ∗log2FC in expression of this searched gene in stem-like cells from each diseased tissue sample relative to stem-like cells in normal samples in each tissue plotted against the malignancy continuum. Samples are colored based on if they are from different disease stage. |
Top |
Malignant transformation related pathway analysis |
| Find out the enriched GO biological processes and KEGG pathways involved in transition from healthy to precancer to cancer |
| Tissue | Disease Stage | Enriched GO biological Processes |
| Colorectum | AD |  |
| Colorectum | SER |  |
| Colorectum | MSS |  |
| Colorectum | MSI-H |  |
| Colorectum | FAP |  |
| ∗Top 15 enriched GO BP terms are showed in the bar plot of each disease state in each tissue. Each row represents a significant GO biological process which is colored according to the -log10(p.adjust). |
| Page: 1 2 3 4 5 6 7 8 9 |
| GO ID | Tissue | Disease Stage | Description | Gene Ratio | Bg Ratio | pvalue | p.adjust | Count |
| GO:0032535 | Colorectum | AD | regulation of cellular component size | 142/3918 | 383/18723 | 1.74e-13 | 3.41e-11 | 142 |
| GO:0008361 | Colorectum | AD | regulation of cell size | 56/3918 | 181/18723 | 9.61e-04 | 9.07e-03 | 56 |
| GO:0055067 | Colorectum | AD | monovalent inorganic cation homeostasis | 45/3918 | 151/18723 | 6.19e-03 | 3.88e-02 | 45 |
| GO:0015698 | Colorectum | AD | inorganic anion transport | 52/3918 | 180/18723 | 6.83e-03 | 4.22e-02 | 52 |
| GO:00325351 | Colorectum | SER | regulation of cellular component size | 115/2897 | 383/18723 | 3.04e-13 | 1.10e-10 | 115 |
| GO:00550671 | Colorectum | SER | monovalent inorganic cation homeostasis | 37/2897 | 151/18723 | 2.48e-03 | 2.33e-02 | 37 |
| GO:00325352 | Colorectum | MSS | regulation of cellular component size | 127/3467 | 383/18723 | 3.44e-12 | 5.79e-10 | 127 |
| GO:00083611 | Colorectum | MSS | regulation of cell size | 50/3467 | 181/18723 | 1.65e-03 | 1.49e-02 | 50 |
| GO:003253520 | Esophagus | ESCC | regulation of cellular component size | 227/8552 | 383/18723 | 4.77e-08 | 8.60e-07 | 227 |
| GO:00083619 | Esophagus | ESCC | regulation of cell size | 107/8552 | 181/18723 | 1.81e-04 | 1.16e-03 | 107 |
| GO:003253522 | Liver | HCC | regulation of cellular component size | 217/7958 | 383/18723 | 1.28e-08 | 3.14e-07 | 217 |
| GO:00083614 | Liver | HCC | regulation of cell size | 95/7958 | 181/18723 | 4.15e-03 | 1.81e-02 | 95 |
| GO:00325357 | Lung | IAC | regulation of cellular component size | 65/2061 | 383/18723 | 2.56e-04 | 4.26e-03 | 65 |
| GO:00083615 | Lung | IAC | regulation of cell size | 33/2061 | 181/18723 | 2.47e-03 | 2.33e-02 | 33 |
| GO:003253519 | Oral cavity | OSCC | regulation of cellular component size | 201/7305 | 383/18723 | 4.80e-08 | 8.88e-07 | 201 |
| GO:00083618 | Oral cavity | OSCC | regulation of cell size | 92/7305 | 181/18723 | 7.86e-04 | 4.26e-03 | 92 |
| GO:003253523 | Oral cavity | EOLP | regulation of cellular component size | 83/2218 | 383/18723 | 2.73e-08 | 1.12e-06 | 83 |
| GO:000836113 | Oral cavity | EOLP | regulation of cell size | 35/2218 | 181/18723 | 2.30e-03 | 1.42e-02 | 35 |
| Page: 1 |
| Pathway ID | Tissue | Disease Stage | Description | Gene Ratio | Bg Ratio | pvalue | p.adjust | qvalue | Count |
| Page: 1 |
Top |
Cell-cell communication analysis |
| Identification of potential cell-cell interactions between two cell types and their ligand-receptor pairs for different disease states |
| Ligand | Receptor | LRpair | Pathway | Tissue | Disease Stage |
| Page: 1 |
Top |
Single-cell gene regulatory network inference analysis |
| Find out the significant the regulons (TFs) and the target genes of each regulon across cell types for different disease states |
| TF | Cell Type | Tissue | Disease Stage | Target Gene | RSS | Regulon Activity |
| ∗The dot plots of a searched regulon are shown for all cell subpopulations in each disease state of each tissue based on the regulon specific score inferred using pySCENIC and by calculating the average expression. |
| Page: 1 |
Top |
Somatic mutation of malignant transformation related genes |
| Annotation of somatic variants for genes involved in malignant transformation |
| Hugo Symbol | Variant Class | Variant Classification | dbSNP RS | HGVSc | HGVSp | HGVSp Short | SWISSPROT | BIOTYPE | SIFT | PolyPhen | Tumor Sample Barcode | Tissue | Histology | Sex | Age | Stage | Therapy Types | Drugs | Outcome |
| SLC12A7 | SNV | Missense_Mutation | rs367928357 | c.1642N>A | p.Gly548Arg | p.G548R | Q9Y666 | protein_coding | deleterious(0.02) | possibly_damaging(0.797) | TCGA-A2-A3XY-01 | Breast | breast invasive carcinoma | Female | <65 | I/II | Chemotherapy | adriamycin | PD |
| SLC12A7 | SNV | Missense_Mutation | novel | c.1888N>G | p.Met630Val | p.M630V | Q9Y666 | protein_coding | deleterious(0.01) | probably_damaging(0.924) | TCGA-A2-A4S0-01 | Breast | breast invasive carcinoma | Female | >=65 | I/II | Unknown | Unknown | SD |
| SLC12A7 | SNV | Missense_Mutation | novel | c.1073A>G | p.Gln358Arg | p.Q358R | Q9Y666 | protein_coding | tolerated(0.57) | benign(0.001) | TCGA-A7-A6VV-01 | Breast | breast invasive carcinoma | Female | <65 | I/II | Chemotherapy | cyclophosphamide | CR |
| SLC12A7 | SNV | Missense_Mutation | rs559843361 | c.2353G>A | p.Gly785Ser | p.G785S | Q9Y666 | protein_coding | deleterious(0) | possibly_damaging(0.518) | TCGA-AN-A0AK-01 | Breast | breast invasive carcinoma | Female | >=65 | I/II | Unknown | Unknown | SD |
| SLC12A7 | SNV | Missense_Mutation | rs141825245 | c.1145C>T | p.Thr382Met | p.T382M | Q9Y666 | protein_coding | tolerated(0.15) | benign(0.003) | TCGA-AR-A0TT-01 | Breast | breast invasive carcinoma | Female | <65 | III/IV | Chemotherapy | doxorubicin | SD |
| SLC12A7 | SNV | Missense_Mutation | c.1856C>G | p.Ser619Cys | p.S619C | Q9Y666 | protein_coding | deleterious(0) | probably_damaging(0.982) | TCGA-D8-A13Y-01 | Breast | breast invasive carcinoma | Female | <65 | I/II | Chemotherapy | doxorubicin | SD | |
| SLC12A7 | SNV | Missense_Mutation | rs765374153 | c.2719N>A | p.Glu907Lys | p.E907K | Q9Y666 | protein_coding | tolerated(0.05) | benign(0.038) | TCGA-E2-A10C-01 | Breast | breast invasive carcinoma | Female | <65 | I/II | Chemotherapy | cytoxan | SD |
| SLC12A7 | SNV | Missense_Mutation | rs200716950 | c.1997G>A | p.Arg666His | p.R666H | Q9Y666 | protein_coding | deleterious(0) | probably_damaging(0.987) | TCGA-2W-A8YY-01 | Cervix | cervical & endocervical cancer | Female | <65 | I/II | Chemotherapy | cisplatin | CR |
| SLC12A7 | SNV | Missense_Mutation | novel | c.1708C>T | p.Leu570Phe | p.L570F | Q9Y666 | protein_coding | deleterious(0) | possibly_damaging(0.859) | TCGA-2W-A8YY-01 | Cervix | cervical & endocervical cancer | Female | <65 | I/II | Chemotherapy | cisplatin | CR |
| SLC12A7 | SNV | Missense_Mutation | rs139987489 | c.604G>A | p.Gly202Ser | p.G202S | Q9Y666 | protein_coding | deleterious(0) | probably_damaging(0.997) | TCGA-2W-A8YY-01 | Cervix | cervical & endocervical cancer | Female | <65 | I/II | Chemotherapy | cisplatin | CR |
| Page: 1 2 3 4 5 6 7 8 9 10 11 12 13 14 |
Top |
Related drugs of malignant transformation related genes |
| Identification of chemicals and drugs interact with genes involved in malignant transfromation |
| (DGIdb 4.0) |
| Entrez ID | Symbol | Category | Interaction Types | Drug Claim Name | Drug Name | PMIDs |
| 10723 | SLC12A7 | DRUGGABLE GENOME, TRANSPORTER, EXTERNAL SIDE OF PLASMA MEMBRANE | inhibitor | 178101310 |
| Page: 1 |

Copyright 2023-Present -The University of Texas Health Science Center at Houston |