
|
|||||
|
 | |
| |
| |
| |
| |
| |
|
Gene: SLC12A6 |
Gene summary for SLC12A6 |
| Gene information | Species | Human | Gene symbol | SLC12A6 | Gene ID | 9990 |
| Gene name | solute carrier family 12 member 6 | |
| Gene Alias | ACCPN | |
| Cytomap | 15q14 | |
| Gene Type | protein-coding | GO ID | GO:0001525 | UniProtAcc | A0A024R9K8 |
Top |
Malignant transformation analysis |
| Identification of the aberrant gene expression in precancerous and cancerous lesions by comparing the gene expression of stem-like cells in diseased tissues with normal stem cells |
| Entrez ID | Symbol | Replicates | Species | Organ | Tissue | Adj P-value | Log2FC | Malignancy |
| 9990 | SLC12A6 | LZE4T | Human | Esophagus | ESCC | 1.00e-07 | 2.54e-01 | 0.0811 |
| 9990 | SLC12A6 | LZE20T | Human | Esophagus | ESCC | 1.08e-02 | 1.55e-01 | 0.0662 |
| 9990 | SLC12A6 | LZE22T | Human | Esophagus | ESCC | 9.48e-03 | 1.59e-01 | 0.068 |
| 9990 | SLC12A6 | LZE24T | Human | Esophagus | ESCC | 3.69e-05 | 1.42e-01 | 0.0596 |
| 9990 | SLC12A6 | LZE21T | Human | Esophagus | ESCC | 2.15e-07 | 5.03e-01 | 0.0655 |
| 9990 | SLC12A6 | P1T-E | Human | Esophagus | ESCC | 4.19e-07 | 4.16e-01 | 0.0875 |
| 9990 | SLC12A6 | P4T-E | Human | Esophagus | ESCC | 9.62e-11 | 1.33e-01 | 0.1323 |
| 9990 | SLC12A6 | P5T-E | Human | Esophagus | ESCC | 2.33e-02 | 9.88e-03 | 0.1327 |
| 9990 | SLC12A6 | P8T-E | Human | Esophagus | ESCC | 1.19e-10 | 1.37e-01 | 0.0889 |
| 9990 | SLC12A6 | P9T-E | Human | Esophagus | ESCC | 9.04e-10 | 2.45e-01 | 0.1131 |
| 9990 | SLC12A6 | P10T-E | Human | Esophagus | ESCC | 5.70e-12 | 1.19e-01 | 0.116 |
| 9990 | SLC12A6 | P12T-E | Human | Esophagus | ESCC | 8.33e-20 | 2.22e-01 | 0.1122 |
| 9990 | SLC12A6 | P15T-E | Human | Esophagus | ESCC | 3.14e-08 | 2.52e-01 | 0.1149 |
| 9990 | SLC12A6 | P20T-E | Human | Esophagus | ESCC | 2.91e-07 | 1.63e-01 | 0.1124 |
| 9990 | SLC12A6 | P22T-E | Human | Esophagus | ESCC | 1.39e-10 | 7.70e-02 | 0.1236 |
| 9990 | SLC12A6 | P23T-E | Human | Esophagus | ESCC | 2.88e-12 | 3.31e-01 | 0.108 |
| 9990 | SLC12A6 | P26T-E | Human | Esophagus | ESCC | 8.19e-07 | 1.82e-01 | 0.1276 |
| 9990 | SLC12A6 | P27T-E | Human | Esophagus | ESCC | 1.52e-10 | 1.47e-01 | 0.1055 |
| 9990 | SLC12A6 | P28T-E | Human | Esophagus | ESCC | 1.19e-14 | 3.14e-01 | 0.1149 |
| 9990 | SLC12A6 | P30T-E | Human | Esophagus | ESCC | 3.19e-17 | 5.47e-01 | 0.137 |
| Page: 1 2 3 4 |
| Tissue | Expression Dynamics | Abbreviation |
| Esophagus | 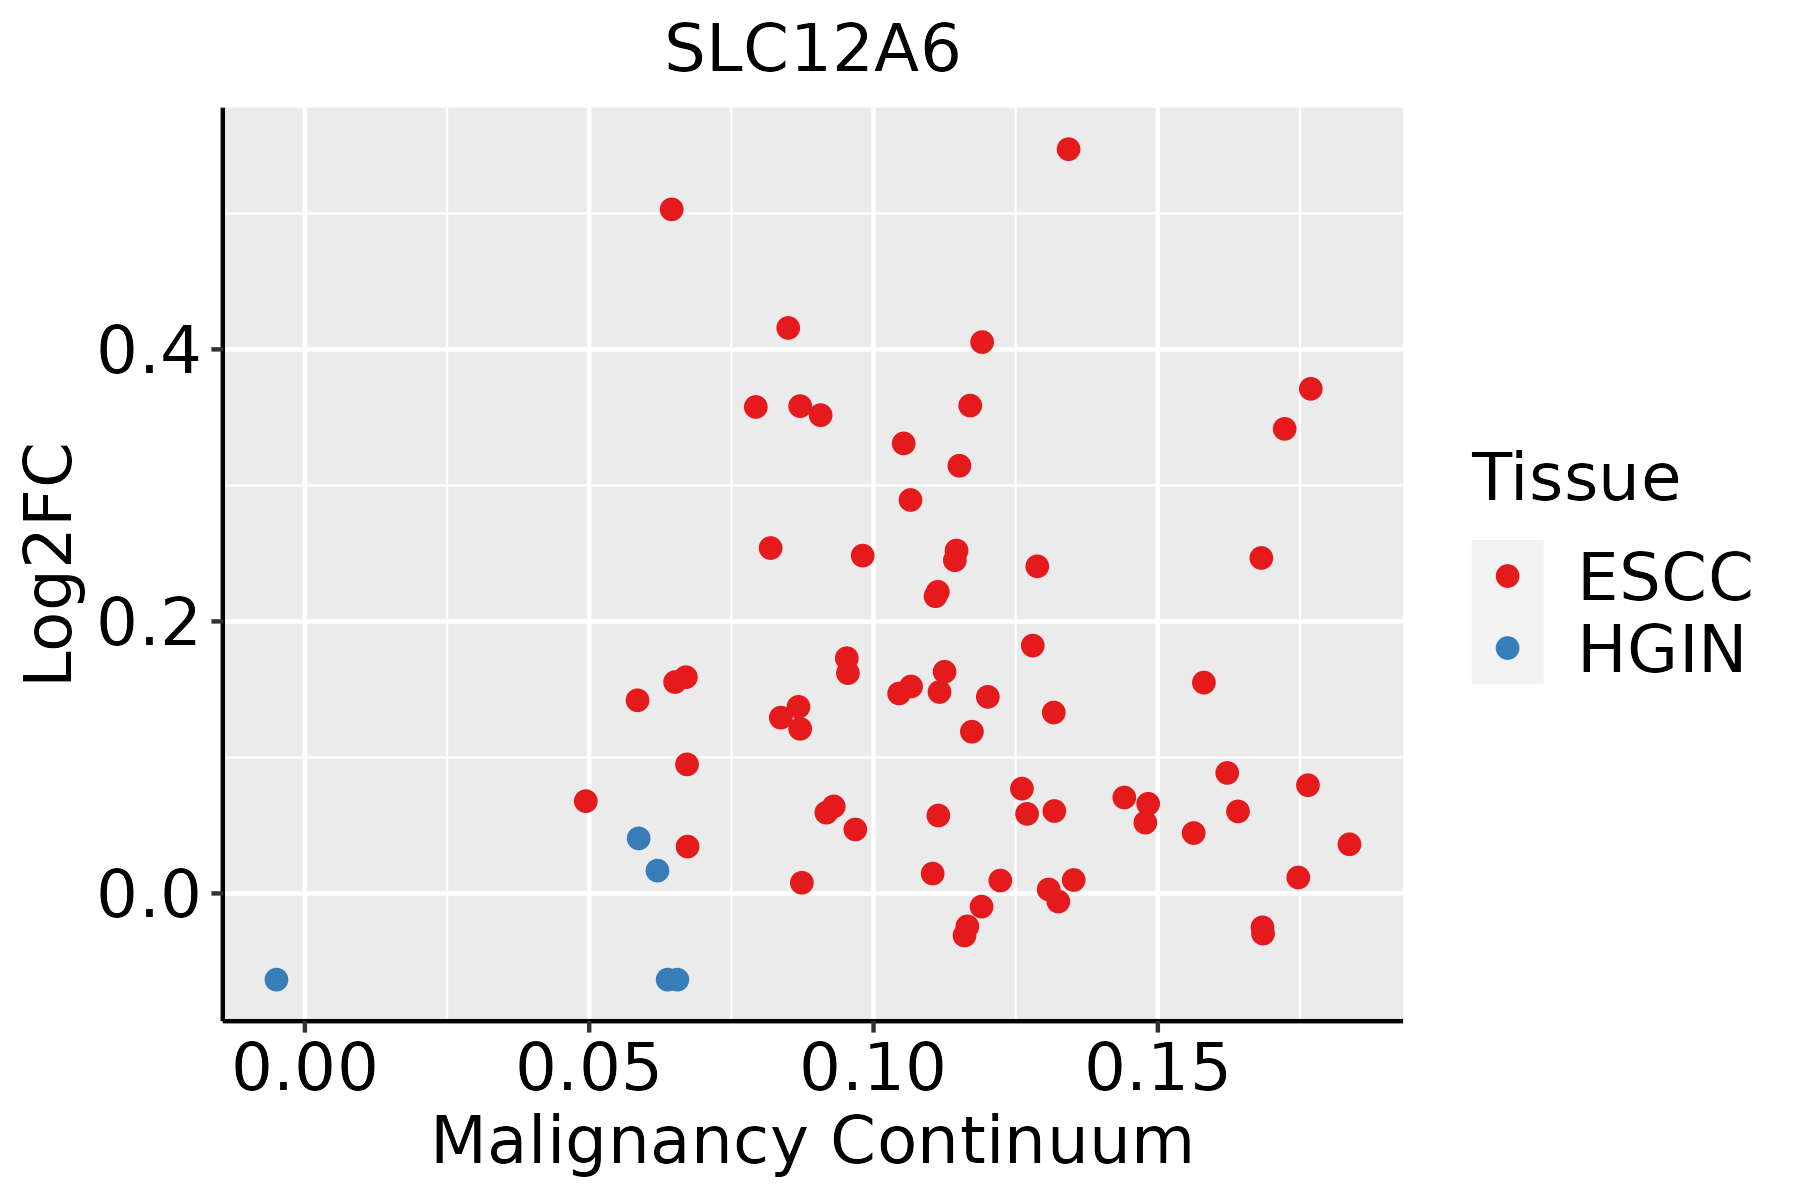 | ESCC: Esophageal squamous cell carcinoma |
| HGIN: High-grade intraepithelial neoplasias | ||
| LGIN: Low-grade intraepithelial neoplasias | ||
| Liver | 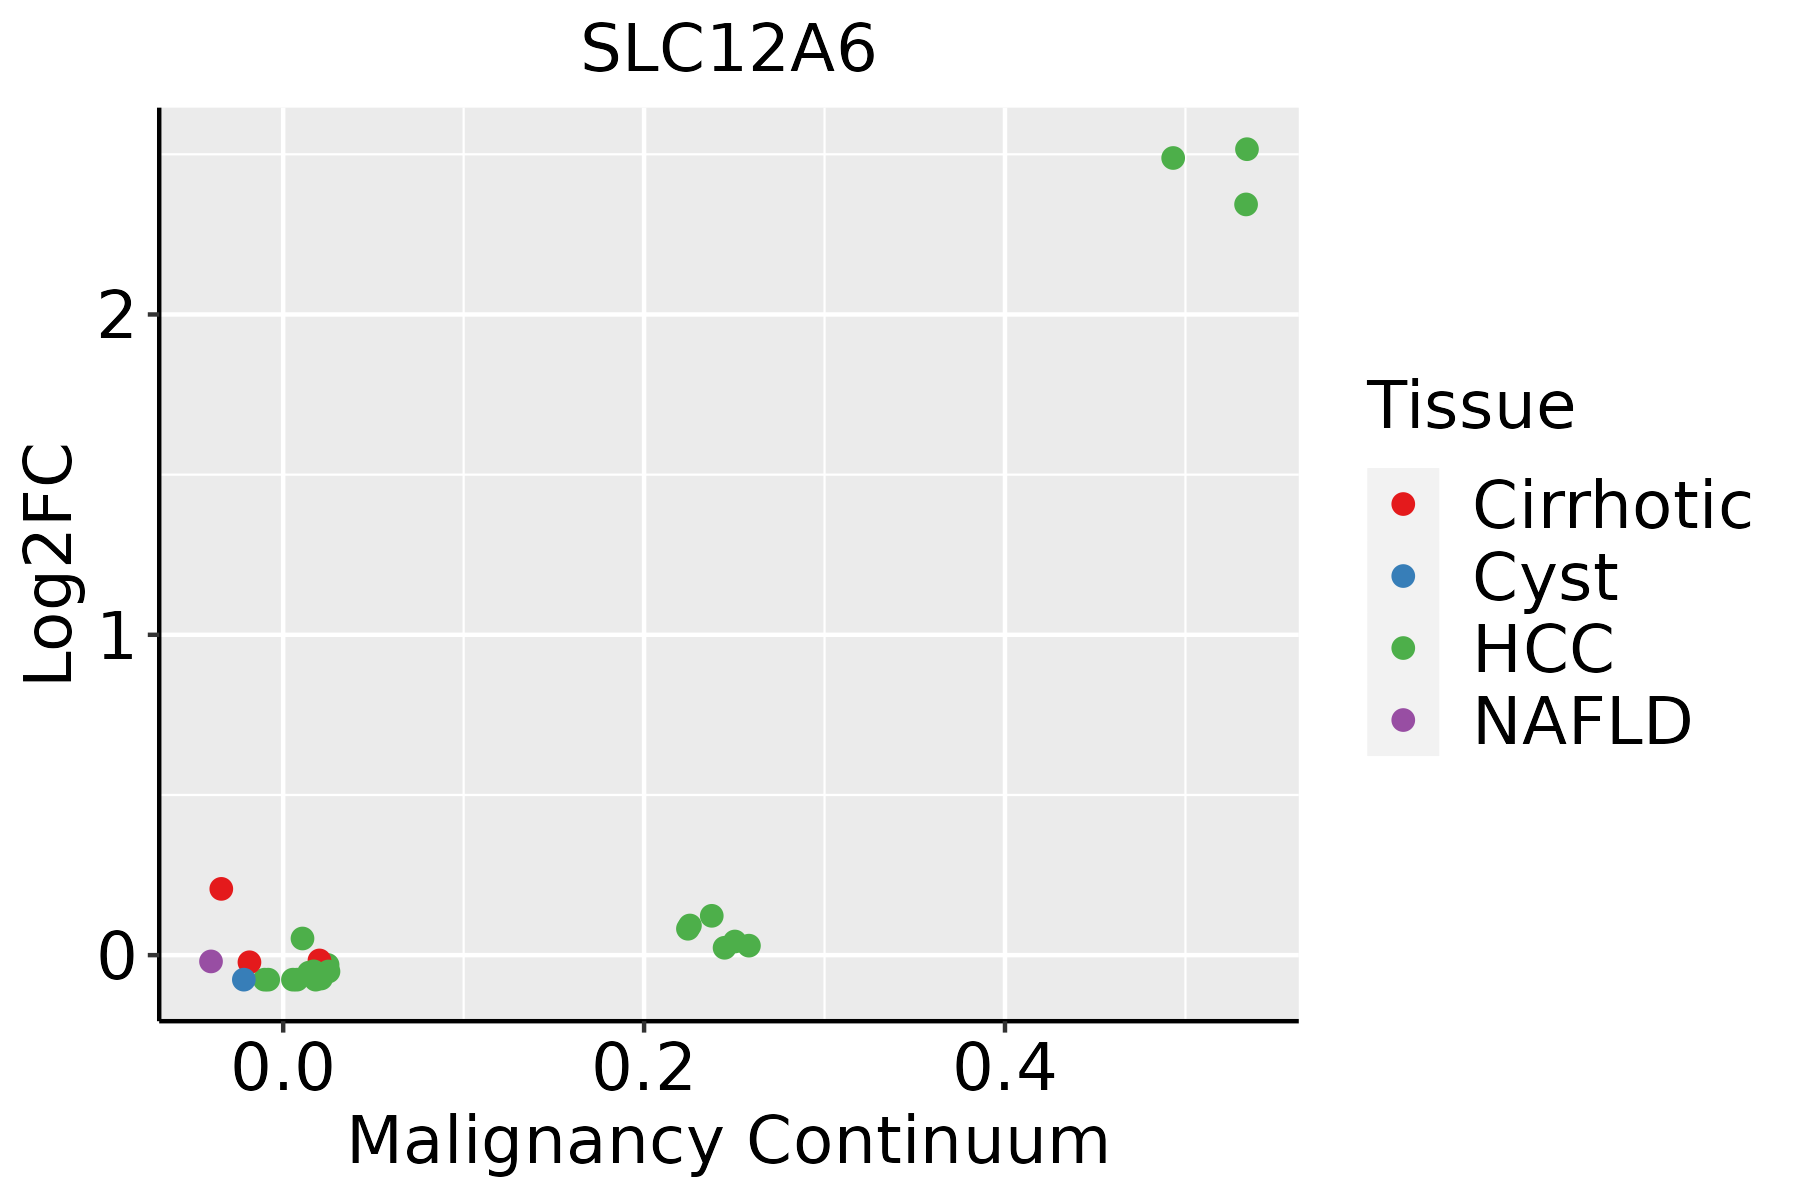 | HCC: Hepatocellular carcinoma |
| NAFLD: Non-alcoholic fatty liver disease | ||
| Oral Cavity | 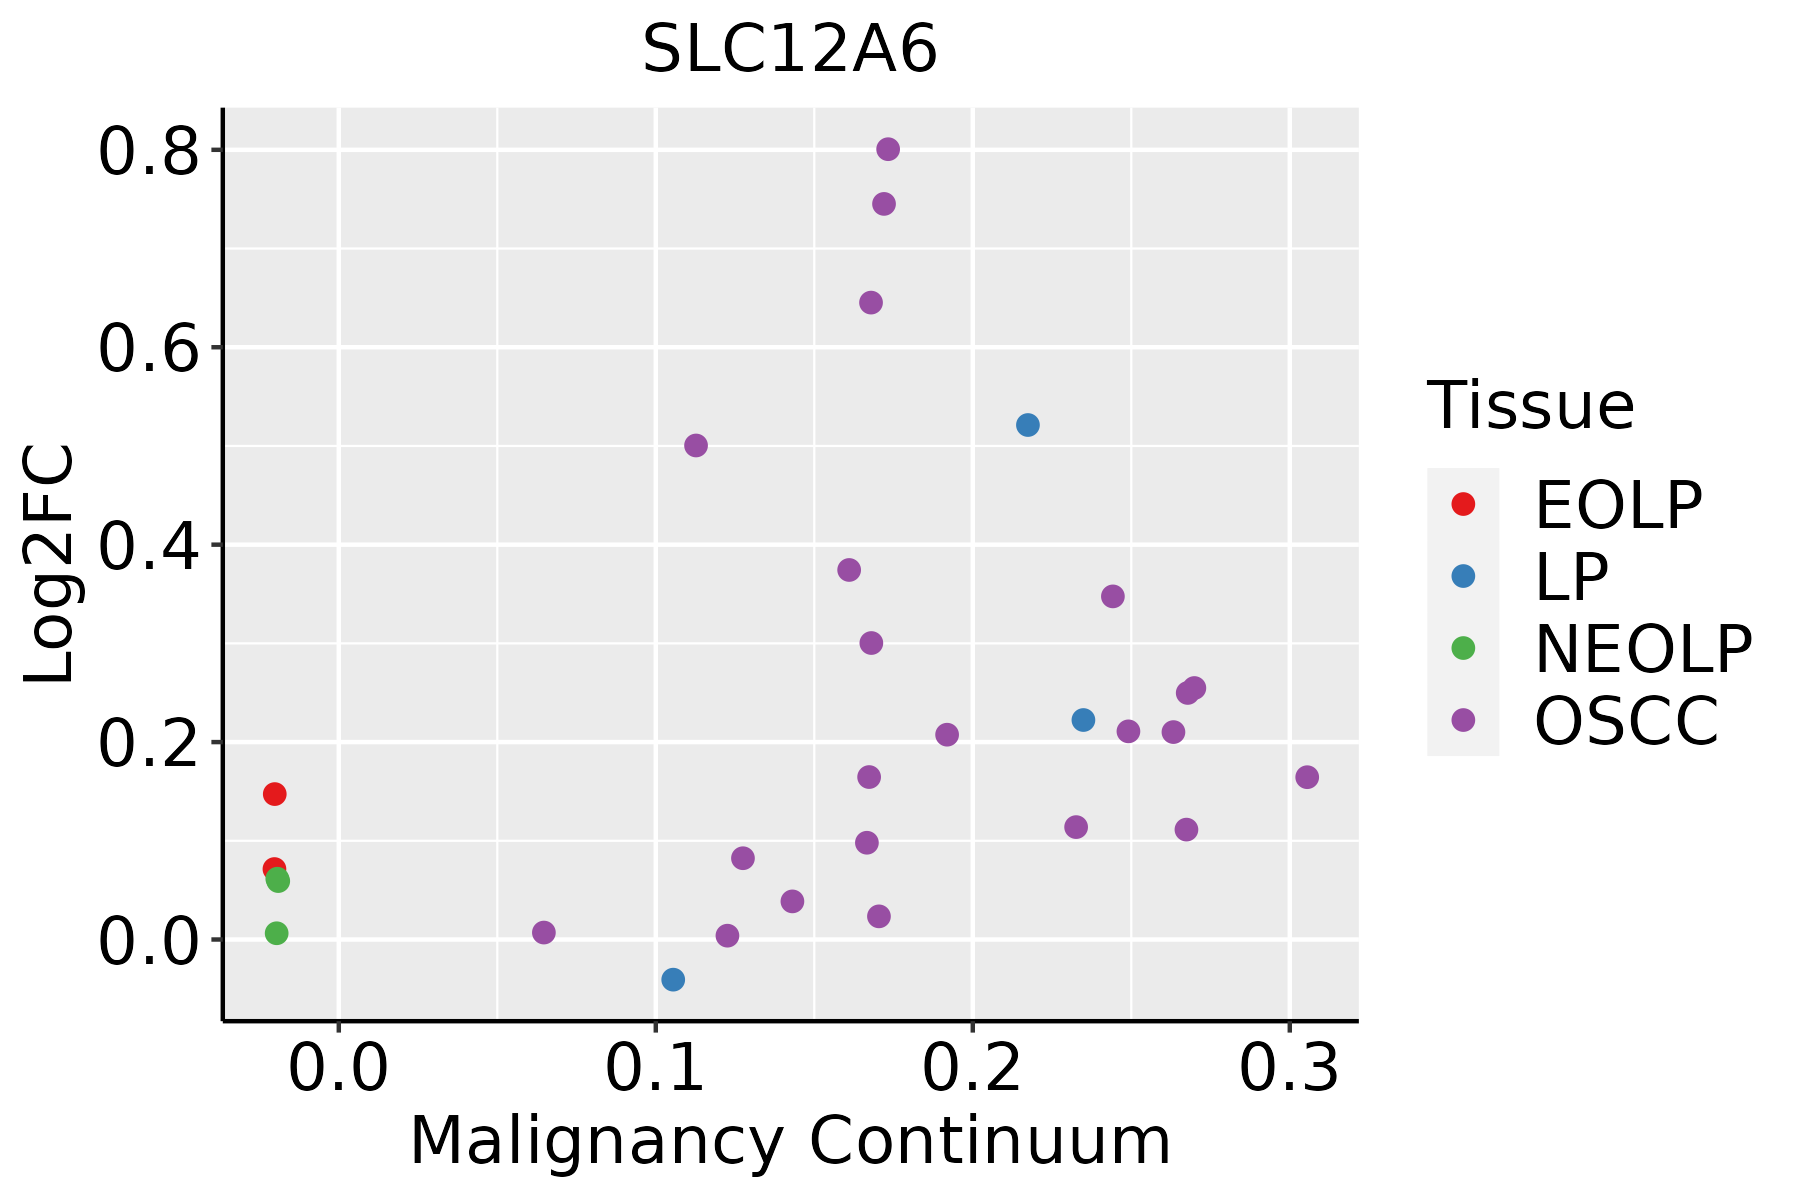 | EOLP: Erosive Oral lichen planus |
| LP: leukoplakia | ||
| NEOLP: Non-erosive oral lichen planus | ||
| OSCC: Oral squamous cell carcinoma | ||
| Thyroid |  | ATC: Anaplastic thyroid cancer |
| HT: Hashimoto's thyroiditis | ||
| PTC: Papillary thyroid cancer |
| ∗log2FC in expression of this searched gene in stem-like cells from each diseased tissue sample relative to stem-like cells in normal samples in each tissue plotted against the malignancy continuum. Samples are colored based on if they are from different disease stage. |
Top |
Malignant transformation related pathway analysis |
| Find out the enriched GO biological processes and KEGG pathways involved in transition from healthy to precancer to cancer |
| Tissue | Disease Stage | Enriched GO biological Processes |
| Colorectum | AD |  |
| Colorectum | SER |  |
| Colorectum | MSS |  |
| Colorectum | MSI-H |  |
| Colorectum | FAP |  |
| ∗Top 15 enriched GO BP terms are showed in the bar plot of each disease state in each tissue. Each row represents a significant GO biological process which is colored according to the -log10(p.adjust). |
| Page: 1 2 3 4 5 6 7 8 9 |
| GO ID | Tissue | Disease Stage | Description | Gene Ratio | Bg Ratio | pvalue | p.adjust | Count |
| GO:0062197111 | Esophagus | ESCC | cellular response to chemical stress | 234/8552 | 337/18723 | 5.37e-19 | 5.97e-17 | 234 |
| GO:007121419 | Esophagus | ESCC | cellular response to abiotic stimulus | 206/8552 | 331/18723 | 7.52e-10 | 1.88e-08 | 206 |
| GO:010400419 | Esophagus | ESCC | cellular response to environmental stimulus | 206/8552 | 331/18723 | 7.52e-10 | 1.88e-08 | 206 |
| GO:003253520 | Esophagus | ESCC | regulation of cellular component size | 227/8552 | 383/18723 | 4.77e-08 | 8.60e-07 | 227 |
| GO:00069707 | Esophagus | ESCC | response to osmotic stress | 57/8552 | 84/18723 | 3.26e-05 | 2.70e-04 | 57 |
| GO:00714707 | Esophagus | ESCC | cellular response to osmotic stress | 31/8552 | 41/18723 | 9.32e-05 | 6.68e-04 | 31 |
| GO:00083619 | Esophagus | ESCC | regulation of cell size | 107/8552 | 181/18723 | 1.81e-04 | 1.16e-03 | 107 |
| GO:0006971 | Esophagus | ESCC | hypotonic response | 10/8552 | 11/18723 | 2.54e-03 | 1.08e-02 | 10 |
| GO:00714724 | Esophagus | ESCC | cellular response to salt stress | 10/8552 | 12/18723 | 8.94e-03 | 3.12e-02 | 10 |
| GO:006219722 | Liver | HCC | cellular response to chemical stress | 216/7958 | 337/18723 | 6.86e-16 | 5.44e-14 | 216 |
| GO:003253522 | Liver | HCC | regulation of cellular component size | 217/7958 | 383/18723 | 1.28e-08 | 3.14e-07 | 217 |
| GO:007121421 | Liver | HCC | cellular response to abiotic stimulus | 183/7958 | 331/18723 | 1.59e-06 | 2.26e-05 | 183 |
| GO:010400421 | Liver | HCC | cellular response to environmental stimulus | 183/7958 | 331/18723 | 1.59e-06 | 2.26e-05 | 183 |
| GO:00069702 | Liver | HCC | response to osmotic stress | 52/7958 | 84/18723 | 2.58e-04 | 1.92e-03 | 52 |
| GO:00714701 | Liver | HCC | cellular response to osmotic stress | 28/7958 | 41/18723 | 7.54e-04 | 4.55e-03 | 28 |
| GO:00083614 | Liver | HCC | regulation of cell size | 95/7958 | 181/18723 | 4.15e-03 | 1.81e-02 | 95 |
| GO:006219720 | Oral cavity | OSCC | cellular response to chemical stress | 204/7305 | 337/18723 | 6.89e-16 | 5.19e-14 | 204 |
| GO:007121416 | Oral cavity | OSCC | cellular response to abiotic stimulus | 186/7305 | 331/18723 | 1.38e-10 | 4.10e-09 | 186 |
| GO:010400416 | Oral cavity | OSCC | cellular response to environmental stimulus | 186/7305 | 331/18723 | 1.38e-10 | 4.10e-09 | 186 |
| GO:003253519 | Oral cavity | OSCC | regulation of cellular component size | 201/7305 | 383/18723 | 4.80e-08 | 8.88e-07 | 201 |
| Page: 1 2 |
| Pathway ID | Tissue | Disease Stage | Description | Gene Ratio | Bg Ratio | pvalue | p.adjust | qvalue | Count |
| Page: 1 |
Top |
Cell-cell communication analysis |
| Identification of potential cell-cell interactions between two cell types and their ligand-receptor pairs for different disease states |
| Ligand | Receptor | LRpair | Pathway | Tissue | Disease Stage |
| Page: 1 |
Top |
Single-cell gene regulatory network inference analysis |
| Find out the significant the regulons (TFs) and the target genes of each regulon across cell types for different disease states |
| TF | Cell Type | Tissue | Disease Stage | Target Gene | RSS | Regulon Activity |
| ∗The dot plots of a searched regulon are shown for all cell subpopulations in each disease state of each tissue based on the regulon specific score inferred using pySCENIC and by calculating the average expression. |
| Page: 1 |
Top |
Somatic mutation of malignant transformation related genes |
| Annotation of somatic variants for genes involved in malignant transformation |
| Hugo Symbol | Variant Class | Variant Classification | dbSNP RS | HGVSc | HGVSp | HGVSp Short | SWISSPROT | BIOTYPE | SIFT | PolyPhen | Tumor Sample Barcode | Tissue | Histology | Sex | Age | Stage | Therapy Types | Drugs | Outcome |
| SLC12A6 | SNV | Missense_Mutation | c.1307C>A | p.Pro436His | p.P436H | Q9UHW9 | protein_coding | deleterious(0) | probably_damaging(0.996) | TCGA-A2-A25A-01 | Breast | breast invasive carcinoma | Female | <65 | I/II | Unspecific | Cytoxan | SD | |
| SLC12A6 | SNV | Missense_Mutation | c.2169N>C | p.Glu723Asp | p.E723D | Q9UHW9 | protein_coding | deleterious(0) | possibly_damaging(0.9) | TCGA-A8-A079-01 | Breast | breast invasive carcinoma | Female | >=65 | III/IV | Chemotherapy | 5-fluorouracil | SD | |
| SLC12A6 | SNV | Missense_Mutation | c.180N>A | p.Met60Ile | p.M60I | Q9UHW9 | protein_coding | tolerated_low_confidence(0.39) | benign(0) | TCGA-A8-A09D-01 | Breast | breast invasive carcinoma | Female | <65 | I/II | Chemotherapy | doxorubicin | CR | |
| SLC12A6 | SNV | Missense_Mutation | c.2983G>A | p.Glu995Lys | p.E995K | Q9UHW9 | protein_coding | deleterious(0) | probably_damaging(0.968) | TCGA-AC-A23H-01 | Breast | breast invasive carcinoma | Female | >=65 | I/II | Unknown | Unknown | PD | |
| SLC12A6 | SNV | Missense_Mutation | novel | c.2108C>T | p.Ala703Val | p.A703V | Q9UHW9 | protein_coding | deleterious(0.01) | probably_damaging(0.976) | TCGA-AN-A046-01 | Breast | breast invasive carcinoma | Female | >=65 | I/II | Unknown | Unknown | SD |
| SLC12A6 | SNV | Missense_Mutation | c.409N>A | p.Glu137Lys | p.E137K | Q9UHW9 | protein_coding | deleterious(0.01) | possibly_damaging(0.463) | TCGA-AR-A2LH-01 | Breast | breast invasive carcinoma | Female | <65 | III/IV | Chemotherapy | adriamycin | PD | |
| SLC12A6 | SNV | Missense_Mutation | c.2784C>G | p.Phe928Leu | p.F928L | Q9UHW9 | protein_coding | deleterious(0.01) | possibly_damaging(0.813) | TCGA-D8-A140-01 | Breast | breast invasive carcinoma | Female | <65 | I/II | Chemotherapy | doxorubicin+cyclophosphamid | SD | |
| SLC12A6 | SNV | Missense_Mutation | novel | c.323N>C | p.Gly108Ala | p.G108A | Q9UHW9 | protein_coding | deleterious(0.05) | benign(0.234) | TCGA-EW-A3U0-01 | Breast | breast invasive carcinoma | Female | <65 | III/IV | Chemotherapy | cisplatin | CR |
| SLC12A6 | SNV | Missense_Mutation | c.1307N>A | p.Pro436His | p.P436H | Q9UHW9 | protein_coding | deleterious(0) | probably_damaging(0.996) | TCGA-EW-A6SD-01 | Breast | breast invasive carcinoma | Female | <65 | I/II | Chemotherapy | tch | SD | |
| SLC12A6 | insertion | In_Frame_Ins | novel | c.3254_3255insAGTACC | p.His1085delinsGlnValPro | p.H1085delinsQVP | Q9UHW9 | protein_coding | TCGA-A8-A097-01 | Breast | breast invasive carcinoma | Female | >=65 | I/II | Hormone Therapy | tamoxiphen | SD |
| Page: 1 2 3 4 5 6 7 8 9 10 11 12 13 |
Top |
Related drugs of malignant transformation related genes |
| Identification of chemicals and drugs interact with genes involved in malignant transfromation |
| (DGIdb 4.0) |
| Entrez ID | Symbol | Category | Interaction Types | Drug Claim Name | Drug Name | PMIDs |
| 9990 | SLC12A6 | DRUGGABLE GENOME, EXTERNAL SIDE OF PLASMA MEMBRANE, TRANSPORTER | inhibitor | 178101310 |
| Page: 1 |

Copyright 2023-Present -The University of Texas Health Science Center at Houston |