
|
|||||
|
 | |
| |
| |
| |
| |
| |
|
Gene: SLC12A5 |
Gene summary for SLC12A5 |
| Gene information | Species | Human | Gene symbol | SLC12A5 | Gene ID | 57468 |
| Gene name | solute carrier family 12 member 5 | |
| Gene Alias | DEE34 | |
| Cytomap | 20q13.12 | |
| Gene Type | protein-coding | GO ID | GO:0003008 | UniProtAcc | Q9H2X9 |
Top |
Malignant transformation analysis |
| Identification of the aberrant gene expression in precancerous and cancerous lesions by comparing the gene expression of stem-like cells in diseased tissues with normal stem cells |
| Entrez ID | Symbol | Replicates | Species | Organ | Tissue | Adj P-value | Log2FC | Malignancy |
| 57468 | SLC12A5 | LZE6T | Human | Esophagus | ESCC | 2.96e-03 | 1.86e-01 | 0.0845 |
| 57468 | SLC12A5 | P10T-E | Human | Esophagus | ESCC | 1.88e-04 | 1.21e-01 | 0.116 |
| 57468 | SLC12A5 | P22T-E | Human | Esophagus | ESCC | 8.08e-19 | 3.49e-01 | 0.1236 |
| 57468 | SLC12A5 | P26T-E | Human | Esophagus | ESCC | 5.17e-27 | 5.62e-01 | 0.1276 |
| 57468 | SLC12A5 | P27T-E | Human | Esophagus | ESCC | 8.40e-04 | 1.13e-01 | 0.1055 |
| 57468 | SLC12A5 | P57T-E | Human | Esophagus | ESCC | 4.17e-05 | 2.02e-01 | 0.0926 |
| 57468 | SLC12A5 | P61T-E | Human | Esophagus | ESCC | 3.65e-02 | 9.02e-02 | 0.099 |
| 57468 | SLC12A5 | P65T-E | Human | Esophagus | ESCC | 1.50e-12 | 2.76e-01 | 0.0978 |
| 57468 | SLC12A5 | P74T-E | Human | Esophagus | ESCC | 4.76e-19 | 5.45e-01 | 0.1479 |
| 57468 | SLC12A5 | P75T-E | Human | Esophagus | ESCC | 4.19e-25 | 4.85e-01 | 0.1125 |
| 57468 | SLC12A5 | P76T-E | Human | Esophagus | ESCC | 9.74e-22 | 4.40e-01 | 0.1207 |
| 57468 | SLC12A5 | P79T-E | Human | Esophagus | ESCC | 9.02e-11 | 2.12e-01 | 0.1154 |
| 57468 | SLC12A5 | P89T-E | Human | Esophagus | ESCC | 3.85e-03 | 1.95e-01 | 0.1752 |
| 57468 | SLC12A5 | P128T-E | Human | Esophagus | ESCC | 1.37e-04 | 1.68e-01 | 0.1241 |
| Page: 1 |
| Tissue | Expression Dynamics | Abbreviation |
| Esophagus | 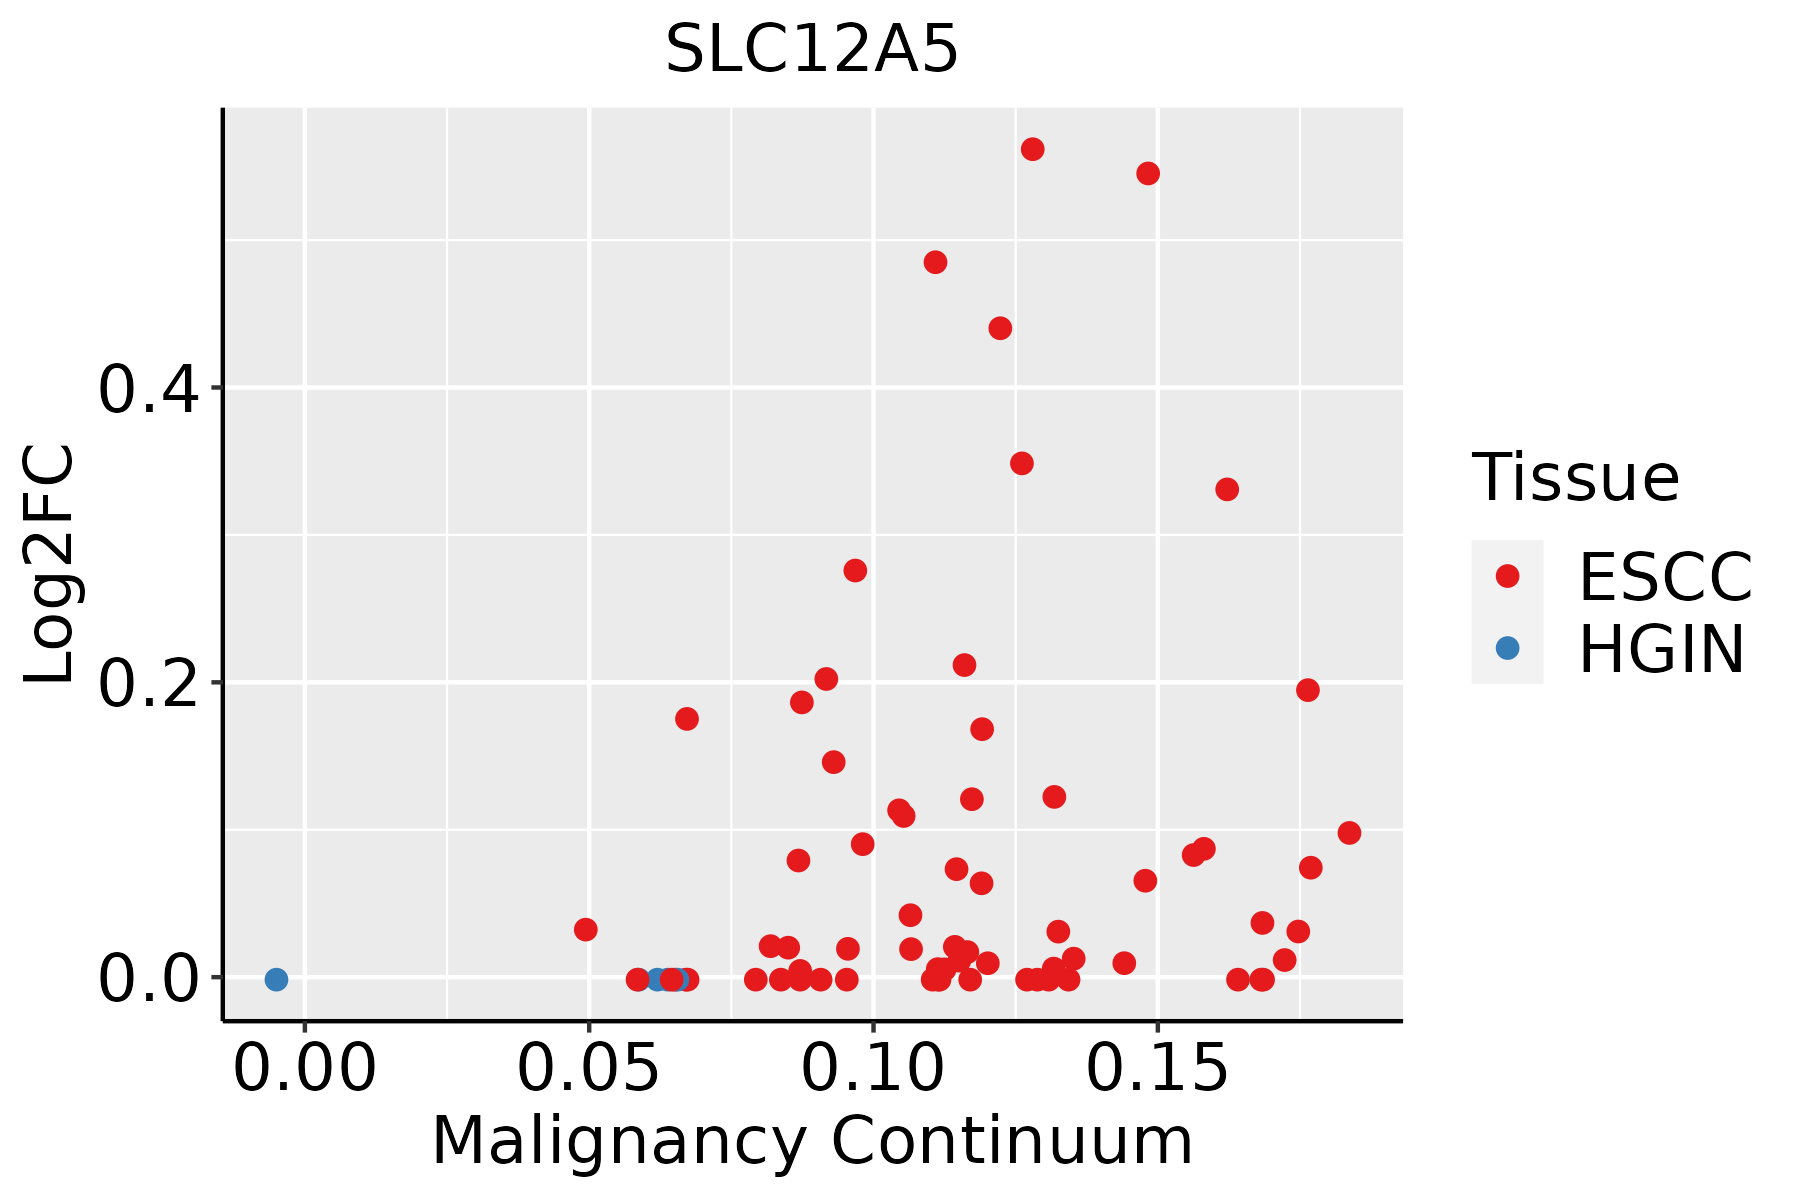 | ESCC: Esophageal squamous cell carcinoma |
| HGIN: High-grade intraepithelial neoplasias | ||
| LGIN: Low-grade intraepithelial neoplasias |
| ∗log2FC in expression of this searched gene in stem-like cells from each diseased tissue sample relative to stem-like cells in normal samples in each tissue plotted against the malignancy continuum. Samples are colored based on if they are from different disease stage. |
Top |
Malignant transformation related pathway analysis |
| Find out the enriched GO biological processes and KEGG pathways involved in transition from healthy to precancer to cancer |
| Tissue | Disease Stage | Enriched GO biological Processes |
| Colorectum | AD |  |
| Colorectum | SER |  |
| Colorectum | MSS |  |
| Colorectum | MSI-H |  |
| Colorectum | FAP |  |
| ∗Top 15 enriched GO BP terms are showed in the bar plot of each disease state in each tissue. Each row represents a significant GO biological process which is colored according to the -log10(p.adjust). |
| Page: 1 2 3 4 5 6 7 8 9 |
| GO ID | Tissue | Disease Stage | Description | Gene Ratio | Bg Ratio | pvalue | p.adjust | Count |
| GO:003253520 | Esophagus | ESCC | regulation of cellular component size | 227/8552 | 383/18723 | 4.77e-08 | 8.60e-07 | 227 |
| GO:00069707 | Esophagus | ESCC | response to osmotic stress | 57/8552 | 84/18723 | 3.26e-05 | 2.70e-04 | 57 |
| GO:000941020 | Esophagus | ESCC | response to xenobiotic stimulus | 253/8552 | 462/18723 | 4.55e-05 | 3.58e-04 | 253 |
| GO:000926619 | Esophagus | ESCC | response to temperature stimulus | 106/8552 | 178/18723 | 1.30e-04 | 8.84e-04 | 106 |
| GO:00083619 | Esophagus | ESCC | regulation of cell size | 107/8552 | 181/18723 | 1.81e-04 | 1.16e-03 | 107 |
| GO:00352647 | Esophagus | ESCC | multicellular organism growth | 80/8552 | 132/18723 | 3.84e-04 | 2.22e-03 | 80 |
| GO:0006971 | Esophagus | ESCC | hypotonic response | 10/8552 | 11/18723 | 2.54e-03 | 1.08e-02 | 10 |
| GO:001635816 | Esophagus | ESCC | dendrite development | 130/8552 | 243/18723 | 8.33e-03 | 2.95e-02 | 130 |
| Page: 1 |
| Pathway ID | Tissue | Disease Stage | Description | Gene Ratio | Bg Ratio | pvalue | p.adjust | qvalue | Count |
| Page: 1 |
Top |
Cell-cell communication analysis |
| Identification of potential cell-cell interactions between two cell types and their ligand-receptor pairs for different disease states |
| Ligand | Receptor | LRpair | Pathway | Tissue | Disease Stage |
| Page: 1 |
Top |
Single-cell gene regulatory network inference analysis |
| Find out the significant the regulons (TFs) and the target genes of each regulon across cell types for different disease states |
| TF | Cell Type | Tissue | Disease Stage | Target Gene | RSS | Regulon Activity |
| ∗The dot plots of a searched regulon are shown for all cell subpopulations in each disease state of each tissue based on the regulon specific score inferred using pySCENIC and by calculating the average expression. |
| Page: 1 |
Top |
Somatic mutation of malignant transformation related genes |
| Annotation of somatic variants for genes involved in malignant transformation |
| Hugo Symbol | Variant Class | Variant Classification | dbSNP RS | HGVSc | HGVSp | HGVSp Short | SWISSPROT | BIOTYPE | SIFT | PolyPhen | Tumor Sample Barcode | Tissue | Histology | Sex | Age | Stage | Therapy Types | Drugs | Outcome |
| SLC12A5 | SNV | Missense_Mutation | novel | c.2983N>A | p.Gln995Lys | p.Q995K | Q9H2X9 | protein_coding | tolerated(0.14) | benign(0.071) | TCGA-A8-A085-01 | Breast | breast invasive carcinoma | Male | <65 | I/II | Hormone Therapy | tamoxiphen | SD |
| SLC12A5 | SNV | Missense_Mutation | c.2204N>T | p.Glu735Val | p.E735V | Q9H2X9 | protein_coding | tolerated(0.06) | benign(0.031) | TCGA-A8-A08R-01 | Breast | breast invasive carcinoma | Female | <65 | I/II | Unknown | Unknown | SD | |
| SLC12A5 | SNV | Missense_Mutation | c.907G>T | p.Asp303Tyr | p.D303Y | Q9H2X9 | protein_coding | deleterious(0.01) | possibly_damaging(0.814) | TCGA-AO-A0J6-01 | Breast | breast invasive carcinoma | Female | <65 | I/II | Chemotherapy | doxorubicin | SD | |
| SLC12A5 | SNV | Missense_Mutation | novel | c.2450N>A | p.Leu817Gln | p.L817Q | Q9H2X9 | protein_coding | deleterious(0) | benign(0.141) | TCGA-B6-A400-01 | Breast | breast invasive carcinoma | Female | <65 | III/IV | Unknown | Unknown | SD |
| SLC12A5 | SNV | Missense_Mutation | c.508G>A | p.Ala170Thr | p.A170T | Q9H2X9 | protein_coding | deleterious(0.05) | possibly_damaging(0.461) | TCGA-BH-A0B4-01 | Breast | breast invasive carcinoma | Male | >=65 | III/IV | Hormone Therapy | tamoxiphen | SD | |
| SLC12A5 | SNV | Missense_Mutation | c.198N>C | p.Lys66Asn | p.K66N | Q9H2X9 | protein_coding | deleterious(0.02) | benign(0.03) | TCGA-C8-A26Y-01 | Breast | breast invasive carcinoma | Female | >=65 | I/II | Unknown | Unknown | SD | |
| SLC12A5 | SNV | Missense_Mutation | c.2524N>C | p.Glu842Gln | p.E842Q | Q9H2X9 | protein_coding | tolerated(0.06) | benign(0.088) | TCGA-C8-A26Y-01 | Breast | breast invasive carcinoma | Female | >=65 | I/II | Unknown | Unknown | SD | |
| SLC12A5 | SNV | Missense_Mutation | c.2312N>T | p.Ser771Phe | p.S771F | Q9H2X9 | protein_coding | deleterious(0) | possibly_damaging(0.764) | TCGA-D8-A146-01 | Breast | breast invasive carcinoma | Female | <65 | I/II | Unknown | Unknown | SD | |
| SLC12A5 | SNV | Missense_Mutation | c.598G>T | p.Gly200Trp | p.G200W | Q9H2X9 | protein_coding | deleterious(0) | probably_damaging(1) | TCGA-E2-A10A-01 | Breast | breast invasive carcinoma | Female | <65 | I/II | Hormone Therapy | zoladex | SD | |
| SLC12A5 | SNV | Missense_Mutation | c.2938G>A | p.Glu980Lys | p.E980K | Q9H2X9 | protein_coding | tolerated(0.18) | benign(0.003) | TCGA-E2-A1IN-01 | Breast | breast invasive carcinoma | Female | <65 | I/II | Hormone Therapy | arimidex | SD |
| Page: 1 2 3 4 5 6 7 8 9 10 11 12 13 14 15 16 17 18 19 |
Top |
Related drugs of malignant transformation related genes |
| Identification of chemicals and drugs interact with genes involved in malignant transfromation |
| (DGIdb 4.0) |
| Entrez ID | Symbol | Category | Interaction Types | Drug Claim Name | Drug Name | PMIDs |
| 57468 | SLC12A5 | DRUGGABLE GENOME, TRANSPORTER | BUMETANIDE | BUMETANIDE | ||
| 57468 | SLC12A5 | DRUGGABLE GENOME, TRANSPORTER | inhibitor | 178101310 | ||
| 57468 | SLC12A5 | DRUGGABLE GENOME, TRANSPORTER | BUMETANIDE | BUMETANIDE | ||
| 57468 | SLC12A5 | DRUGGABLE GENOME, TRANSPORTER | inhibitor | 178101380 |
| Page: 1 |

Copyright 2023-Present -The University of Texas Health Science Center at Houston |