
|
|||||
|
 | |
| |
| |
| |
| |
| |
|
Gene: SLC12A4 |
Gene summary for SLC12A4 |
| Gene information | Species | Human | Gene symbol | SLC12A4 | Gene ID | 6560 |
| Gene name | solute carrier family 12 member 4 | |
| Gene Alias | CTC-479C5.17 | |
| Cytomap | 16q22.1 | |
| Gene Type | protein-coding | GO ID | GO:0006810 | UniProtAcc | B4DF30 |
Top |
Malignant transformation analysis |
| Identification of the aberrant gene expression in precancerous and cancerous lesions by comparing the gene expression of stem-like cells in diseased tissues with normal stem cells |
| Entrez ID | Symbol | Replicates | Species | Organ | Tissue | Adj P-value | Log2FC | Malignancy |
| 6560 | SLC12A4 | LZE4T | Human | Esophagus | ESCC | 6.46e-03 | 4.45e-02 | 0.0811 |
| 6560 | SLC12A4 | LZE24T | Human | Esophagus | ESCC | 8.17e-09 | 9.81e-02 | 0.0596 |
| 6560 | SLC12A4 | P1T-E | Human | Esophagus | ESCC | 1.08e-04 | 3.33e-01 | 0.0875 |
| 6560 | SLC12A4 | P2T-E | Human | Esophagus | ESCC | 2.02e-11 | 1.56e-01 | 0.1177 |
| 6560 | SLC12A4 | P4T-E | Human | Esophagus | ESCC | 7.12e-05 | 7.04e-02 | 0.1323 |
| 6560 | SLC12A4 | P5T-E | Human | Esophagus | ESCC | 2.40e-15 | 1.41e-01 | 0.1327 |
| 6560 | SLC12A4 | P8T-E | Human | Esophagus | ESCC | 5.74e-10 | 1.20e-01 | 0.0889 |
| 6560 | SLC12A4 | P9T-E | Human | Esophagus | ESCC | 2.33e-06 | 4.23e-02 | 0.1131 |
| 6560 | SLC12A4 | P10T-E | Human | Esophagus | ESCC | 4.33e-09 | 7.86e-02 | 0.116 |
| 6560 | SLC12A4 | P11T-E | Human | Esophagus | ESCC | 2.10e-13 | 4.12e-01 | 0.1426 |
| 6560 | SLC12A4 | P12T-E | Human | Esophagus | ESCC | 2.55e-09 | 7.31e-02 | 0.1122 |
| 6560 | SLC12A4 | P15T-E | Human | Esophagus | ESCC | 5.31e-11 | 1.15e-01 | 0.1149 |
| 6560 | SLC12A4 | P16T-E | Human | Esophagus | ESCC | 7.23e-05 | 6.36e-02 | 0.1153 |
| 6560 | SLC12A4 | P17T-E | Human | Esophagus | ESCC | 7.20e-07 | 2.19e-01 | 0.1278 |
| 6560 | SLC12A4 | P19T-E | Human | Esophagus | ESCC | 1.44e-04 | 5.83e-01 | 0.1662 |
| 6560 | SLC12A4 | P20T-E | Human | Esophagus | ESCC | 1.76e-03 | 9.36e-03 | 0.1124 |
| 6560 | SLC12A4 | P21T-E | Human | Esophagus | ESCC | 1.60e-14 | 2.84e-01 | 0.1617 |
| 6560 | SLC12A4 | P22T-E | Human | Esophagus | ESCC | 7.91e-05 | 5.79e-02 | 0.1236 |
| 6560 | SLC12A4 | P23T-E | Human | Esophagus | ESCC | 2.21e-07 | 1.90e-01 | 0.108 |
| 6560 | SLC12A4 | P24T-E | Human | Esophagus | ESCC | 4.88e-07 | 1.03e-01 | 0.1287 |
| Page: 1 2 3 4 5 |
| Tissue | Expression Dynamics | Abbreviation |
| Esophagus | 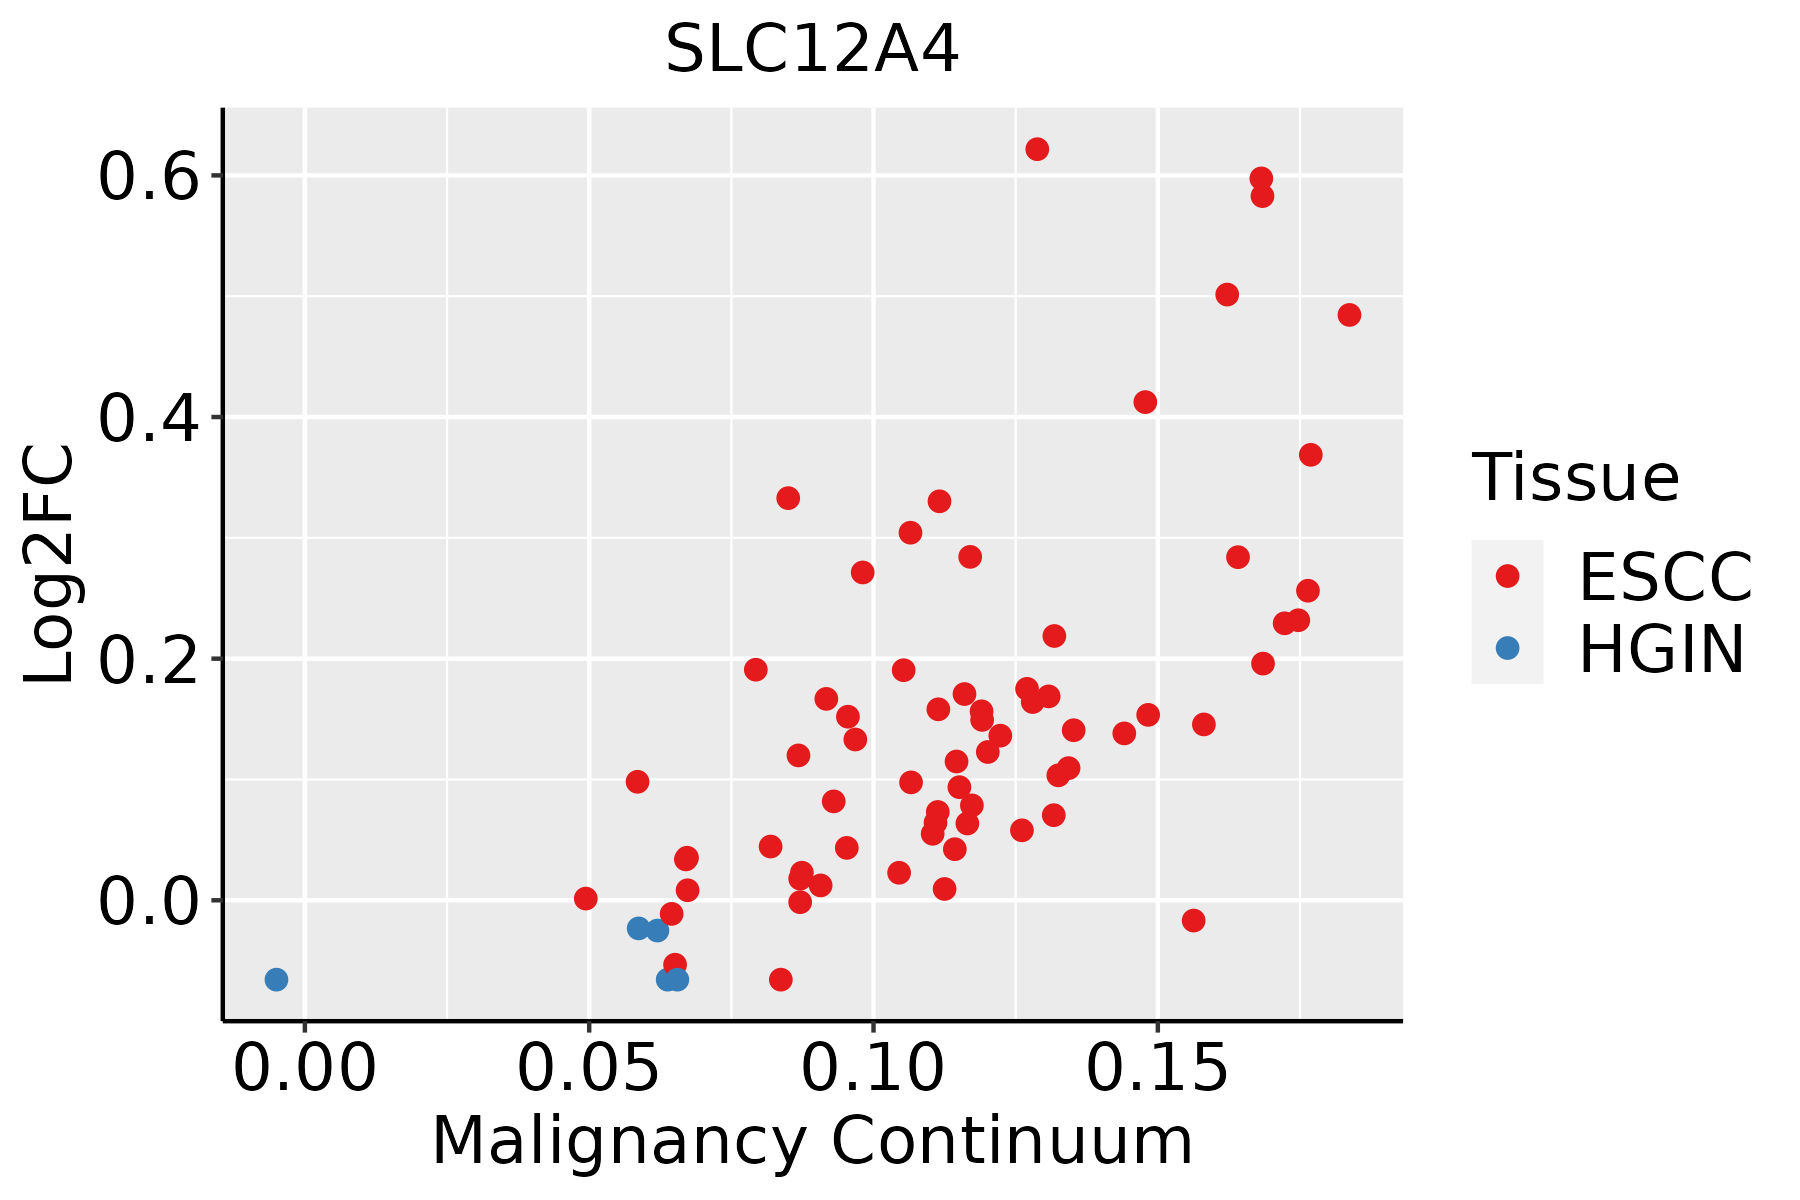 | ESCC: Esophageal squamous cell carcinoma |
| HGIN: High-grade intraepithelial neoplasias | ||
| LGIN: Low-grade intraepithelial neoplasias | ||
| Oral Cavity |  | EOLP: Erosive Oral lichen planus |
| LP: leukoplakia | ||
| NEOLP: Non-erosive oral lichen planus | ||
| OSCC: Oral squamous cell carcinoma | ||
| Skin | 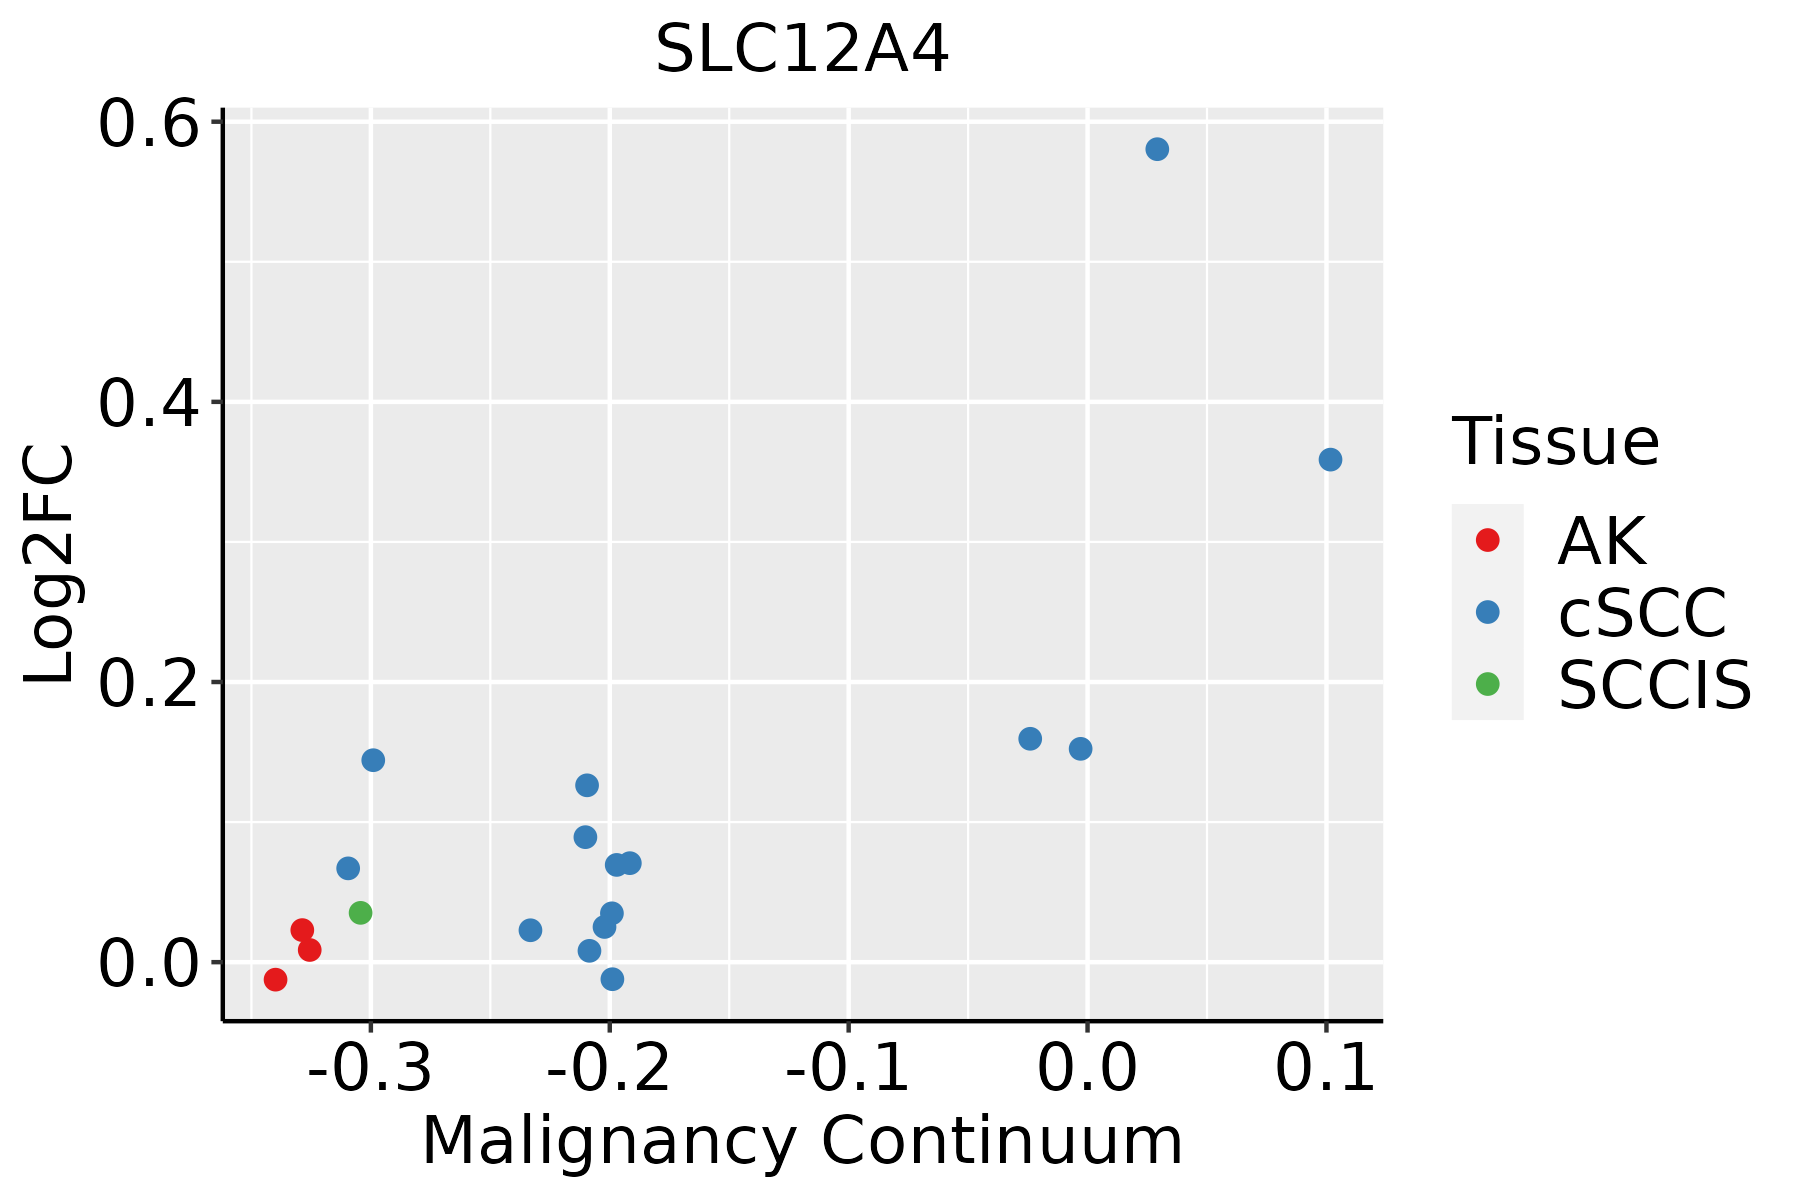 | AK: Actinic keratosis |
| cSCC: Cutaneous squamous cell carcinoma | ||
| SCCIS:squamous cell carcinoma in situ | ||
| Thyroid | 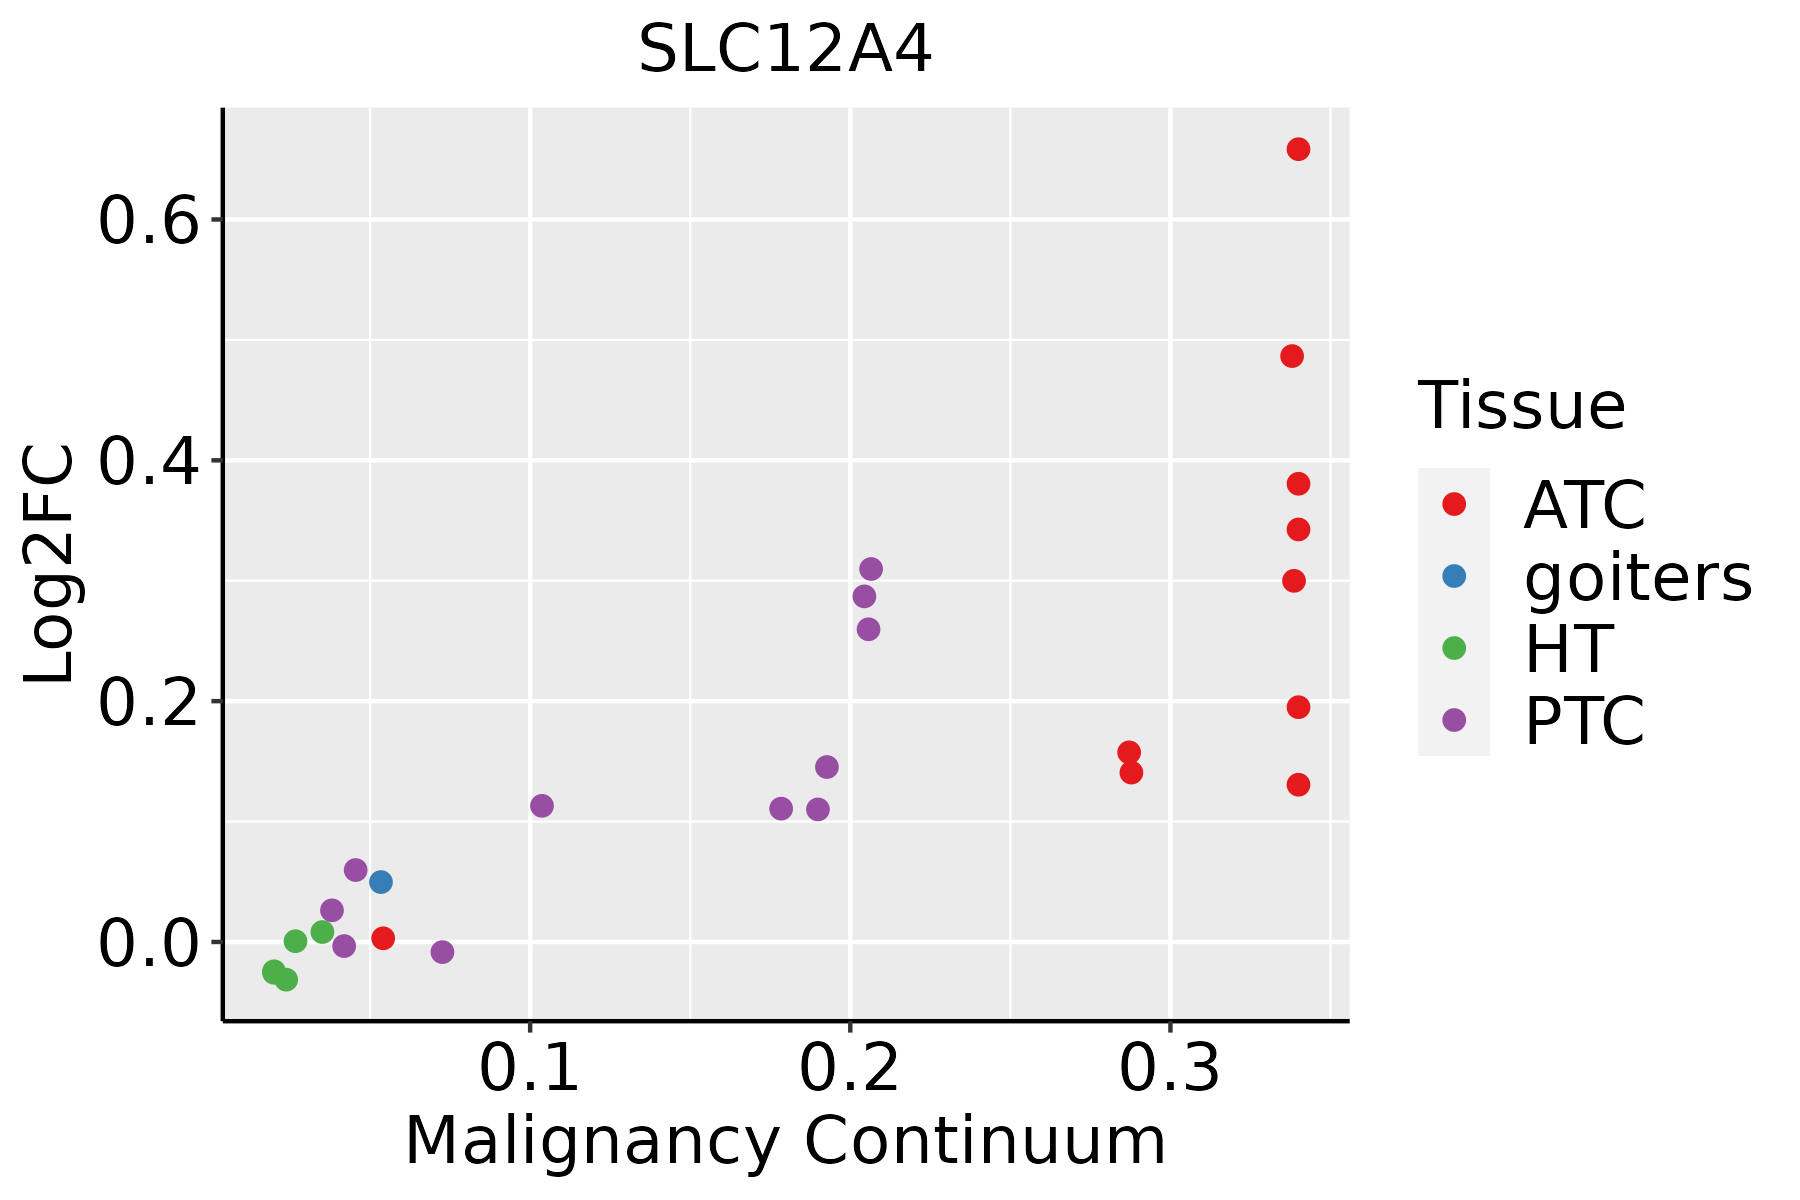 | ATC: Anaplastic thyroid cancer |
| HT: Hashimoto's thyroiditis | ||
| PTC: Papillary thyroid cancer |
| ∗log2FC in expression of this searched gene in stem-like cells from each diseased tissue sample relative to stem-like cells in normal samples in each tissue plotted against the malignancy continuum. Samples are colored based on if they are from different disease stage. |
Top |
Malignant transformation related pathway analysis |
| Find out the enriched GO biological processes and KEGG pathways involved in transition from healthy to precancer to cancer |
| Tissue | Disease Stage | Enriched GO biological Processes |
| Colorectum | AD |  |
| Colorectum | SER |  |
| Colorectum | MSS |  |
| Colorectum | MSI-H |  |
| Colorectum | FAP |  |
| ∗Top 15 enriched GO BP terms are showed in the bar plot of each disease state in each tissue. Each row represents a significant GO biological process which is colored according to the -log10(p.adjust). |
| Page: 1 2 3 4 5 6 7 8 9 |
| GO ID | Tissue | Disease Stage | Description | Gene Ratio | Bg Ratio | pvalue | p.adjust | Count |
| GO:003253520 | Esophagus | ESCC | regulation of cellular component size | 227/8552 | 383/18723 | 4.77e-08 | 8.60e-07 | 227 |
| GO:00083619 | Esophagus | ESCC | regulation of cell size | 107/8552 | 181/18723 | 1.81e-04 | 1.16e-03 | 107 |
| GO:003253519 | Oral cavity | OSCC | regulation of cellular component size | 201/7305 | 383/18723 | 4.80e-08 | 8.88e-07 | 201 |
| GO:00083618 | Oral cavity | OSCC | regulation of cell size | 92/7305 | 181/18723 | 7.86e-04 | 4.26e-03 | 92 |
| GO:0032535110 | Oral cavity | LP | regulation of cellular component size | 128/4623 | 383/18723 | 6.56e-05 | 8.80e-04 | 128 |
| GO:0032535111 | Skin | cSCC | regulation of cellular component size | 131/4864 | 383/18723 | 1.89e-04 | 1.59e-03 | 131 |
| GO:0032535112 | Thyroid | PTC | regulation of cellular component size | 181/5968 | 383/18723 | 1.70e-10 | 5.64e-09 | 181 |
| GO:000836115 | Thyroid | PTC | regulation of cell size | 83/5968 | 181/18723 | 5.45e-05 | 4.84e-04 | 83 |
| GO:003253526 | Thyroid | ATC | regulation of cellular component size | 191/6293 | 383/18723 | 2.51e-11 | 8.69e-10 | 191 |
| GO:000836122 | Thyroid | ATC | regulation of cell size | 89/6293 | 181/18723 | 1.01e-05 | 1.00e-04 | 89 |
| Page: 1 |
| Pathway ID | Tissue | Disease Stage | Description | Gene Ratio | Bg Ratio | pvalue | p.adjust | qvalue | Count |
| Page: 1 |
Top |
Cell-cell communication analysis |
| Identification of potential cell-cell interactions between two cell types and their ligand-receptor pairs for different disease states |
| Ligand | Receptor | LRpair | Pathway | Tissue | Disease Stage |
| Page: 1 |
Top |
Single-cell gene regulatory network inference analysis |
| Find out the significant the regulons (TFs) and the target genes of each regulon across cell types for different disease states |
| TF | Cell Type | Tissue | Disease Stage | Target Gene | RSS | Regulon Activity |
| ∗The dot plots of a searched regulon are shown for all cell subpopulations in each disease state of each tissue based on the regulon specific score inferred using pySCENIC and by calculating the average expression. |
| Page: 1 |
Top |
Somatic mutation of malignant transformation related genes |
| Annotation of somatic variants for genes involved in malignant transformation |
| Hugo Symbol | Variant Class | Variant Classification | dbSNP RS | HGVSc | HGVSp | HGVSp Short | SWISSPROT | BIOTYPE | SIFT | PolyPhen | Tumor Sample Barcode | Tissue | Histology | Sex | Age | Stage | Therapy Types | Drugs | Outcome |
| SLC12A4 | SNV | Missense_Mutation | novel | c.1724N>T | p.Ser575Phe | p.S575F | Q9UP95 | protein_coding | deleterious(0.04) | benign(0.288) | TCGA-5L-AAT1-01 | Breast | breast invasive carcinoma | Female | <65 | III/IV | Hormone Therapy | letrozol | SD |
| SLC12A4 | SNV | Missense_Mutation | c.245N>G | p.Ser82Trp | p.S82W | Q9UP95 | protein_coding | deleterious(0) | probably_damaging(0.987) | TCGA-A2-A0D0-01 | Breast | breast invasive carcinoma | Female | <65 | I/II | Chemotherapy | cytoxan | SD | |
| SLC12A4 | SNV | Missense_Mutation | rs751840065 | c.719N>T | p.Ser240Leu | p.S240L | Q9UP95 | protein_coding | tolerated(0.06) | benign(0.045) | TCGA-AC-A23H-01 | Breast | breast invasive carcinoma | Female | >=65 | I/II | Unknown | Unknown | PD |
| SLC12A4 | SNV | Missense_Mutation | novel | c.2771C>A | p.Thr924Asn | p.T924N | Q9UP95 | protein_coding | deleterious(0) | probably_damaging(0.981) | TCGA-C8-A3M8-01 | Breast | breast invasive carcinoma | Female | >=65 | I/II | Hormone Therapy | tamoxiphen | CR |
| SLC12A4 | deletion | Frame_Shift_Del | novel | c.1146delG | p.Trp383GlyfsTer24 | p.W383Gfs*24 | Q9UP95 | protein_coding | TCGA-D8-A27V-01 | Breast | breast invasive carcinoma | Female | <65 | I/II | Hormone Therapy | tamoxiphen | SD | ||
| SLC12A4 | deletion | Frame_Shift_Del | novel | c.664delG | p.Ala222ProfsTer6 | p.A222Pfs*6 | Q9UP95 | protein_coding | TCGA-D8-A27V-01 | Breast | breast invasive carcinoma | Female | <65 | I/II | Hormone Therapy | tamoxiphen | SD | ||
| SLC12A4 | SNV | Missense_Mutation | novel | c.1875G>C | p.Met625Ile | p.M625I | Q9UP95 | protein_coding | deleterious(0.03) | benign(0.242) | TCGA-C5-A2LY-01 | Cervix | cervical & endocervical cancer | Female | <65 | I/II | Chemotherapy | cisplatin | SD |
| SLC12A4 | SNV | Missense_Mutation | rs751840065 | c.719N>T | p.Ser240Leu | p.S240L | Q9UP95 | protein_coding | tolerated(0.06) | benign(0.045) | TCGA-DS-A0VM-01 | Cervix | cervical & endocervical cancer | Female | <65 | I/II | Chemotherapy | cisplatin | PD |
| SLC12A4 | SNV | Missense_Mutation | c.266N>C | p.Val89Ala | p.V89A | Q9UP95 | protein_coding | tolerated(1) | benign(0.001) | TCGA-FU-A3HZ-01 | Cervix | cervical & endocervical cancer | Female | <65 | I/II | Chemotherapy | cisplatin | CR | |
| SLC12A4 | SNV | Missense_Mutation | novel | c.2823N>C | p.Met941Ile | p.M941I | Q9UP95 | protein_coding | tolerated(0.12) | benign(0.406) | TCGA-VS-A958-01 | Cervix | cervical & endocervical cancer | Female | <65 | I/II | Chemotherapy | cisplatin | CR |
| Page: 1 2 3 4 5 6 7 8 9 10 11 |
Top |
Related drugs of malignant transformation related genes |
| Identification of chemicals and drugs interact with genes involved in malignant transfromation |
| (DGIdb 4.0) |
| Entrez ID | Symbol | Category | Interaction Types | Drug Claim Name | Drug Name | PMIDs |
| 6560 | SLC12A4 | EXTERNAL SIDE OF PLASMA MEMBRANE, DRUGGABLE GENOME, TRANSPORTER | inhibitor | 178101310 | ||
| 6560 | SLC12A4 | EXTERNAL SIDE OF PLASMA MEMBRANE, DRUGGABLE GENOME, TRANSPORTER | BUMETANIDE | BUMETANIDE | ||
| 6560 | SLC12A4 | EXTERNAL SIDE OF PLASMA MEMBRANE, DRUGGABLE GENOME, TRANSPORTER | BUMETANIDE | BUMETANIDE |
| Page: 1 |

Copyright 2023-Present -The University of Texas Health Science Center at Houston |