
|
|||||
|
 | |
| |
| |
| |
| |
| |
|
Gene: SLC11A2 |
Gene summary for SLC11A2 |
| Gene information | Species | Human | Gene symbol | SLC11A2 | Gene ID | 4891 |
| Gene name | solute carrier family 11 member 2 | |
| Gene Alias | AHMIO1 | |
| Cytomap | 12q13.12 | |
| Gene Type | protein-coding | GO ID | GO:0000041 | UniProtAcc | P49281 |
Top |
Malignant transformation analysis |
| Identification of the aberrant gene expression in precancerous and cancerous lesions by comparing the gene expression of stem-like cells in diseased tissues with normal stem cells |
| Entrez ID | Symbol | Replicates | Species | Organ | Tissue | Adj P-value | Log2FC | Malignancy |
| 4891 | SLC11A2 | LZE7T | Human | Esophagus | ESCC | 6.38e-06 | 1.69e-01 | 0.0667 |
| 4891 | SLC11A2 | LZE24T | Human | Esophagus | ESCC | 4.45e-07 | 1.88e-01 | 0.0596 |
| 4891 | SLC11A2 | P2T-E | Human | Esophagus | ESCC | 2.24e-37 | 5.77e-01 | 0.1177 |
| 4891 | SLC11A2 | P4T-E | Human | Esophagus | ESCC | 9.77e-17 | 1.57e-01 | 0.1323 |
| 4891 | SLC11A2 | P5T-E | Human | Esophagus | ESCC | 3.15e-18 | 5.88e-02 | 0.1327 |
| 4891 | SLC11A2 | P8T-E | Human | Esophagus | ESCC | 4.87e-20 | 3.48e-01 | 0.0889 |
| 4891 | SLC11A2 | P9T-E | Human | Esophagus | ESCC | 5.51e-03 | 1.77e-02 | 0.1131 |
| 4891 | SLC11A2 | P10T-E | Human | Esophagus | ESCC | 1.36e-10 | 7.10e-02 | 0.116 |
| 4891 | SLC11A2 | P11T-E | Human | Esophagus | ESCC | 9.97e-06 | 9.55e-02 | 0.1426 |
| 4891 | SLC11A2 | P12T-E | Human | Esophagus | ESCC | 1.29e-13 | 2.13e-01 | 0.1122 |
| 4891 | SLC11A2 | P15T-E | Human | Esophagus | ESCC | 1.26e-13 | 2.23e-01 | 0.1149 |
| 4891 | SLC11A2 | P16T-E | Human | Esophagus | ESCC | 4.71e-27 | 2.54e-01 | 0.1153 |
| 4891 | SLC11A2 | P20T-E | Human | Esophagus | ESCC | 3.53e-09 | 3.65e-02 | 0.1124 |
| 4891 | SLC11A2 | P21T-E | Human | Esophagus | ESCC | 1.77e-06 | 1.17e-01 | 0.1617 |
| 4891 | SLC11A2 | P22T-E | Human | Esophagus | ESCC | 1.85e-18 | 7.22e-02 | 0.1236 |
| 4891 | SLC11A2 | P23T-E | Human | Esophagus | ESCC | 3.74e-15 | 2.40e-01 | 0.108 |
| 4891 | SLC11A2 | P24T-E | Human | Esophagus | ESCC | 1.78e-11 | 5.23e-02 | 0.1287 |
| 4891 | SLC11A2 | P26T-E | Human | Esophagus | ESCC | 1.26e-12 | 2.53e-01 | 0.1276 |
| 4891 | SLC11A2 | P27T-E | Human | Esophagus | ESCC | 1.33e-11 | 1.29e-01 | 0.1055 |
| 4891 | SLC11A2 | P28T-E | Human | Esophagus | ESCC | 6.87e-07 | 6.99e-02 | 0.1149 |
| Page: 1 2 3 4 |
| Tissue | Expression Dynamics | Abbreviation |
| Prostate | 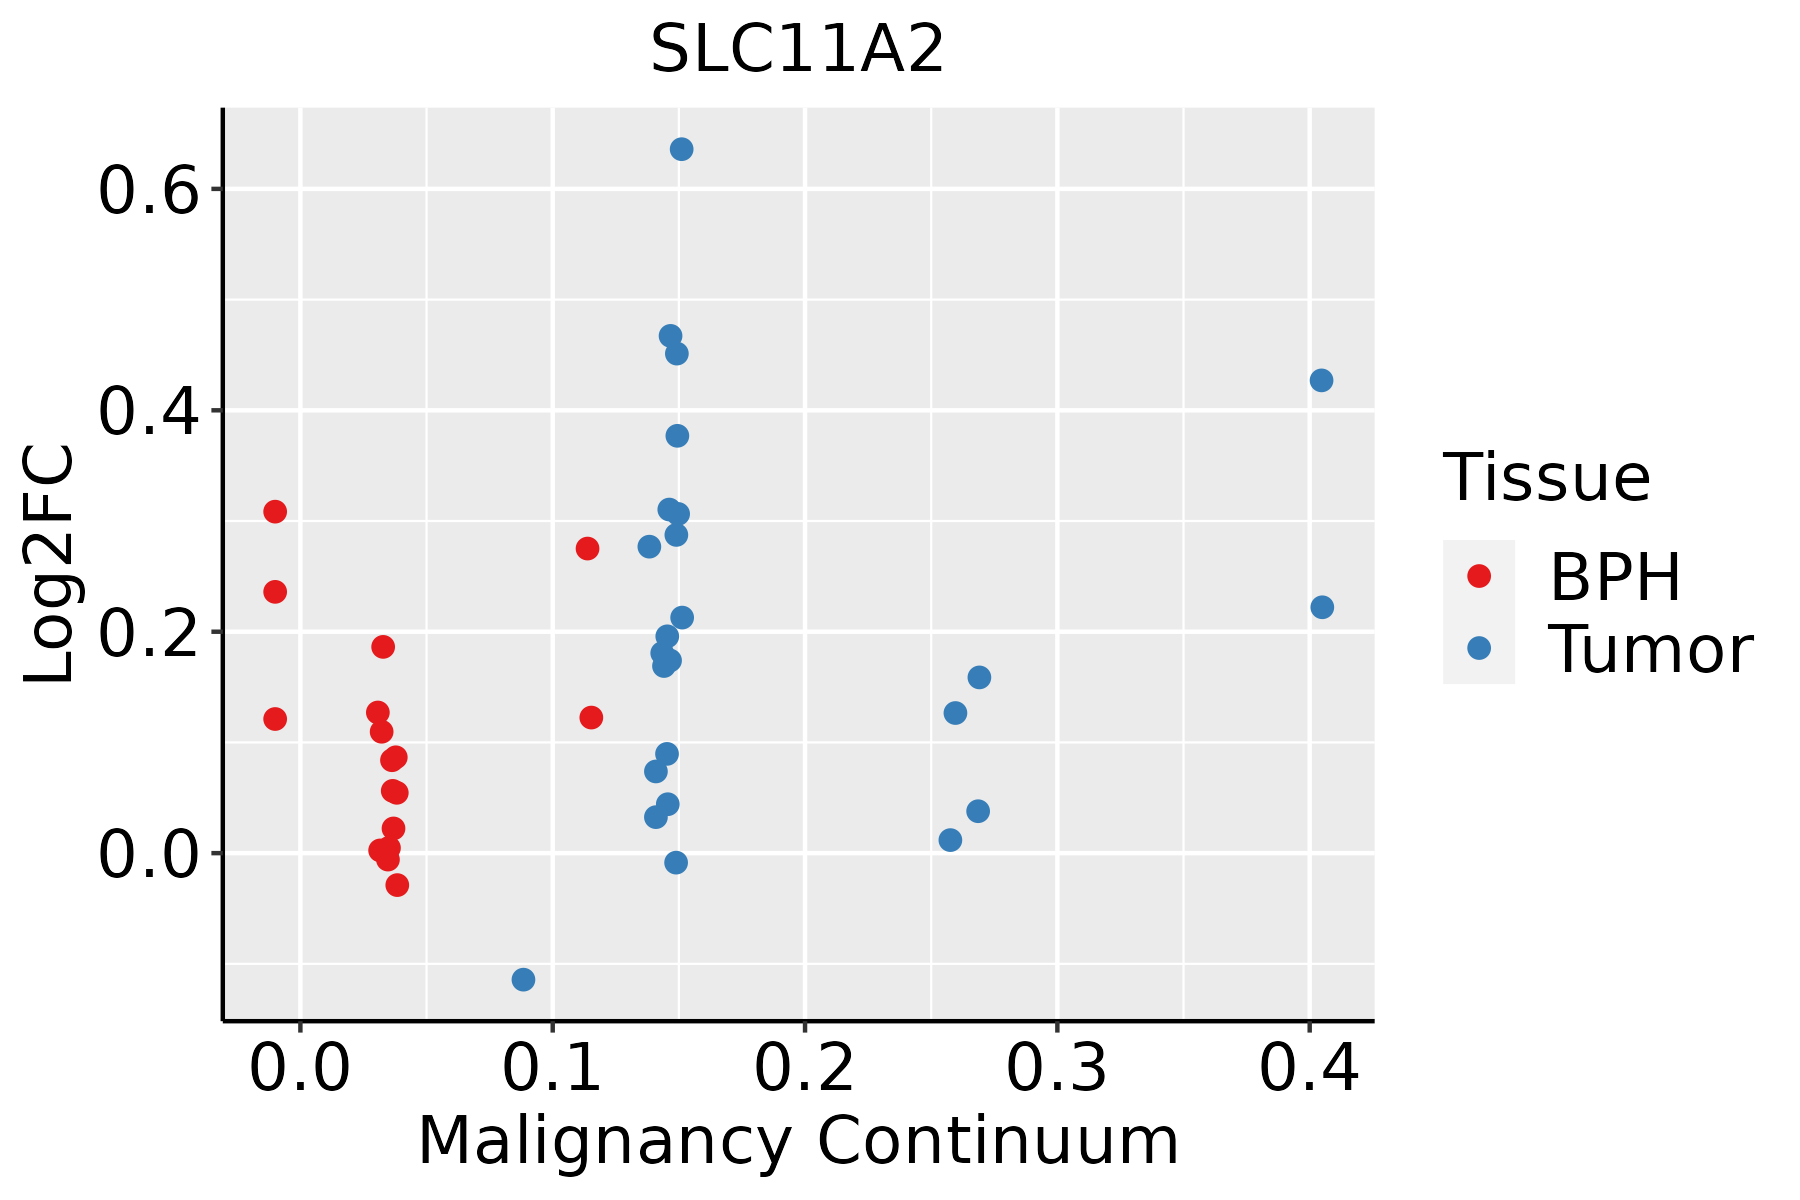 | BPH: Benign Prostatic Hyperplasia |
| Thyroid |  | ATC: Anaplastic thyroid cancer |
| HT: Hashimoto's thyroiditis | ||
| PTC: Papillary thyroid cancer |
| ∗log2FC in expression of this searched gene in stem-like cells from each diseased tissue sample relative to stem-like cells in normal samples in each tissue plotted against the malignancy continuum. Samples are colored based on if they are from different disease stage. |
Top |
Malignant transformation related pathway analysis |
| Find out the enriched GO biological processes and KEGG pathways involved in transition from healthy to precancer to cancer |
| Tissue | Disease Stage | Enriched GO biological Processes |
| Colorectum | AD |  |
| Colorectum | SER |  |
| Colorectum | MSS |  |
| Colorectum | MSI-H |  |
| Colorectum | FAP |  |
| ∗Top 15 enriched GO BP terms are showed in the bar plot of each disease state in each tissue. Each row represents a significant GO biological process which is colored according to the -log10(p.adjust). |
| Page: 1 2 3 4 5 6 7 8 9 |
| GO ID | Tissue | Disease Stage | Description | Gene Ratio | Bg Ratio | pvalue | p.adjust | Count |
| GO:003009918 | Prostate | BPH | myeloid cell differentiation | 115/3107 | 381/18723 | 2.22e-11 | 1.51e-09 | 115 |
| GO:007048217 | Prostate | BPH | response to oxygen levels | 104/3107 | 347/18723 | 3.13e-10 | 1.67e-08 | 104 |
| GO:003629317 | Prostate | BPH | response to decreased oxygen levels | 96/3107 | 322/18723 | 2.03e-09 | 8.26e-08 | 96 |
| GO:000166617 | Prostate | BPH | response to hypoxia | 92/3107 | 307/18723 | 3.29e-09 | 1.27e-07 | 92 |
| GO:003410118 | Prostate | BPH | erythrocyte homeostasis | 48/3107 | 129/18723 | 1.34e-08 | 4.26e-07 | 48 |
| GO:001003818 | Prostate | BPH | response to metal ion | 104/3107 | 373/18723 | 2.32e-08 | 6.99e-07 | 104 |
| GO:000226218 | Prostate | BPH | myeloid cell homeostasis | 54/3107 | 157/18723 | 4.02e-08 | 1.12e-06 | 54 |
| GO:003021818 | Prostate | BPH | erythrocyte differentiation | 44/3107 | 120/18723 | 8.72e-08 | 2.16e-06 | 44 |
| GO:004887218 | Prostate | BPH | homeostasis of number of cells | 79/3107 | 272/18723 | 1.79e-07 | 3.99e-06 | 79 |
| GO:190260015 | Prostate | BPH | proton transmembrane transport | 52/3107 | 157/18723 | 2.81e-07 | 6.06e-06 | 52 |
| GO:00163589 | Prostate | BPH | dendrite development | 71/3107 | 243/18723 | 5.73e-07 | 1.14e-05 | 71 |
| GO:00488136 | Prostate | BPH | dendrite morphogenesis | 45/3107 | 146/18723 | 1.46e-05 | 1.88e-04 | 45 |
| GO:00550769 | Prostate | BPH | transition metal ion homeostasis | 43/3107 | 138/18723 | 1.66e-05 | 2.07e-04 | 43 |
| GO:00550727 | Prostate | BPH | iron ion homeostasis | 29/3107 | 85/18723 | 6.22e-05 | 6.23e-04 | 29 |
| GO:00469167 | Prostate | BPH | cellular transition metal ion homeostasis | 35/3107 | 115/18723 | 1.64e-04 | 1.42e-03 | 35 |
| GO:0050890 | Prostate | BPH | cognition | 69/3107 | 296/18723 | 1.68e-03 | 9.69e-03 | 69 |
| GO:00068793 | Prostate | BPH | cellular iron ion homeostasis | 21/3107 | 67/18723 | 2.09e-03 | 1.17e-02 | 21 |
| GO:00100392 | Prostate | BPH | response to iron ion | 12/3107 | 32/18723 | 3.66e-03 | 1.85e-02 | 12 |
| GO:0007611 | Prostate | BPH | learning or memory | 59/3107 | 255/18723 | 4.12e-03 | 2.04e-02 | 59 |
| GO:00615152 | Prostate | BPH | myeloid cell development | 21/3107 | 71/18723 | 4.54e-03 | 2.19e-02 | 21 |
| Page: 1 2 3 4 |
| Pathway ID | Tissue | Disease Stage | Description | Gene Ratio | Bg Ratio | pvalue | p.adjust | qvalue | Count |
| hsa0501228 | Prostate | BPH | Parkinson disease | 143/1718 | 266/8465 | 1.19e-34 | 3.94e-32 | 2.44e-32 | 143 |
| hsa0501026 | Prostate | BPH | Alzheimer disease | 165/1718 | 384/8465 | 4.03e-25 | 1.66e-23 | 1.03e-23 | 165 |
| hsa0421618 | Prostate | BPH | Ferroptosis | 22/1718 | 41/8465 | 2.24e-06 | 2.00e-05 | 1.24e-05 | 22 |
| hsa0497814 | Prostate | BPH | Mineral absorption | 20/1718 | 60/8465 | 1.22e-02 | 3.61e-02 | 2.23e-02 | 20 |
| hsa05012112 | Prostate | BPH | Parkinson disease | 143/1718 | 266/8465 | 1.19e-34 | 3.94e-32 | 2.44e-32 | 143 |
| hsa05010111 | Prostate | BPH | Alzheimer disease | 165/1718 | 384/8465 | 4.03e-25 | 1.66e-23 | 1.03e-23 | 165 |
| hsa0421619 | Prostate | BPH | Ferroptosis | 22/1718 | 41/8465 | 2.24e-06 | 2.00e-05 | 1.24e-05 | 22 |
| hsa0497815 | Prostate | BPH | Mineral absorption | 20/1718 | 60/8465 | 1.22e-02 | 3.61e-02 | 2.23e-02 | 20 |
| hsa0501229 | Prostate | Tumor | Parkinson disease | 144/1791 | 266/8465 | 3.33e-33 | 1.10e-30 | 6.83e-31 | 144 |
| hsa0501027 | Prostate | Tumor | Alzheimer disease | 166/1791 | 384/8465 | 1.64e-23 | 6.79e-22 | 4.21e-22 | 166 |
| hsa0421626 | Prostate | Tumor | Ferroptosis | 24/1791 | 41/8465 | 1.94e-07 | 2.14e-06 | 1.33e-06 | 24 |
| hsa0501237 | Prostate | Tumor | Parkinson disease | 144/1791 | 266/8465 | 3.33e-33 | 1.10e-30 | 6.83e-31 | 144 |
| hsa0501036 | Prostate | Tumor | Alzheimer disease | 166/1791 | 384/8465 | 1.64e-23 | 6.79e-22 | 4.21e-22 | 166 |
| hsa0421636 | Prostate | Tumor | Ferroptosis | 24/1791 | 41/8465 | 1.94e-07 | 2.14e-06 | 1.33e-06 | 24 |
| Page: 1 |
Top |
Cell-cell communication analysis |
| Identification of potential cell-cell interactions between two cell types and their ligand-receptor pairs for different disease states |
| Ligand | Receptor | LRpair | Pathway | Tissue | Disease Stage |
| Page: 1 |
Top |
Single-cell gene regulatory network inference analysis |
| Find out the significant the regulons (TFs) and the target genes of each regulon across cell types for different disease states |
| TF | Cell Type | Tissue | Disease Stage | Target Gene | RSS | Regulon Activity |
| ∗The dot plots of a searched regulon are shown for all cell subpopulations in each disease state of each tissue based on the regulon specific score inferred using pySCENIC and by calculating the average expression. |
| Page: 1 |
Top |
Somatic mutation of malignant transformation related genes |
| Annotation of somatic variants for genes involved in malignant transformation |
| Hugo Symbol | Variant Class | Variant Classification | dbSNP RS | HGVSc | HGVSp | HGVSp Short | SWISSPROT | BIOTYPE | SIFT | PolyPhen | Tumor Sample Barcode | Tissue | Histology | Sex | Age | Stage | Therapy Types | Drugs | Outcome |
| SLC11A2 | SNV | Missense_Mutation | c.1553N>G | p.Ser518Cys | p.S518C | P49281 | protein_coding | tolerated(0.12) | benign(0.012) | TCGA-A8-A08R-01 | Breast | breast invasive carcinoma | Female | <65 | I/II | Unknown | Unknown | SD | |
| SLC11A2 | insertion | In_Frame_Ins | novel | c.851_852insCCTTAGGACTGAAATCAGGTC | p.Gln284delinsHisLeuArgThrGluIleArgSer | p.Q284delinsHLRTEIRS | P49281 | protein_coding | TCGA-AO-A0J9-01 | Breast | breast invasive carcinoma | Female | <65 | III/IV | Chemotherapy | cyclophosphamide | PD | ||
| SLC11A2 | SNV | Missense_Mutation | novel | c.452N>T | p.Ala151Val | p.A151V | P49281 | protein_coding | deleterious(0) | probably_damaging(0.994) | TCGA-2W-A8YY-01 | Cervix | cervical & endocervical cancer | Female | <65 | I/II | Chemotherapy | cisplatin | CR |
| SLC11A2 | SNV | Missense_Mutation | c.614N>G | p.Ser205Cys | p.S205C | P49281 | protein_coding | deleterious(0) | probably_damaging(0.998) | TCGA-DR-A0ZM-01 | Cervix | cervical & endocervical cancer | Female | <65 | III/IV | Unspecific | Cisplatin | SD | |
| SLC11A2 | SNV | Missense_Mutation | rs199762460 | c.1151N>G | p.Asp384Gly | p.D384G | P49281 | protein_coding | deleterious(0.03) | benign(0.085) | TCGA-AA-3949-01 | Colorectum | colon adenocarcinoma | Female | >=65 | III/IV | Unknown | Unknown | SD |
| SLC11A2 | SNV | Missense_Mutation | rs770229023 | c.833G>A | p.Arg278His | p.R278H | P49281 | protein_coding | deleterious(0.05) | benign(0.005) | TCGA-AD-6964-01 | Colorectum | colon adenocarcinoma | Male | <65 | III/IV | Chemotherapy | folfox | PD |
| SLC11A2 | SNV | Missense_Mutation | rs768901870 | c.1309N>T | p.Arg437Cys | p.R437C | P49281 | protein_coding | deleterious(0) | probably_damaging(0.993) | TCGA-D5-6928-01 | Colorectum | colon adenocarcinoma | Male | >=65 | I/II | Unknown | Unknown | SD |
| SLC11A2 | SNV | Missense_Mutation | c.382G>A | p.Val128Met | p.V128M | P49281 | protein_coding | deleterious(0.05) | benign(0.149) | TCGA-RU-A8FL-01 | Colorectum | colon adenocarcinoma | Male | <65 | III/IV | Chemotherapy | folfox | PD | |
| SLC11A2 | SNV | Missense_Mutation | rs368158015 | c.503N>A | p.Arg168His | p.R168H | P49281 | protein_coding | deleterious(0.04) | benign(0.033) | TCGA-AG-A002-01 | Colorectum | rectum adenocarcinoma | Male | <65 | I/II | Unknown | Unknown | SD |
| SLC11A2 | SNV | Missense_Mutation | rs759374719 | c.1319G>A | p.Arg440Gln | p.R440Q | P49281 | protein_coding | deleterious(0.01) | probably_damaging(0.969) | TCGA-A5-A0G2-01 | Endometrium | uterine corpus endometrioid carcinoma | Female | <65 | III/IV | Unknown | Unknown | SD |
| Page: 1 2 3 4 5 |
Top |
Related drugs of malignant transformation related genes |
| Identification of chemicals and drugs interact with genes involved in malignant transfromation |
| (DGIdb 4.0) |
| Entrez ID | Symbol | Category | Interaction Types | Drug Claim Name | Drug Name | PMIDs |
| 4891 | SLC11A2 | TRANSPORTER, DRUGGABLE GENOME, CELL SURFACE | inhibitor | 252827472 |
| Page: 1 |

Copyright 2023-Present -The University of Texas Health Science Center at Houston |