
|
|||||
|
 | |
| |
| |
| |
| |
| |
|
Gene: SLBP |
Gene summary for SLBP |
| Gene information | Species | Human | Gene symbol | SLBP | Gene ID | 7884 |
| Gene name | stem-loop binding protein | |
| Gene Alias | HBP | |
| Cytomap | 4p16.3 | |
| Gene Type | protein-coding | GO ID | GO:0006139 | UniProtAcc | B3KST9 |
Top |
Malignant transformation analysis |
| Identification of the aberrant gene expression in precancerous and cancerous lesions by comparing the gene expression of stem-like cells in diseased tissues with normal stem cells |
| Entrez ID | Symbol | Replicates | Species | Organ | Tissue | Adj P-value | Log2FC | Malignancy |
| 7884 | SLBP | HTA11_2951_2000001011 | Human | Colorectum | AD | 9.87e-03 | 4.36e-01 | 0.0216 |
| 7884 | SLBP | HTA11_347_2000001011 | Human | Colorectum | AD | 4.33e-03 | 1.57e-01 | -0.1954 |
| 7884 | SLBP | HTA11_3361_2000001011 | Human | Colorectum | AD | 3.47e-14 | 5.70e-01 | -0.1207 |
| 7884 | SLBP | HTA11_696_2000001011 | Human | Colorectum | AD | 1.86e-04 | 2.11e-01 | -0.1464 |
| 7884 | SLBP | HTA11_866_2000001011 | Human | Colorectum | AD | 5.03e-03 | 1.67e-01 | -0.1001 |
| 7884 | SLBP | HTA11_1391_2000001011 | Human | Colorectum | AD | 1.21e-05 | 3.57e-01 | -0.059 |
| 7884 | SLBP | HTA11_6818_2000001011 | Human | Colorectum | AD | 2.25e-04 | 4.23e-01 | 0.0112 |
| 7884 | SLBP | HTA11_99999971662_82457 | Human | Colorectum | MSS | 6.63e-04 | 2.42e-01 | 0.3859 |
| 7884 | SLBP | LZE2T | Human | Esophagus | ESCC | 7.47e-03 | 4.69e-01 | 0.082 |
| 7884 | SLBP | LZE4T | Human | Esophagus | ESCC | 2.90e-06 | 1.13e-01 | 0.0811 |
| 7884 | SLBP | LZE8T | Human | Esophagus | ESCC | 4.95e-04 | -1.58e-01 | 0.067 |
| 7884 | SLBP | LZE20T | Human | Esophagus | ESCC | 7.58e-15 | 4.37e-01 | 0.0662 |
| 7884 | SLBP | LZE21D1 | Human | Esophagus | HGIN | 1.02e-02 | -3.95e-02 | 0.0632 |
| 7884 | SLBP | LZE22D1 | Human | Esophagus | HGIN | 2.71e-02 | 5.85e-02 | 0.0595 |
| 7884 | SLBP | LZE22T | Human | Esophagus | ESCC | 2.94e-02 | 5.49e-01 | 0.068 |
| 7884 | SLBP | LZE24T | Human | Esophagus | ESCC | 2.40e-17 | 7.60e-01 | 0.0596 |
| 7884 | SLBP | LZE21T | Human | Esophagus | ESCC | 4.33e-08 | 2.22e-01 | 0.0655 |
| 7884 | SLBP | LZE6T | Human | Esophagus | ESCC | 4.97e-03 | -9.58e-02 | 0.0845 |
| 7884 | SLBP | P1T-E | Human | Esophagus | ESCC | 3.67e-10 | 7.75e-01 | 0.0875 |
| 7884 | SLBP | P2T-E | Human | Esophagus | ESCC | 3.08e-63 | 1.36e+00 | 0.1177 |
| Page: 1 2 3 4 5 6 7 |
| Tissue | Expression Dynamics | Abbreviation |
| Colorectum (GSE201348) |  | FAP: Familial adenomatous polyposis |
| CRC: Colorectal cancer | ||
| Colorectum (HTA11) |  | AD: Adenomas |
| SER: Sessile serrated lesions | ||
| MSI-H: Microsatellite-high colorectal cancer | ||
| MSS: Microsatellite stable colorectal cancer | ||
| Esophagus | 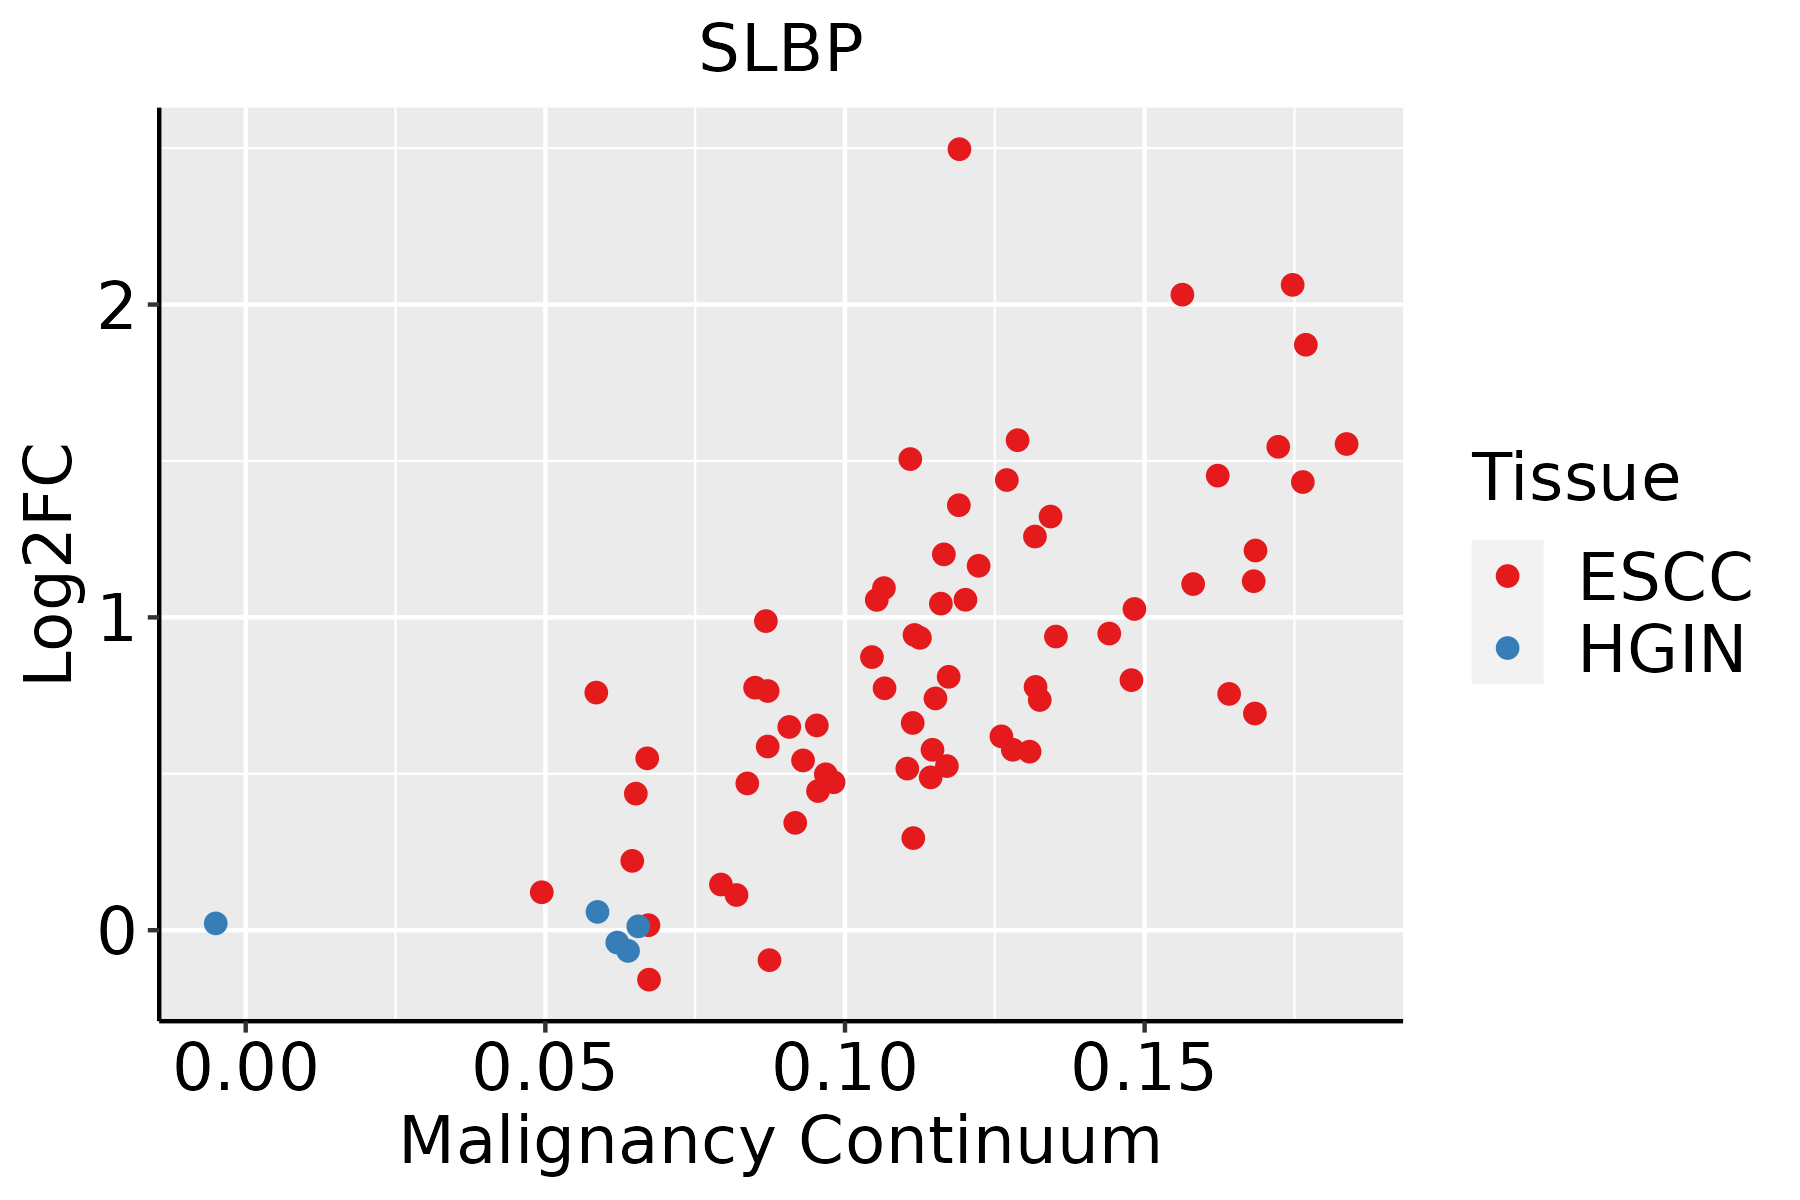 | ESCC: Esophageal squamous cell carcinoma |
| HGIN: High-grade intraepithelial neoplasias | ||
| LGIN: Low-grade intraepithelial neoplasias | ||
| Liver | 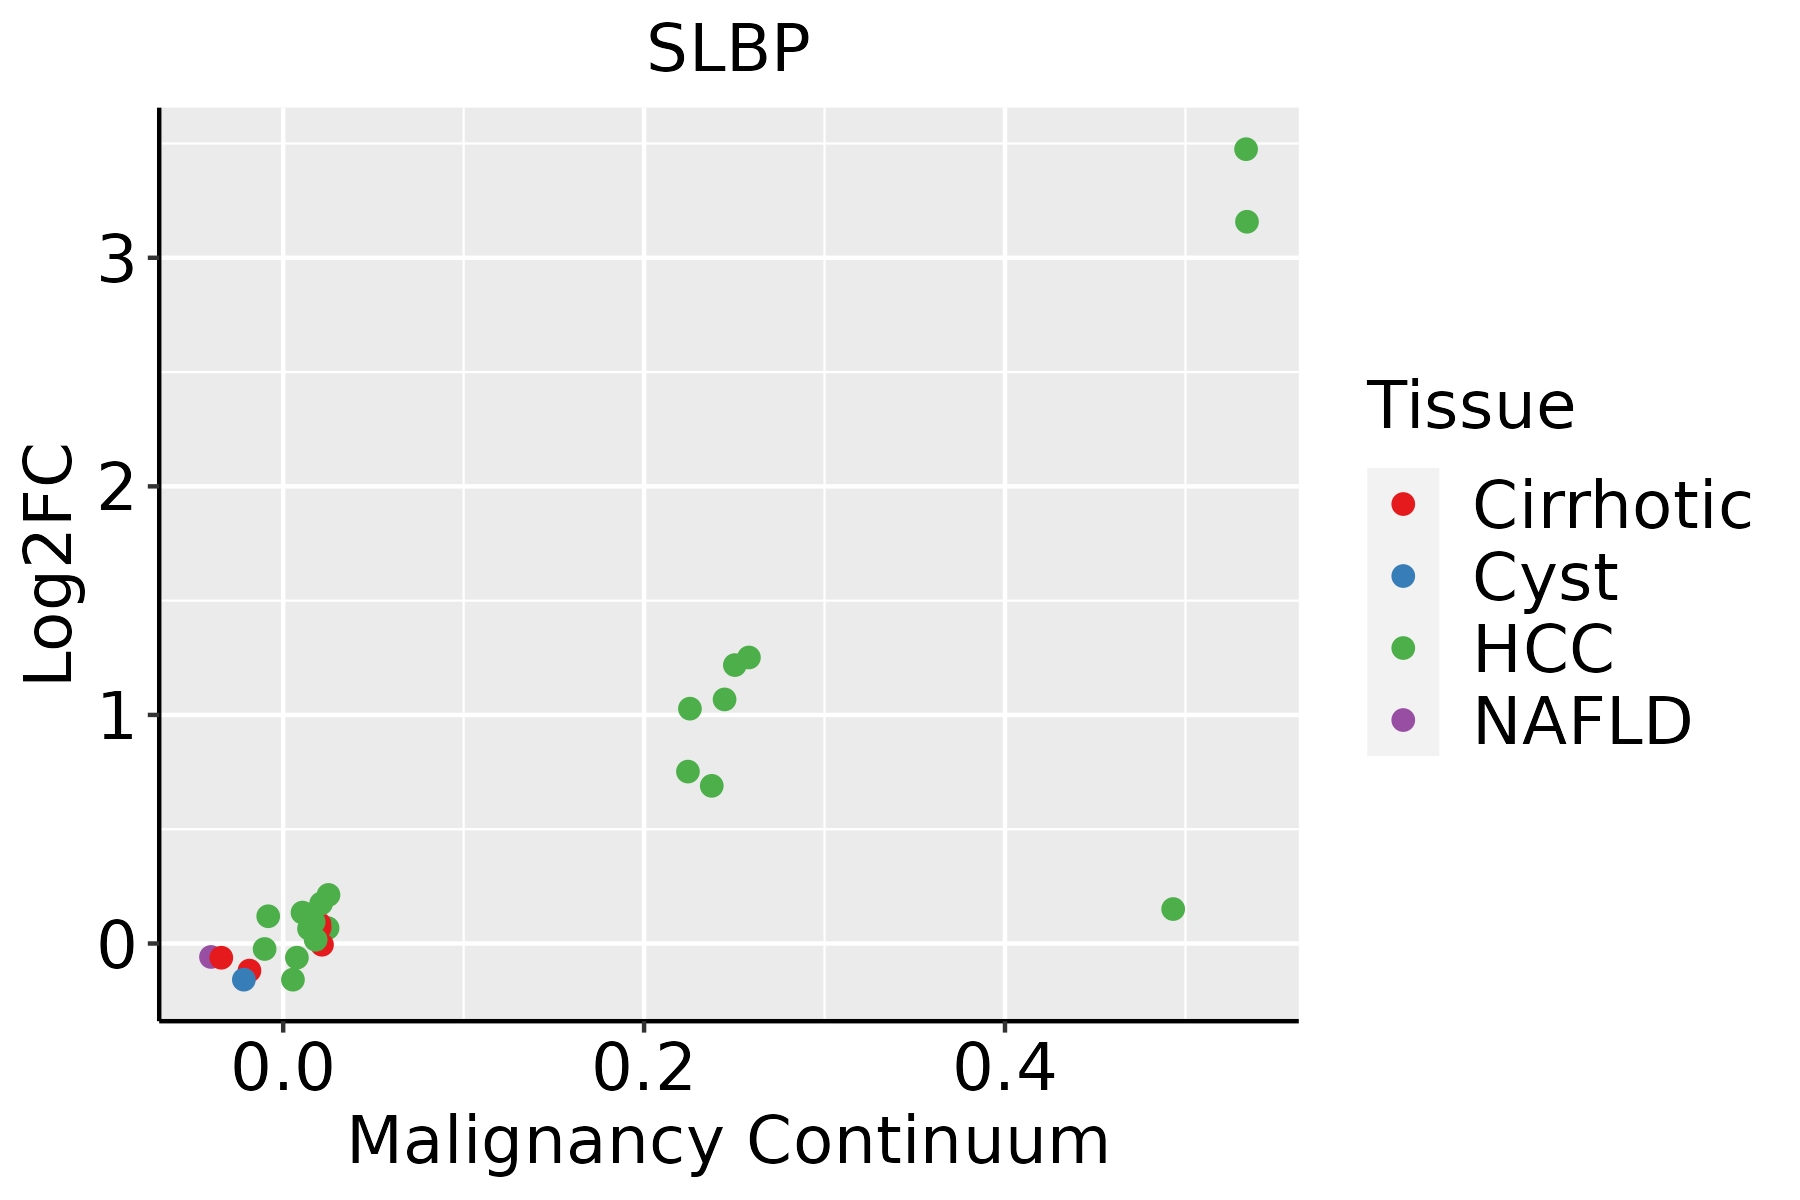 | HCC: Hepatocellular carcinoma |
| NAFLD: Non-alcoholic fatty liver disease | ||
| Oral Cavity | 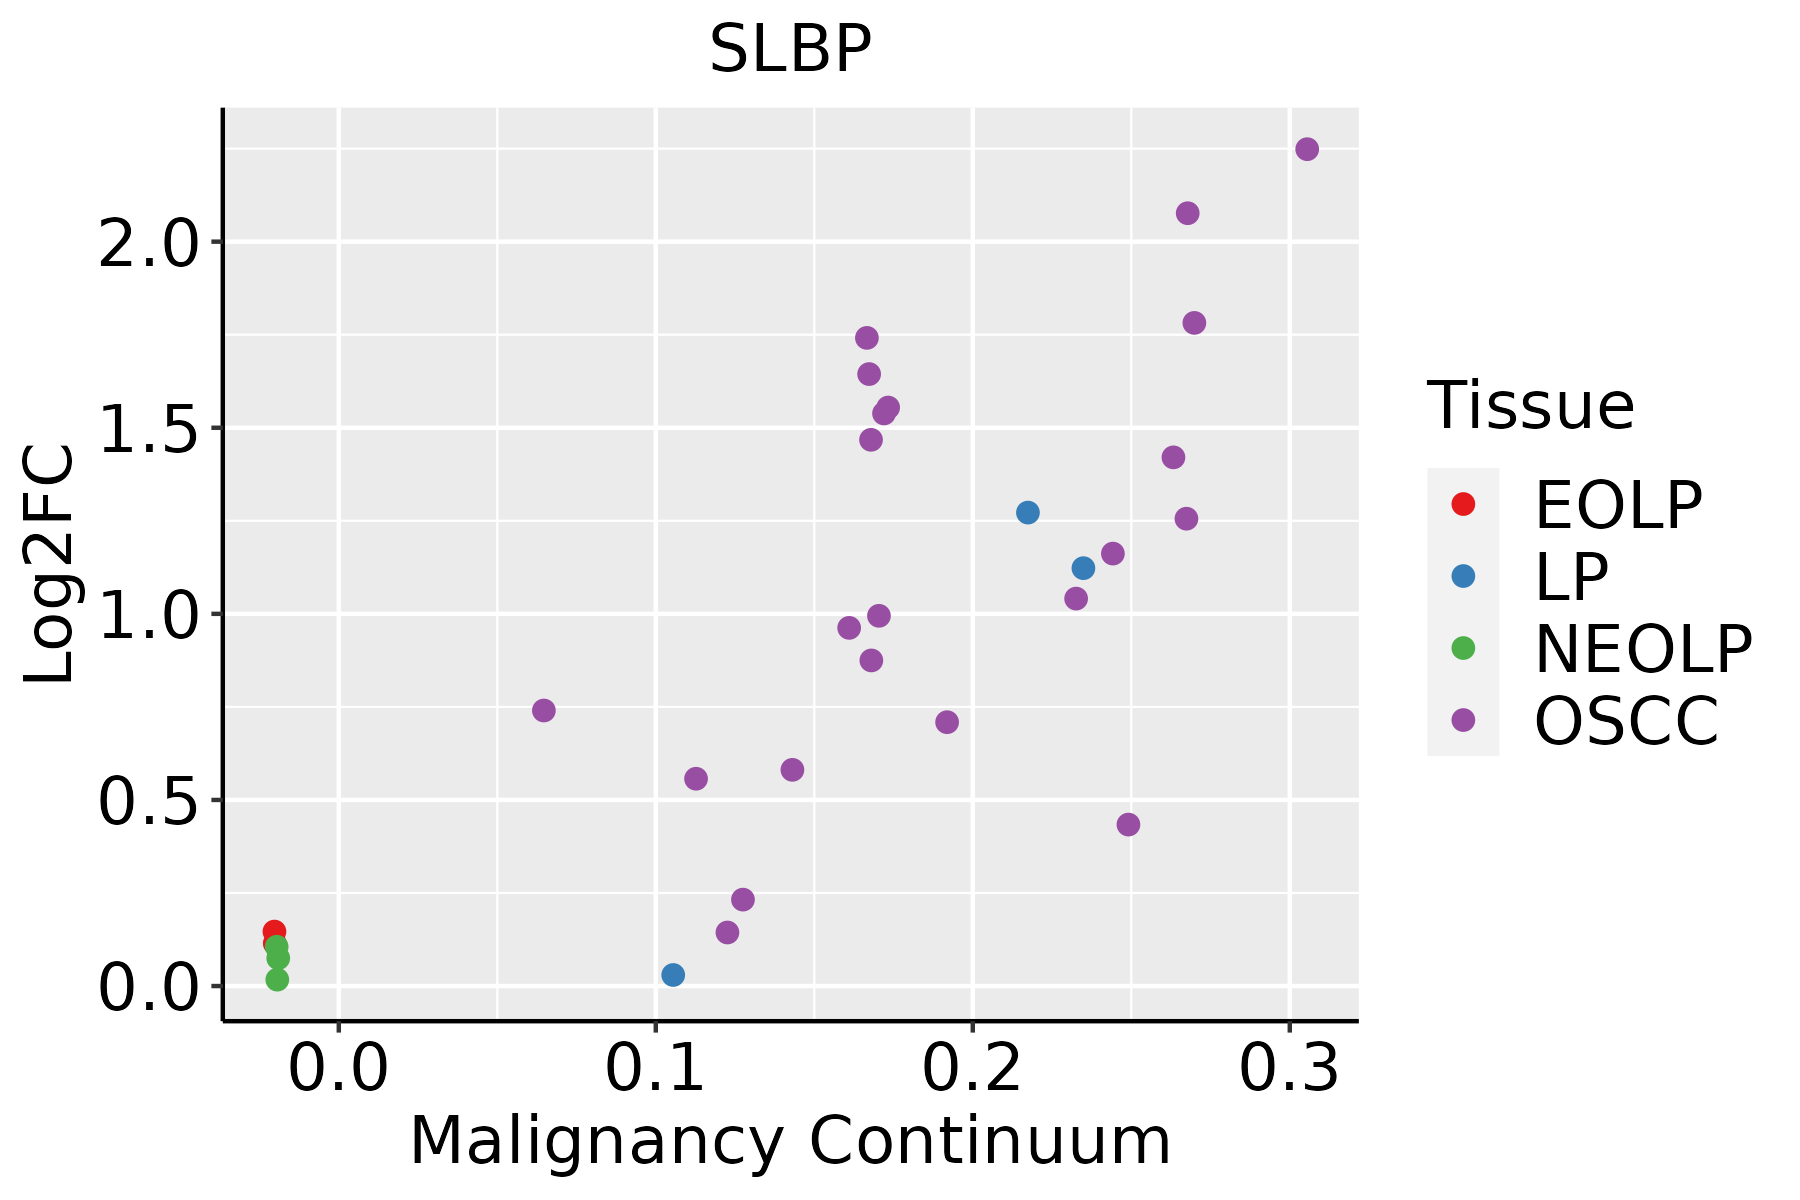 | EOLP: Erosive Oral lichen planus |
| LP: leukoplakia | ||
| NEOLP: Non-erosive oral lichen planus | ||
| OSCC: Oral squamous cell carcinoma | ||
| Skin |  | AK: Actinic keratosis |
| cSCC: Cutaneous squamous cell carcinoma | ||
| SCCIS:squamous cell carcinoma in situ | ||
| Thyroid | 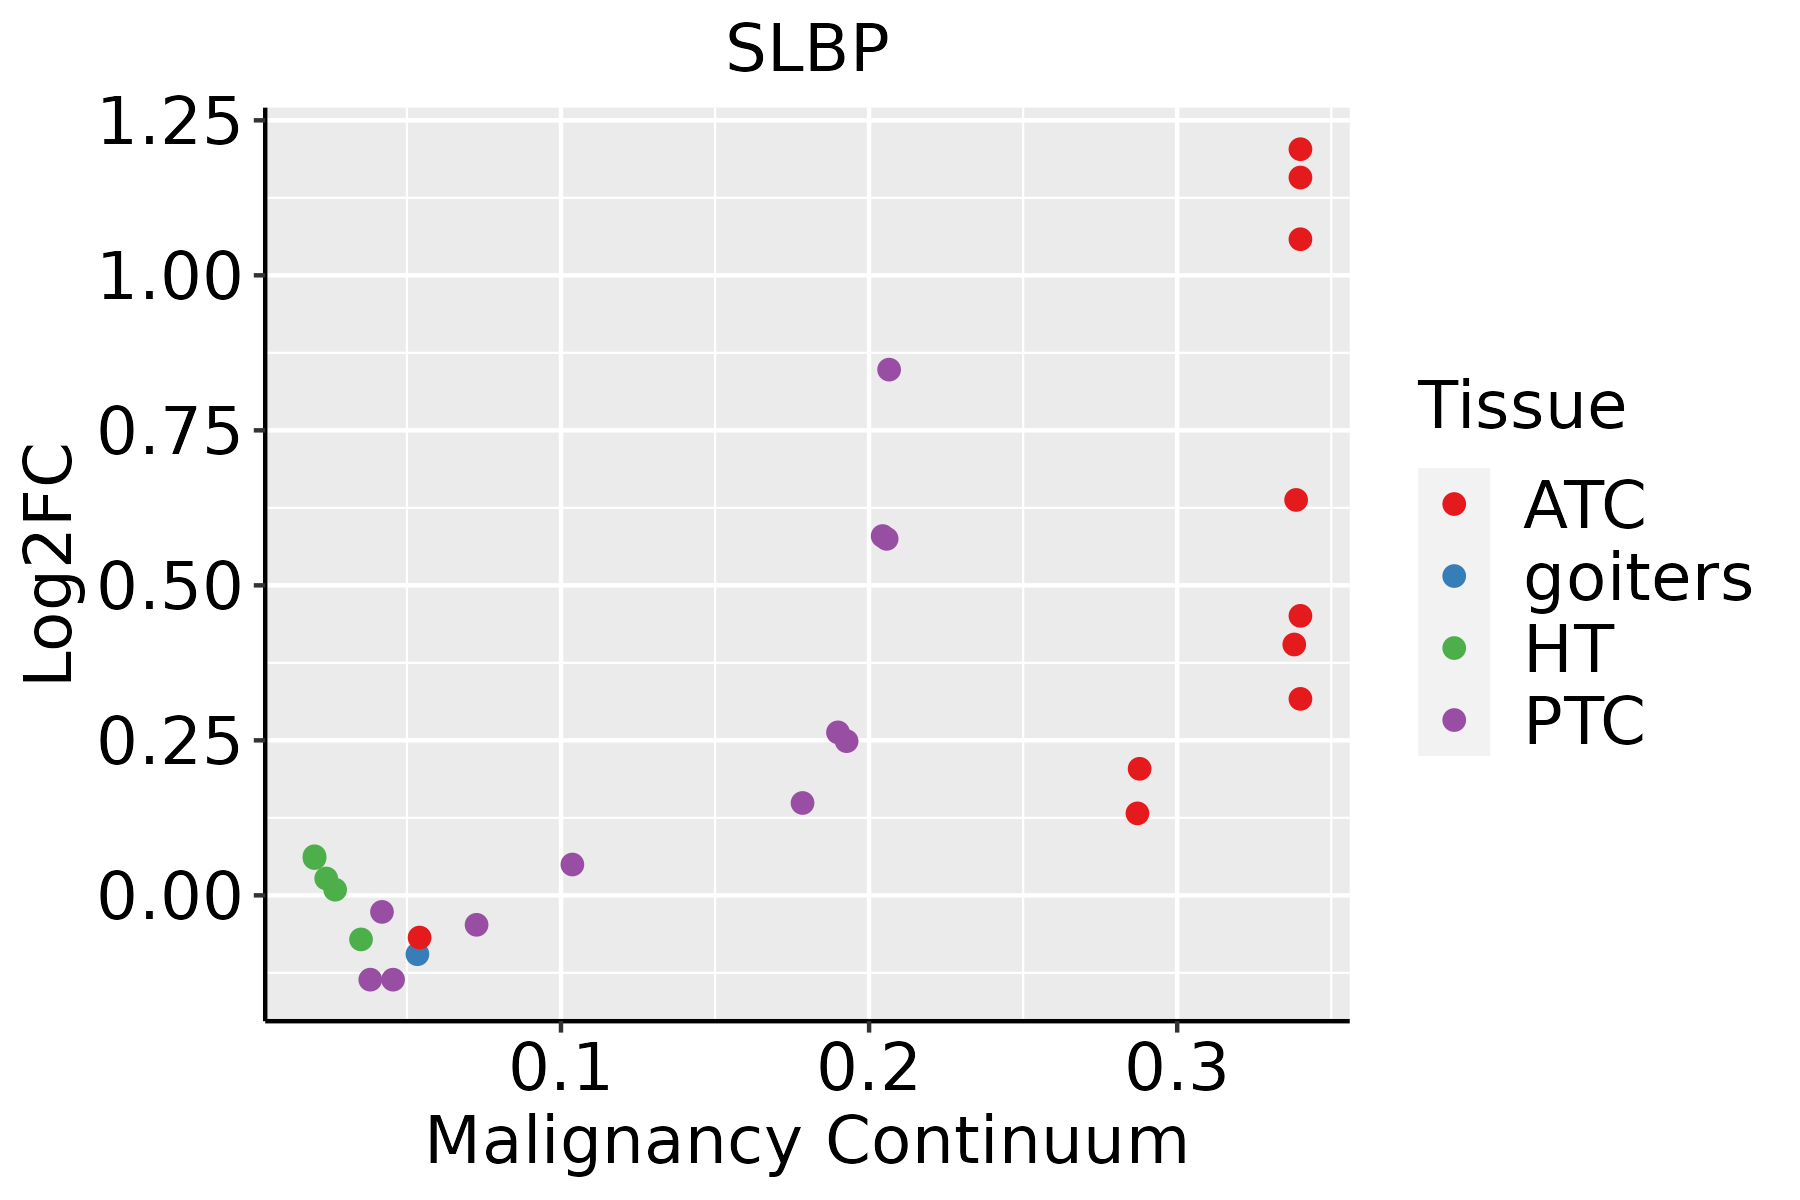 | ATC: Anaplastic thyroid cancer |
| HT: Hashimoto's thyroiditis | ||
| PTC: Papillary thyroid cancer |
| ∗log2FC in expression of this searched gene in stem-like cells from each diseased tissue sample relative to stem-like cells in normal samples in each tissue plotted against the malignancy continuum. Samples are colored based on if they are from different disease stage. |
Top |
Malignant transformation related pathway analysis |
| Find out the enriched GO biological processes and KEGG pathways involved in transition from healthy to precancer to cancer |
| Tissue | Disease Stage | Enriched GO biological Processes |
| Colorectum | AD |  |
| Colorectum | SER |  |
| Colorectum | MSS |  |
| Colorectum | MSI-H |  |
| Colorectum | FAP |  |
| ∗Top 15 enriched GO BP terms are showed in the bar plot of each disease state in each tissue. Each row represents a significant GO biological process which is colored according to the -log10(p.adjust). |
| Page: 1 2 3 4 5 6 7 8 9 |
| GO ID | Tissue | Disease Stage | Description | Gene Ratio | Bg Ratio | pvalue | p.adjust | Count |
| GO:0006403 | Colorectum | AD | RNA localization | 71/3918 | 201/18723 | 1.54e-06 | 4.76e-05 | 71 |
| GO:0051236 | Colorectum | AD | establishment of RNA localization | 58/3918 | 166/18723 | 1.95e-05 | 4.01e-04 | 58 |
| GO:0015931 | Colorectum | AD | nucleobase-containing compound transport | 73/3918 | 222/18723 | 2.02e-05 | 4.10e-04 | 73 |
| GO:0050657 | Colorectum | AD | nucleic acid transport | 57/3918 | 163/18723 | 2.22e-05 | 4.39e-04 | 57 |
| GO:0050658 | Colorectum | AD | RNA transport | 57/3918 | 163/18723 | 2.22e-05 | 4.39e-04 | 57 |
| GO:0051028 | Colorectum | AD | mRNA transport | 42/3918 | 130/18723 | 1.57e-03 | 1.32e-02 | 42 |
| GO:00064032 | Colorectum | MSS | RNA localization | 69/3467 | 201/18723 | 6.33e-08 | 3.26e-06 | 69 |
| GO:00159312 | Colorectum | MSS | nucleobase-containing compound transport | 70/3467 | 222/18723 | 1.92e-06 | 6.01e-05 | 70 |
| GO:00512362 | Colorectum | MSS | establishment of RNA localization | 55/3467 | 166/18723 | 4.54e-06 | 1.27e-04 | 55 |
| GO:00506572 | Colorectum | MSS | nucleic acid transport | 54/3467 | 163/18723 | 5.54e-06 | 1.49e-04 | 54 |
| GO:00506582 | Colorectum | MSS | RNA transport | 54/3467 | 163/18723 | 5.54e-06 | 1.49e-04 | 54 |
| GO:00510281 | Colorectum | MSS | mRNA transport | 40/3467 | 130/18723 | 4.94e-04 | 5.75e-03 | 40 |
| GO:000640320 | Esophagus | HGIN | RNA localization | 66/2587 | 201/18723 | 4.06e-12 | 5.41e-10 | 66 |
| GO:005065716 | Esophagus | HGIN | nucleic acid transport | 49/2587 | 163/18723 | 5.71e-08 | 3.06e-06 | 49 |
| GO:005065816 | Esophagus | HGIN | RNA transport | 49/2587 | 163/18723 | 5.71e-08 | 3.06e-06 | 49 |
| GO:005123616 | Esophagus | HGIN | establishment of RNA localization | 49/2587 | 166/18723 | 1.07e-07 | 5.47e-06 | 49 |
| GO:00510288 | Esophagus | HGIN | mRNA transport | 40/2587 | 130/18723 | 4.67e-07 | 2.07e-05 | 40 |
| GO:001593116 | Esophagus | HGIN | nucleobase-containing compound transport | 57/2587 | 222/18723 | 1.76e-06 | 6.52e-05 | 57 |
| GO:00311243 | Esophagus | HGIN | mRNA 3'-end processing | 18/2587 | 62/18723 | 1.37e-03 | 1.61e-02 | 18 |
| GO:0006403110 | Esophagus | ESCC | RNA localization | 166/8552 | 201/18723 | 1.95e-27 | 6.18e-25 | 166 |
| Page: 1 2 3 4 5 |
| Pathway ID | Tissue | Disease Stage | Description | Gene Ratio | Bg Ratio | pvalue | p.adjust | qvalue | Count |
| Page: 1 |
Top |
Cell-cell communication analysis |
| Identification of potential cell-cell interactions between two cell types and their ligand-receptor pairs for different disease states |
| Ligand | Receptor | LRpair | Pathway | Tissue | Disease Stage |
| Page: 1 |
Top |
Single-cell gene regulatory network inference analysis |
| Find out the significant the regulons (TFs) and the target genes of each regulon across cell types for different disease states |
| TF | Cell Type | Tissue | Disease Stage | Target Gene | RSS | Regulon Activity |
| ∗The dot plots of a searched regulon are shown for all cell subpopulations in each disease state of each tissue based on the regulon specific score inferred using pySCENIC and by calculating the average expression. |
| Page: 1 |
Top |
Somatic mutation of malignant transformation related genes |
| Annotation of somatic variants for genes involved in malignant transformation |
| Hugo Symbol | Variant Class | Variant Classification | dbSNP RS | HGVSc | HGVSp | HGVSp Short | SWISSPROT | BIOTYPE | SIFT | PolyPhen | Tumor Sample Barcode | Tissue | Histology | Sex | Age | Stage | Therapy Types | Drugs | Outcome |
| SLBP | SNV | Missense_Mutation | rs764796066 | c.454G>A | p.Asp152Asn | p.D152N | Q14493 | protein_coding | deleterious(0) | possibly_damaging(0.851) | TCGA-AA-3510-01 | Colorectum | colon adenocarcinoma | Male | >=65 | I/II | Unknown | Unknown | SD |
| SLBP | SNV | Missense_Mutation | rs764796066 | c.454N>A | p.Asp152Asn | p.D152N | Q14493 | protein_coding | deleterious(0) | possibly_damaging(0.851) | TCGA-AA-A010-01 | Colorectum | colon adenocarcinoma | Female | <65 | I/II | Chemotherapy | folinic | CR |
| SLBP | SNV | Missense_Mutation | c.221N>C | p.Asp74Ala | p.D74A | Q14493 | protein_coding | deleterious(0) | possibly_damaging(0.631) | TCGA-AD-6964-01 | Colorectum | colon adenocarcinoma | Male | <65 | III/IV | Chemotherapy | folfox | PD | |
| SLBP | SNV | Missense_Mutation | c.560N>C | p.Ile187Thr | p.I187T | Q14493 | protein_coding | deleterious(0) | probably_damaging(0.999) | TCGA-CM-5861-01 | Colorectum | colon adenocarcinoma | Female | <65 | I/II | Unknown | Unknown | PD | |
| SLBP | SNV | Missense_Mutation | novel | c.794A>G | p.Asp265Gly | p.D265G | Q14493 | protein_coding | deleterious_low_confidence(0) | possibly_damaging(0.71) | TCGA-AG-A00Y-01 | Colorectum | rectum adenocarcinoma | Male | >=65 | I/II | Unknown | Unknown | PD |
| SLBP | SNV | Missense_Mutation | rs751873933 | c.206G>A | p.Arg69His | p.R69H | Q14493 | protein_coding | tolerated(0.47) | benign(0.01) | TCGA-D1-A0ZO-01 | Endometrium | uterine corpus endometrioid carcinoma | Female | >=65 | I/II | Unknown | Unknown | SD |
| SLBP | SNV | Missense_Mutation | rs764796066 | c.454N>A | p.Asp152Asn | p.D152N | Q14493 | protein_coding | deleterious(0) | possibly_damaging(0.851) | TCGA-D1-A16X-01 | Endometrium | uterine corpus endometrioid carcinoma | Female | <65 | I/II | Unknown | Unknown | SD |
| SLBP | SNV | Missense_Mutation | rs764796066 | c.454N>A | p.Asp152Asn | p.D152N | Q14493 | protein_coding | deleterious(0) | possibly_damaging(0.851) | TCGA-EO-A22R-01 | Endometrium | uterine corpus endometrioid carcinoma | Female | <65 | I/II | Unknown | Unknown | SD |
| SLBP | SNV | Missense_Mutation | rs200085408 | c.429C>G | p.Asn143Lys | p.N143K | Q14493 | protein_coding | deleterious(0) | possibly_damaging(0.72) | TCGA-BD-A3EP-01 | Liver | liver hepatocellular carcinoma | Female | >=65 | I/II | Unknown | Unknown | SD |
| SLBP | SNV | Missense_Mutation | novel | c.411N>C | p.Arg137Ser | p.R137S | Q14493 | protein_coding | deleterious(0) | possibly_damaging(0.88) | TCGA-CC-A8HV-01 | Liver | liver hepatocellular carcinoma | Female | <65 | I/II | Targeted Molecular therapy | sorafenib | PD |
| Page: 1 2 |
Top |
Related drugs of malignant transformation related genes |
| Identification of chemicals and drugs interact with genes involved in malignant transfromation |
| (DGIdb 4.0) |
| Entrez ID | Symbol | Category | Interaction Types | Drug Claim Name | Drug Name | PMIDs |
| Page: 1 |

Copyright 2023-Present -The University of Texas Health Science Center at Houston |