
|
|||||
|
 | |
| |
| |
| |
| |
| |
|
Gene: SLAMF7 |
Gene summary for SLAMF7 |
| Gene information | Species | Human | Gene symbol | SLAMF7 | Gene ID | 57823 |
| Gene name | SLAM family member 7 | |
| Gene Alias | 19A | |
| Cytomap | 1q23.3 | |
| Gene Type | protein-coding | GO ID | GO:0001775 | UniProtAcc | Q9NQ25 |
Top |
Malignant transformation analysis |
| Identification of the aberrant gene expression in precancerous and cancerous lesions by comparing the gene expression of stem-like cells in diseased tissues with normal stem cells |
| Entrez ID | Symbol | Replicates | Species | Organ | Tissue | Adj P-value | Log2FC | Malignancy |
| 57823 | SLAMF7 | HCC2 | Human | Liver | HCC | 1.75e-14 | 1.01e+00 | 0.5341 |
| 57823 | SLAMF7 | HCC5 | Human | Liver | HCC | 8.69e-27 | 2.05e+00 | 0.4932 |
| 57823 | SLAMF7 | GSM5353216_PA_PB1A_Pool_1_3_S50_L002 | Human | Prostate | Tumor | 1.29e-03 | 8.15e-01 | 0.159 |
| 57823 | SLAMF7 | GSM5353218_PA_PB1B_Pool_1_2_S74_L003 | Human | Prostate | Tumor | 1.06e-19 | 1.68e+00 | 0.1479 |
| 57823 | SLAMF7 | GSM5353220_PA_PB1B_Pool_3_S51_L002 | Human | Prostate | Tumor | 4.27e-16 | 1.48e+00 | 0.1531 |
| 57823 | SLAMF7 | GSM5353221_PA_PB2A_Pool_1_3_S25_L001 | Human | Prostate | Tumor | 6.02e-03 | 4.27e-01 | 0.1633 |
| 57823 | SLAMF7 | GSM5353225_PA_PR5196-1_Pool_1_2_3_S53_L002 | Human | Prostate | Tumor | 1.08e-02 | 5.40e-01 | 0.1619 |
| 57823 | SLAMF7 | GSM5353226_PA_PR5196-2_Pool_1_2_3_S54_L002 | Human | Prostate | Tumor | 1.68e-03 | 7.48e-01 | 0.159 |
| Page: 1 |
| Tissue | Expression Dynamics | Abbreviation |
| Liver | 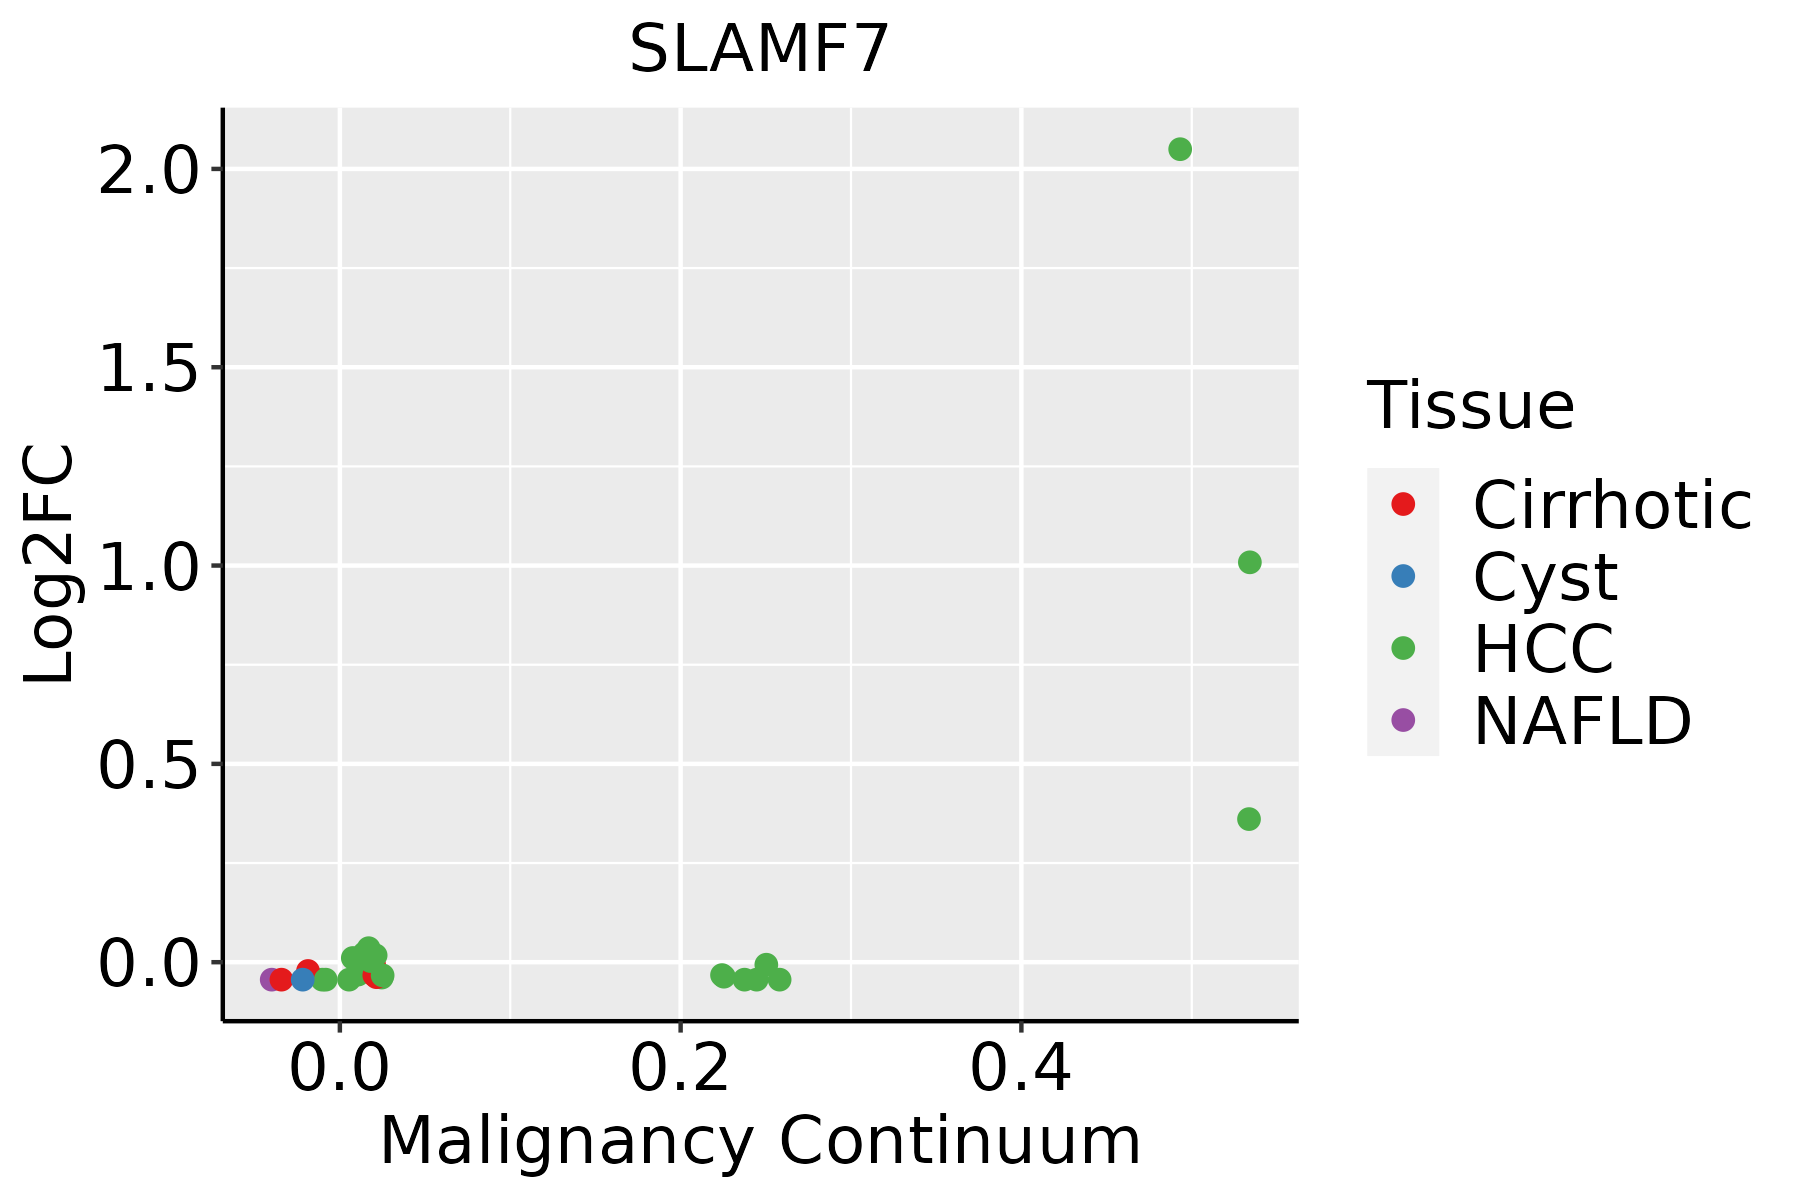 | HCC: Hepatocellular carcinoma |
| NAFLD: Non-alcoholic fatty liver disease | ||
| Prostate | 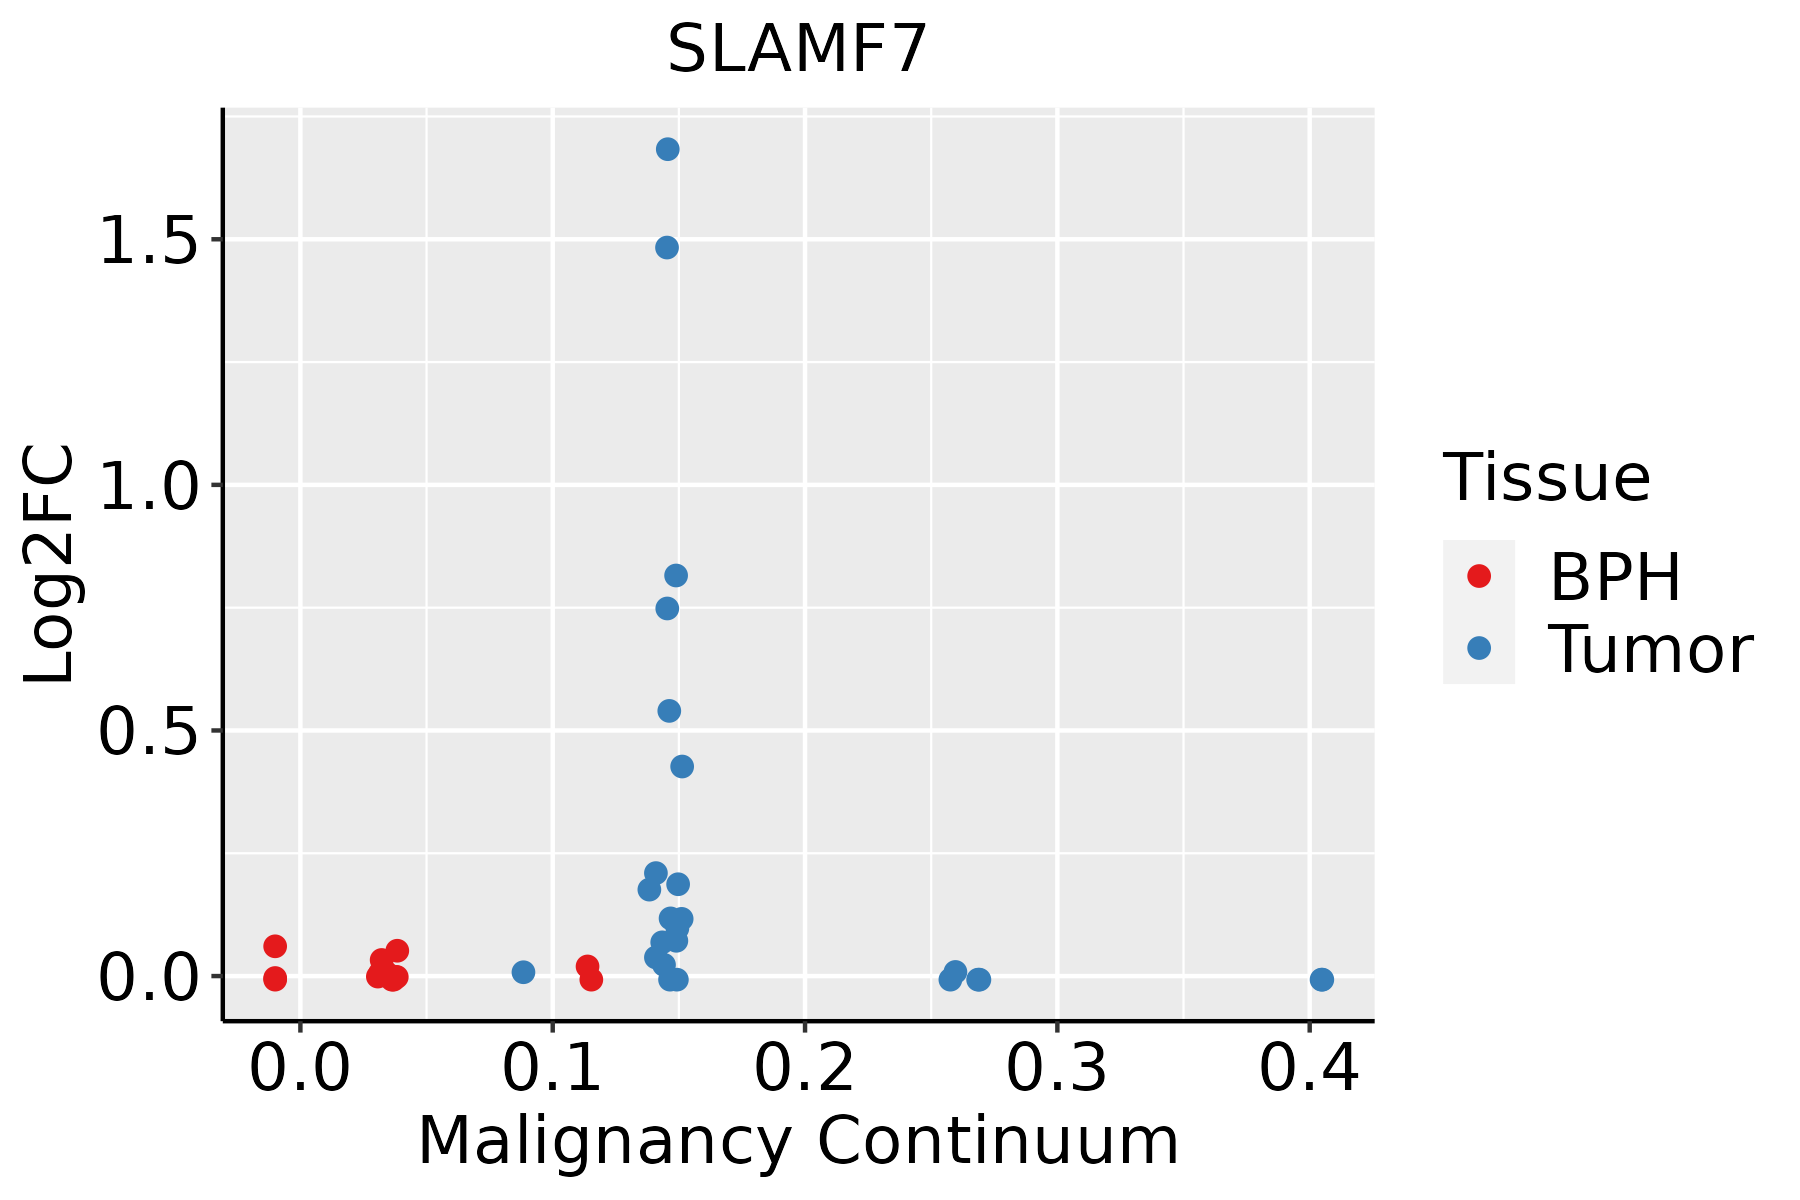 | BPH: Benign Prostatic Hyperplasia |
| ∗log2FC in expression of this searched gene in stem-like cells from each diseased tissue sample relative to stem-like cells in normal samples in each tissue plotted against the malignancy continuum. Samples are colored based on if they are from different disease stage. |
Top |
Malignant transformation related pathway analysis |
| Find out the enriched GO biological processes and KEGG pathways involved in transition from healthy to precancer to cancer |
| Tissue | Disease Stage | Enriched GO biological Processes |
| Colorectum | AD |  |
| Colorectum | SER |  |
| Colorectum | MSS |  |
| Colorectum | MSI-H |  |
| Colorectum | FAP |  |
| ∗Top 15 enriched GO BP terms are showed in the bar plot of each disease state in each tissue. Each row represents a significant GO biological process which is colored according to the -log10(p.adjust). |
| Page: 1 2 3 4 5 6 7 8 9 |
| GO ID | Tissue | Disease Stage | Description | Gene Ratio | Bg Ratio | pvalue | p.adjust | Count |
| GO:004211015 | Prostate | Tumor | T cell activation | 117/3246 | 487/18723 | 9.22e-05 | 9.05e-04 | 117 |
| Page: 1 |
| Pathway ID | Tissue | Disease Stage | Description | Gene Ratio | Bg Ratio | pvalue | p.adjust | qvalue | Count |
| Page: 1 |
Top |
Cell-cell communication analysis |
| Identification of potential cell-cell interactions between two cell types and their ligand-receptor pairs for different disease states |
| Ligand | Receptor | LRpair | Pathway | Tissue | Disease Stage |
| Page: 1 |
Top |
Single-cell gene regulatory network inference analysis |
| Find out the significant the regulons (TFs) and the target genes of each regulon across cell types for different disease states |
| TF | Cell Type | Tissue | Disease Stage | Target Gene | RSS | Regulon Activity |
| ∗The dot plots of a searched regulon are shown for all cell subpopulations in each disease state of each tissue based on the regulon specific score inferred using pySCENIC and by calculating the average expression. |
| Page: 1 |
Top |
Somatic mutation of malignant transformation related genes |
| Annotation of somatic variants for genes involved in malignant transformation |
| Hugo Symbol | Variant Class | Variant Classification | dbSNP RS | HGVSc | HGVSp | HGVSp Short | SWISSPROT | BIOTYPE | SIFT | PolyPhen | Tumor Sample Barcode | Tissue | Histology | Sex | Age | Stage | Therapy Types | Drugs | Outcome |
| SLAMF7 | SNV | Missense_Mutation | rs201003538 | c.109N>A | p.Val37Met | p.V37M | Q9NQ25 | protein_coding | deleterious(0) | probably_damaging(1) | TCGA-BH-A0HF-01 | Breast | breast invasive carcinoma | Female | >=65 | I/II | Hormone Therapy | arimidex | SD |
| SLAMF7 | SNV | Missense_Mutation | c.725N>C | p.Val242Ala | p.V242A | Q9NQ25 | protein_coding | tolerated(0.42) | benign(0) | TCGA-BH-A18N-01 | Breast | breast invasive carcinoma | Female | >=65 | I/II | Unknown | Unknown | SD | |
| SLAMF7 | SNV | Missense_Mutation | rs142395637 | c.759N>C | p.Glu253Asp | p.E253D | Q9NQ25 | protein_coding | tolerated(0.16) | benign(0.028) | TCGA-GM-A2D9-01 | Breast | breast invasive carcinoma | Female | >=65 | I/II | Hormone Therapy | arimidex | SD |
| SLAMF7 | insertion | Nonsense_Mutation | novel | c.283_284insATTCTTAACTGTTTTTTCACCTACAACCACATAATCAG | p.Leu95HisfsTer3 | p.L95Hfs*3 | Q9NQ25 | protein_coding | TCGA-A2-A0CP-01 | Breast | breast invasive carcinoma | Female | <65 | I/II | Chemotherapy | cytoxan | SD | ||
| SLAMF7 | insertion | Frame_Shift_Ins | novel | c.552_553insA | p.Arg185LysfsTer6 | p.R185Kfs*6 | Q9NQ25 | protein_coding | TCGA-A8-A08H-01 | Breast | breast invasive carcinoma | Female | >=65 | I/II | Unknown | Unknown | SD | ||
| SLAMF7 | insertion | Frame_Shift_Ins | novel | c.554_555insTTCTCTTTTCCAGATACGA | p.Arg185SerfsTer12 | p.R185Sfs*12 | Q9NQ25 | protein_coding | TCGA-A8-A08H-01 | Breast | breast invasive carcinoma | Female | >=65 | I/II | Unknown | Unknown | SD | ||
| SLAMF7 | SNV | Missense_Mutation | novel | c.901N>G | p.Asn301Asp | p.N301D | Q9NQ25 | protein_coding | deleterious(0.05) | possibly_damaging(0.78) | TCGA-EA-A3HS-01 | Cervix | cervical & endocervical cancer | Female | <65 | I/II | Unknown | Unknown | SD |
| SLAMF7 | SNV | Missense_Mutation | rs746119808 | c.739C>A | p.Leu247Ile | p.L247I | Q9NQ25 | protein_coding | tolerated(0.86) | benign(0.003) | TCGA-AA-3510-01 | Colorectum | colon adenocarcinoma | Male | >=65 | I/II | Unknown | Unknown | SD |
| SLAMF7 | SNV | Missense_Mutation | rs34099422 | c.805C>T | p.Arg269Trp | p.R269W | Q9NQ25 | protein_coding | deleterious(0) | possibly_damaging(0.522) | TCGA-AA-A00N-01 | Colorectum | colon adenocarcinoma | Male | >=65 | I/II | Unknown | Unknown | PD |
| SLAMF7 | SNV | Missense_Mutation | c.416N>A | p.Ser139Asn | p.S139N | Q9NQ25 | protein_coding | tolerated(0.96) | benign(0.096) | TCGA-AA-A010-01 | Colorectum | colon adenocarcinoma | Female | <65 | I/II | Chemotherapy | folinic | CR |
| Page: 1 2 3 4 5 6 |
Top |
Related drugs of malignant transformation related genes |
| Identification of chemicals and drugs interact with genes involved in malignant transfromation |
| (DGIdb 4.0) |
| Entrez ID | Symbol | Category | Interaction Types | Drug Claim Name | Drug Name | PMIDs |
| 57823 | SLAMF7 | EXTERNAL SIDE OF PLASMA MEMBRANE, DRUGGABLE GENOME | inhibitor | CHEMBL1743010 | ELOTUZUMAB | |
| 57823 | SLAMF7 | EXTERNAL SIDE OF PLASMA MEMBRANE, DRUGGABLE GENOME | antibody | ELOTUZUMAB | ELOTUZUMAB | |
| 57823 | SLAMF7 | EXTERNAL SIDE OF PLASMA MEMBRANE, DRUGGABLE GENOME | ELOTUZUMAB | ELOTUZUMAB | ||
| 57823 | SLAMF7 | EXTERNAL SIDE OF PLASMA MEMBRANE, DRUGGABLE GENOME | antibody | 252166573 | ELOTUZUMAB |
| Page: 1 |

Copyright 2023-Present -The University of Texas Health Science Center at Houston |