
|
|||||
|
 | |
| |
| |
| |
| |
| |
|
Gene: SKP1 |
Gene summary for SKP1 |
| Gene information | Species | Human | Gene symbol | SKP1 | Gene ID | 6500 |
| Gene name | S-phase kinase associated protein 1 | |
| Gene Alias | EMC19 | |
| Cytomap | 5q31.1 | |
| Gene Type | protein-coding | GO ID | GO:0000209 | UniProtAcc | P63208 |
Top |
Malignant transformation analysis |
| Identification of the aberrant gene expression in precancerous and cancerous lesions by comparing the gene expression of stem-like cells in diseased tissues with normal stem cells |
| Entrez ID | Symbol | Replicates | Species | Organ | Tissue | Adj P-value | Log2FC | Malignancy |
| 6500 | SKP1 | GSM4909286 | Human | Breast | IDC | 2.73e-07 | -1.34e-01 | 0.1081 |
| 6500 | SKP1 | GSM4909288 | Human | Breast | IDC | 4.46e-02 | -2.51e-03 | 0.0988 |
| 6500 | SKP1 | GSM4909293 | Human | Breast | IDC | 5.41e-12 | 3.17e-01 | 0.1581 |
| 6500 | SKP1 | GSM4909294 | Human | Breast | IDC | 1.52e-36 | 3.43e-01 | 0.2022 |
| 6500 | SKP1 | GSM4909296 | Human | Breast | IDC | 2.02e-13 | -9.03e-02 | 0.1524 |
| 6500 | SKP1 | GSM4909297 | Human | Breast | IDC | 9.41e-37 | 5.68e-02 | 0.1517 |
| 6500 | SKP1 | GSM4909298 | Human | Breast | IDC | 4.21e-05 | 2.60e-01 | 0.1551 |
| 6500 | SKP1 | GSM4909299 | Human | Breast | IDC | 3.98e-05 | 2.14e-01 | 0.035 |
| 6500 | SKP1 | GSM4909300 | Human | Breast | IDC | 9.16e-03 | 2.58e-01 | 0.0334 |
| 6500 | SKP1 | GSM4909302 | Human | Breast | IDC | 2.07e-04 | -2.79e-01 | 0.1545 |
| 6500 | SKP1 | GSM4909305 | Human | Breast | IDC | 3.07e-07 | 3.01e-01 | 0.0436 |
| 6500 | SKP1 | GSM4909306 | Human | Breast | IDC | 6.40e-12 | 2.94e-01 | 0.1564 |
| 6500 | SKP1 | GSM4909307 | Human | Breast | IDC | 2.06e-15 | 2.92e-01 | 0.1569 |
| 6500 | SKP1 | GSM4909308 | Human | Breast | IDC | 1.01e-37 | 4.82e-01 | 0.158 |
| 6500 | SKP1 | GSM4909309 | Human | Breast | IDC | 1.64e-17 | 1.82e-01 | 0.0483 |
| 6500 | SKP1 | GSM4909311 | Human | Breast | IDC | 1.94e-65 | -5.43e-01 | 0.1534 |
| 6500 | SKP1 | GSM4909312 | Human | Breast | IDC | 2.97e-13 | -1.48e-01 | 0.1552 |
| 6500 | SKP1 | GSM4909313 | Human | Breast | IDC | 1.38e-06 | 9.38e-02 | 0.0391 |
| 6500 | SKP1 | GSM4909315 | Human | Breast | IDC | 2.12e-23 | 2.77e-01 | 0.21 |
| 6500 | SKP1 | GSM4909316 | Human | Breast | IDC | 1.29e-16 | 2.57e-01 | 0.21 |
| Page: 1 2 3 4 5 6 7 8 9 10 11 12 13 14 15 |
| Tissue | Expression Dynamics | Abbreviation |
| Breast | 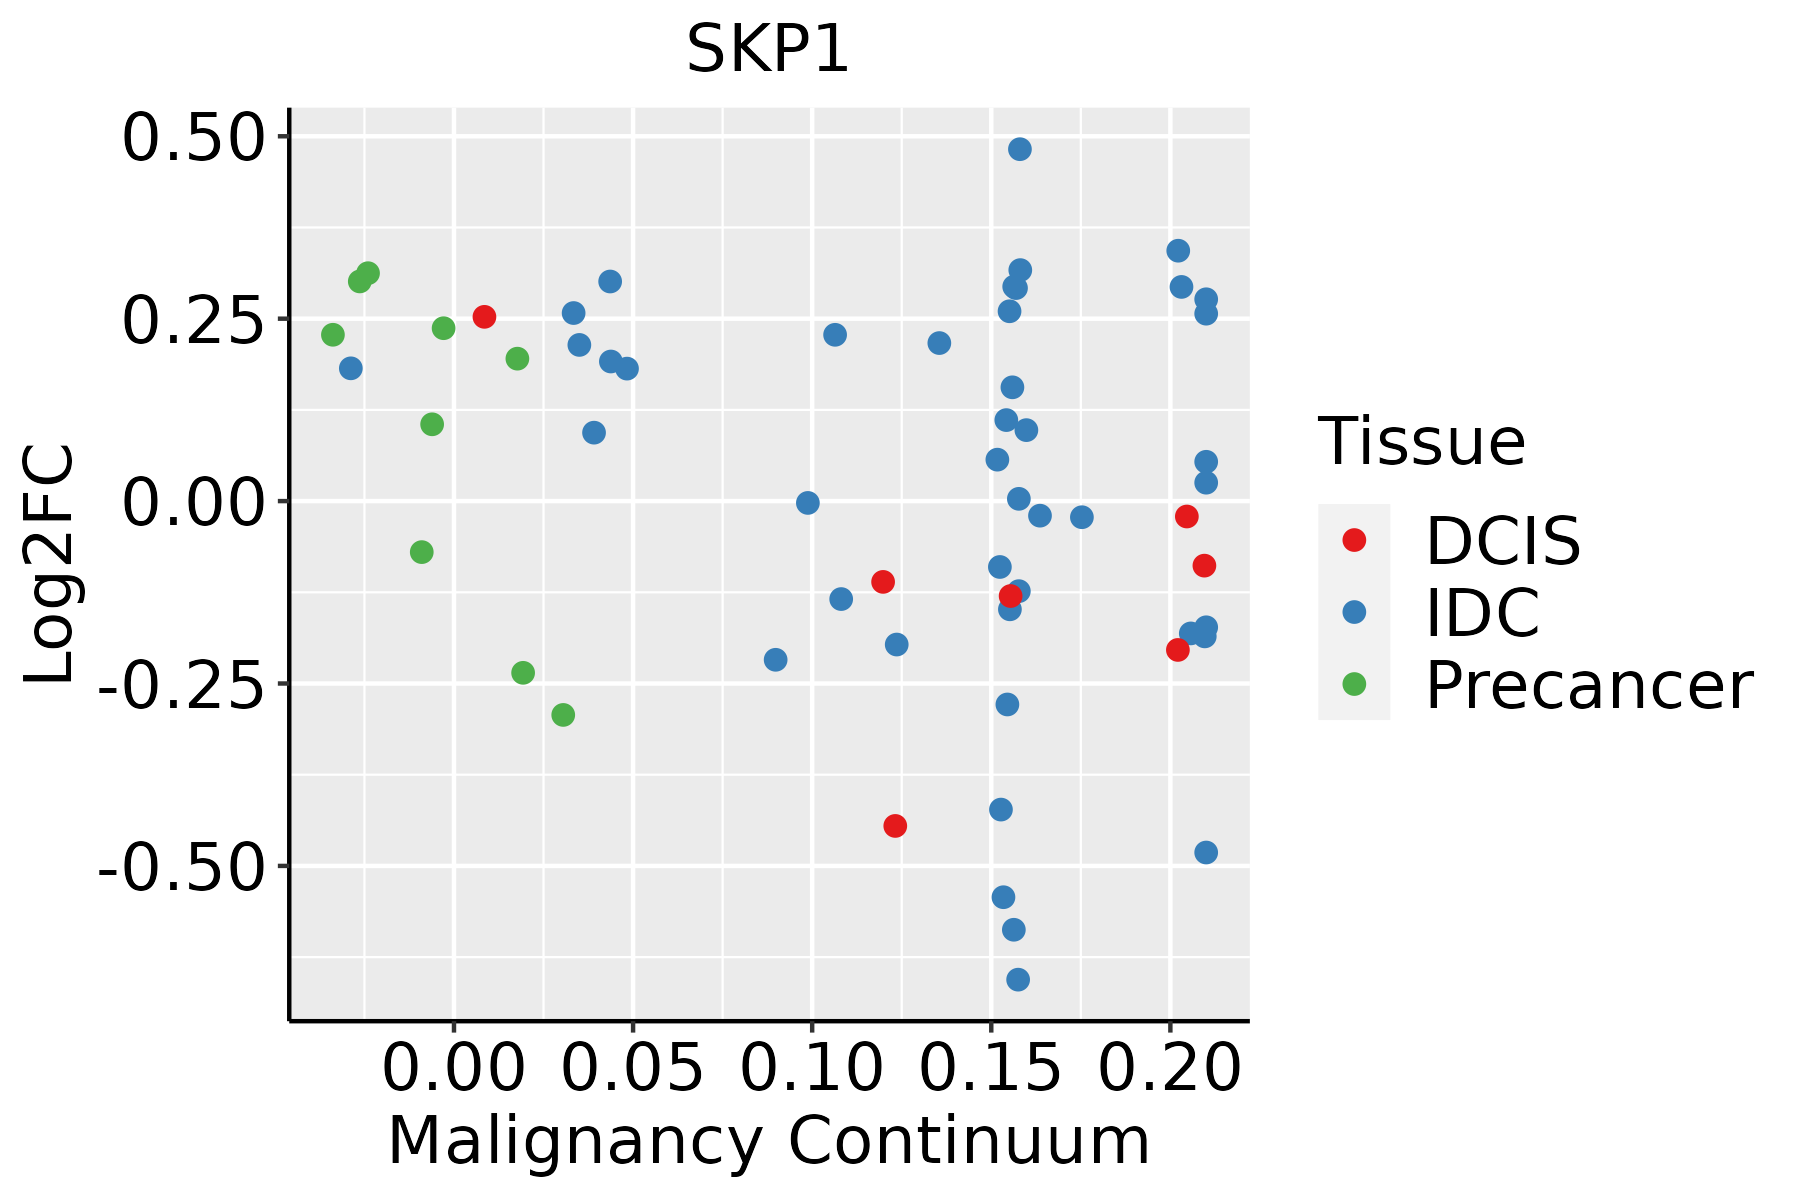 | IDC: Invasive ductal carcinoma |
| DCIS: Ductal carcinoma in situ | ||
| Precancer(BRCA1-mut): Precancerous lesion from BRCA1 mutation carriers | ||
| Cervix | 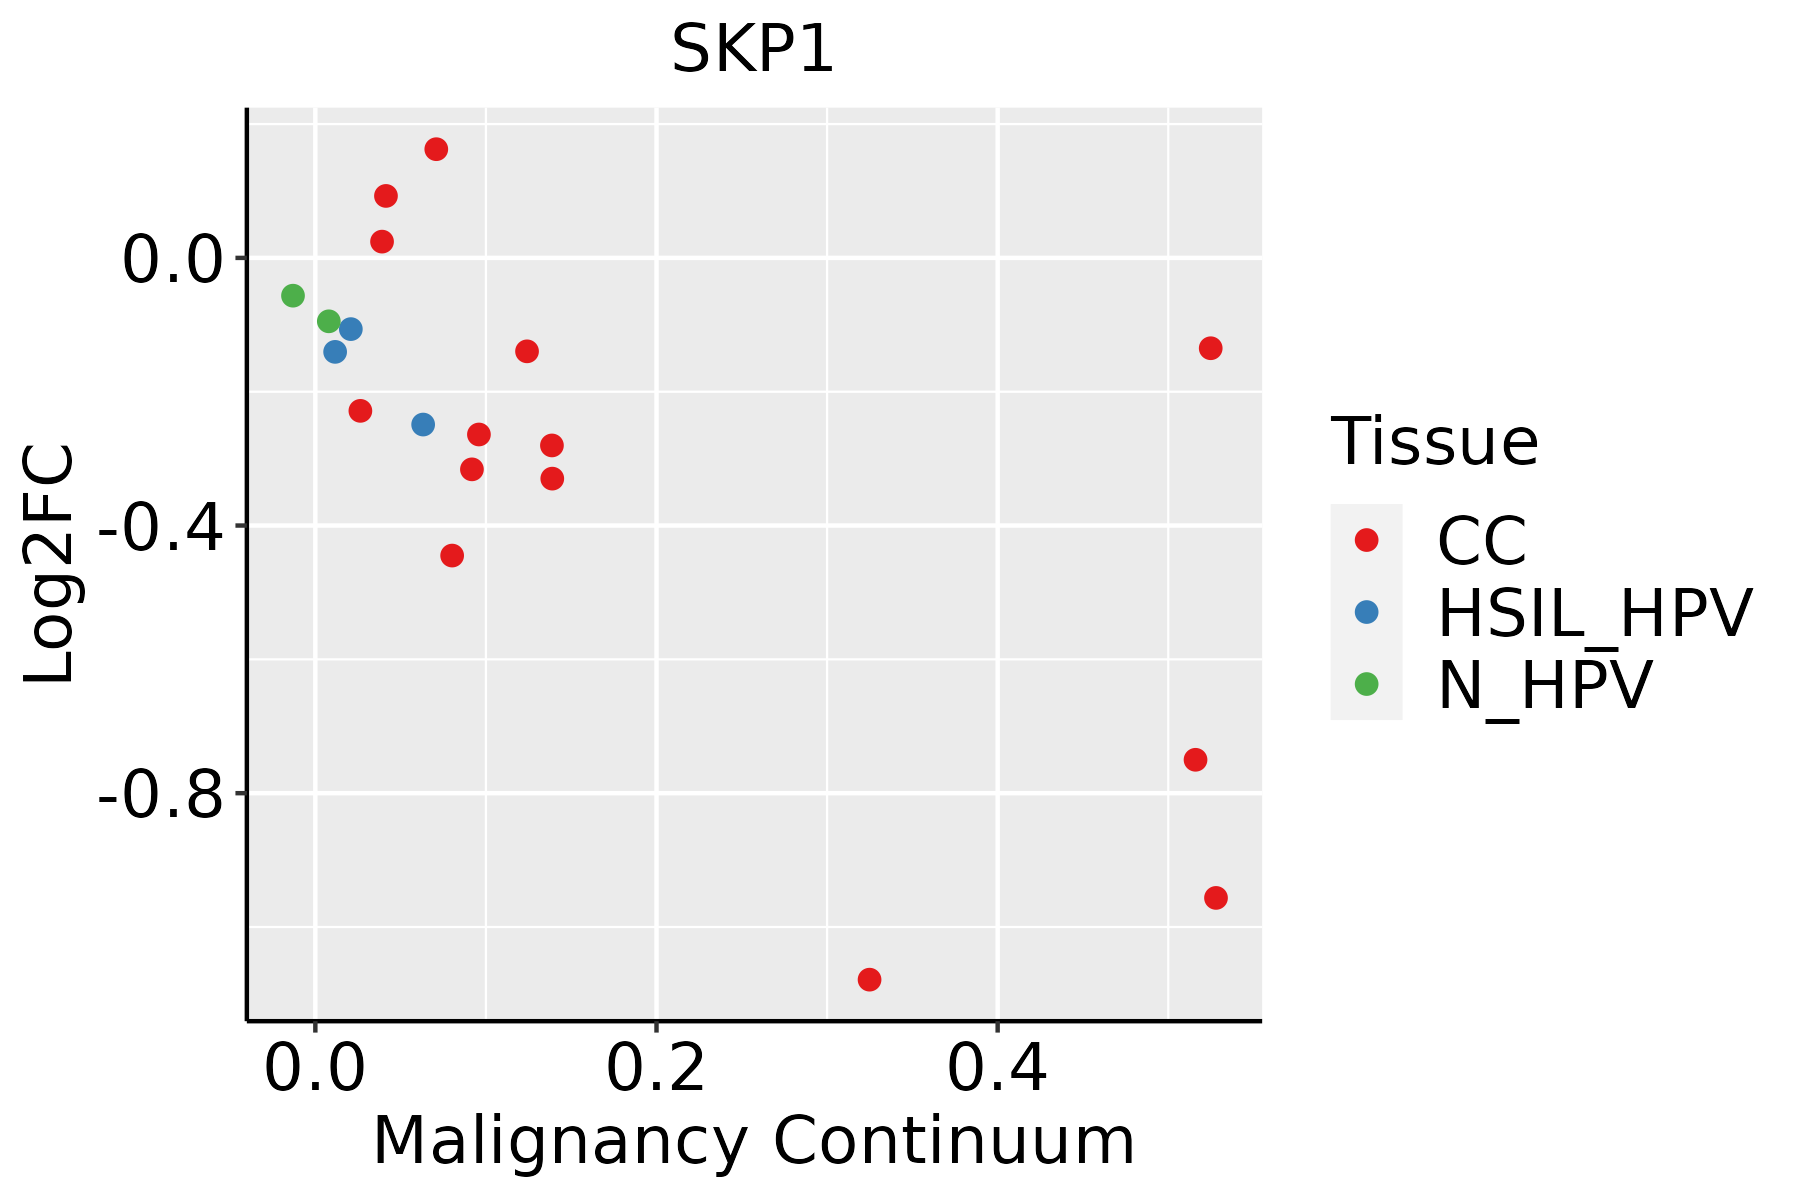 | CC: Cervix cancer |
| HSIL_HPV: HPV-infected high-grade squamous intraepithelial lesions | ||
| N_HPV: HPV-infected normal cervix | ||
| Colorectum (GSE201348) |  | FAP: Familial adenomatous polyposis |
| CRC: Colorectal cancer | ||
| Colorectum (HTA11) |  | AD: Adenomas |
| SER: Sessile serrated lesions | ||
| MSI-H: Microsatellite-high colorectal cancer | ||
| MSS: Microsatellite stable colorectal cancer | ||
| Endometrium | 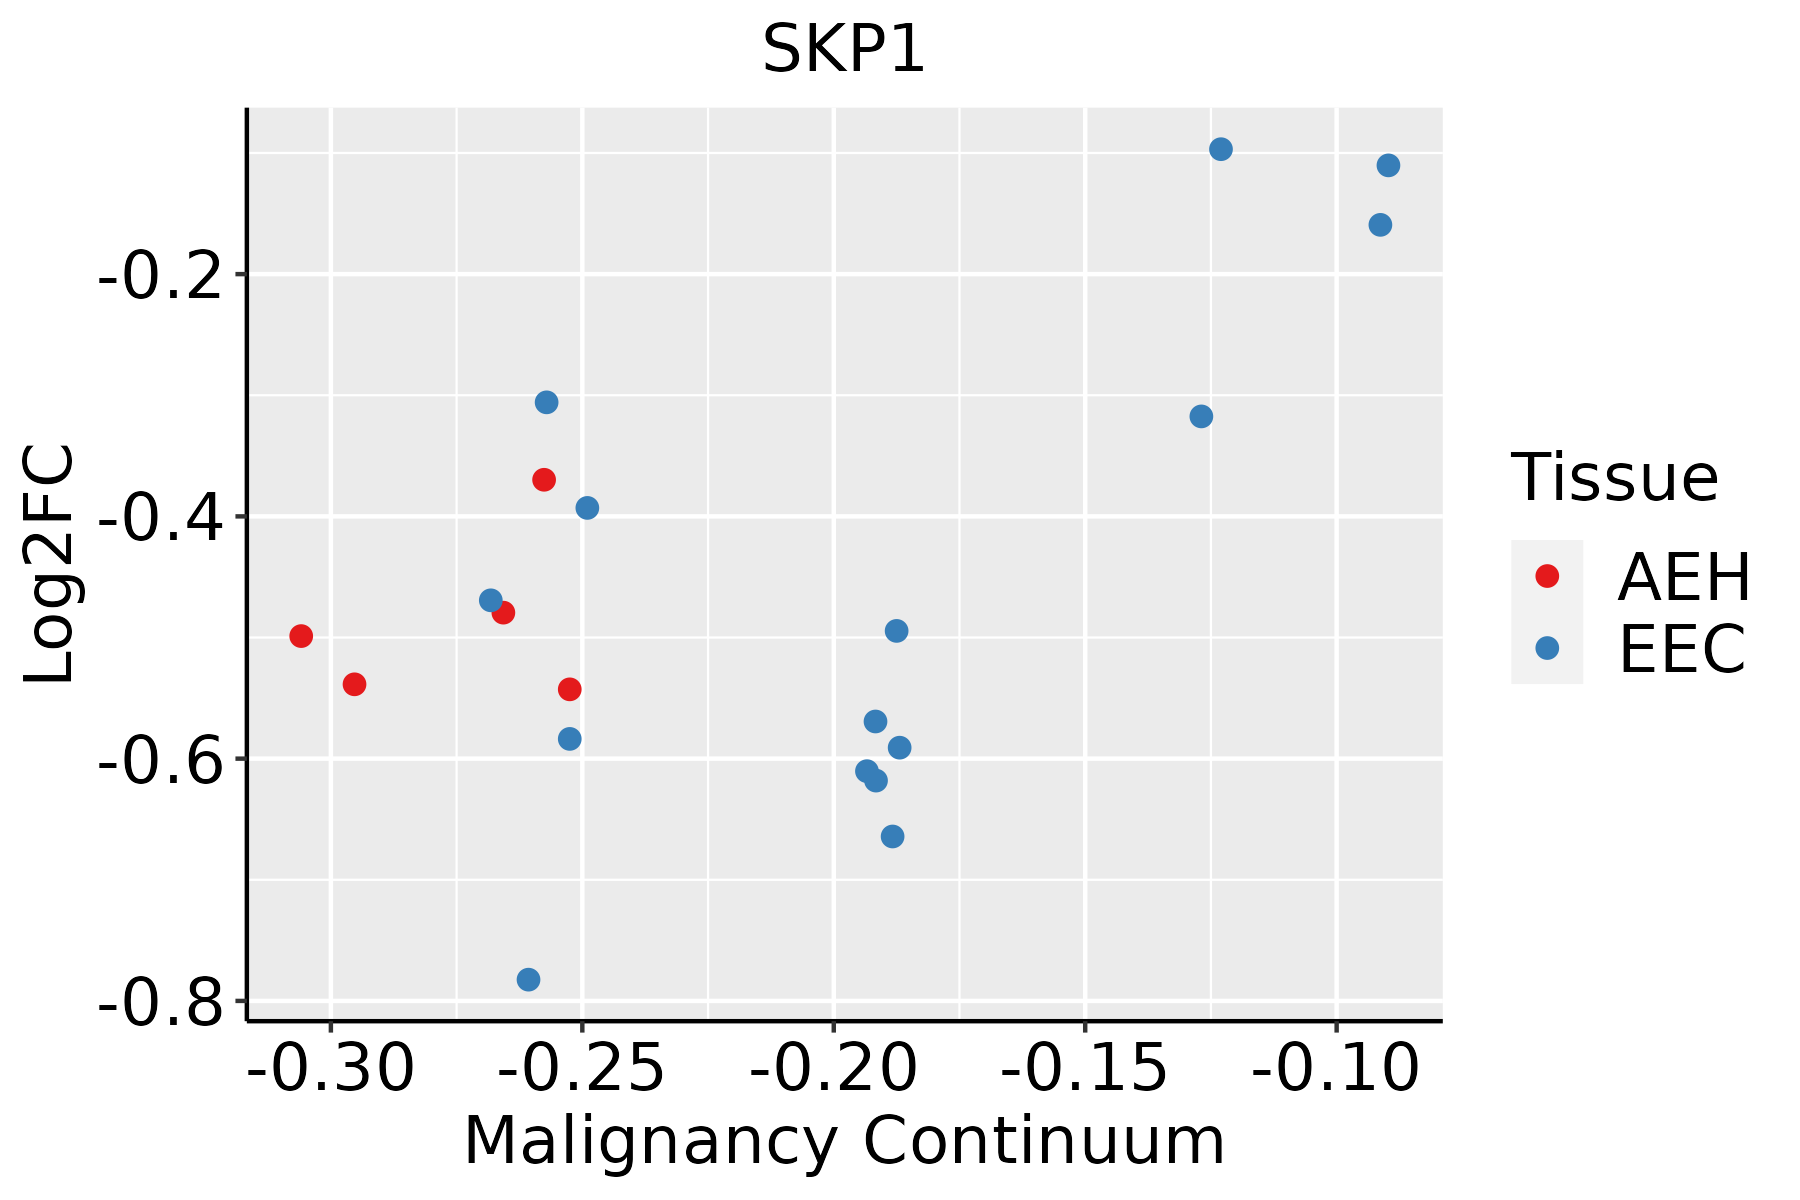 | AEH: Atypical endometrial hyperplasia |
| EEC: Endometrioid Cancer | ||
| Esophagus |  | ESCC: Esophageal squamous cell carcinoma |
| HGIN: High-grade intraepithelial neoplasias | ||
| LGIN: Low-grade intraepithelial neoplasias | ||
| Liver |  | HCC: Hepatocellular carcinoma |
| NAFLD: Non-alcoholic fatty liver disease | ||
| Oral Cavity |  | EOLP: Erosive Oral lichen planus |
| LP: leukoplakia | ||
| NEOLP: Non-erosive oral lichen planus | ||
| OSCC: Oral squamous cell carcinoma | ||
| Prostate | 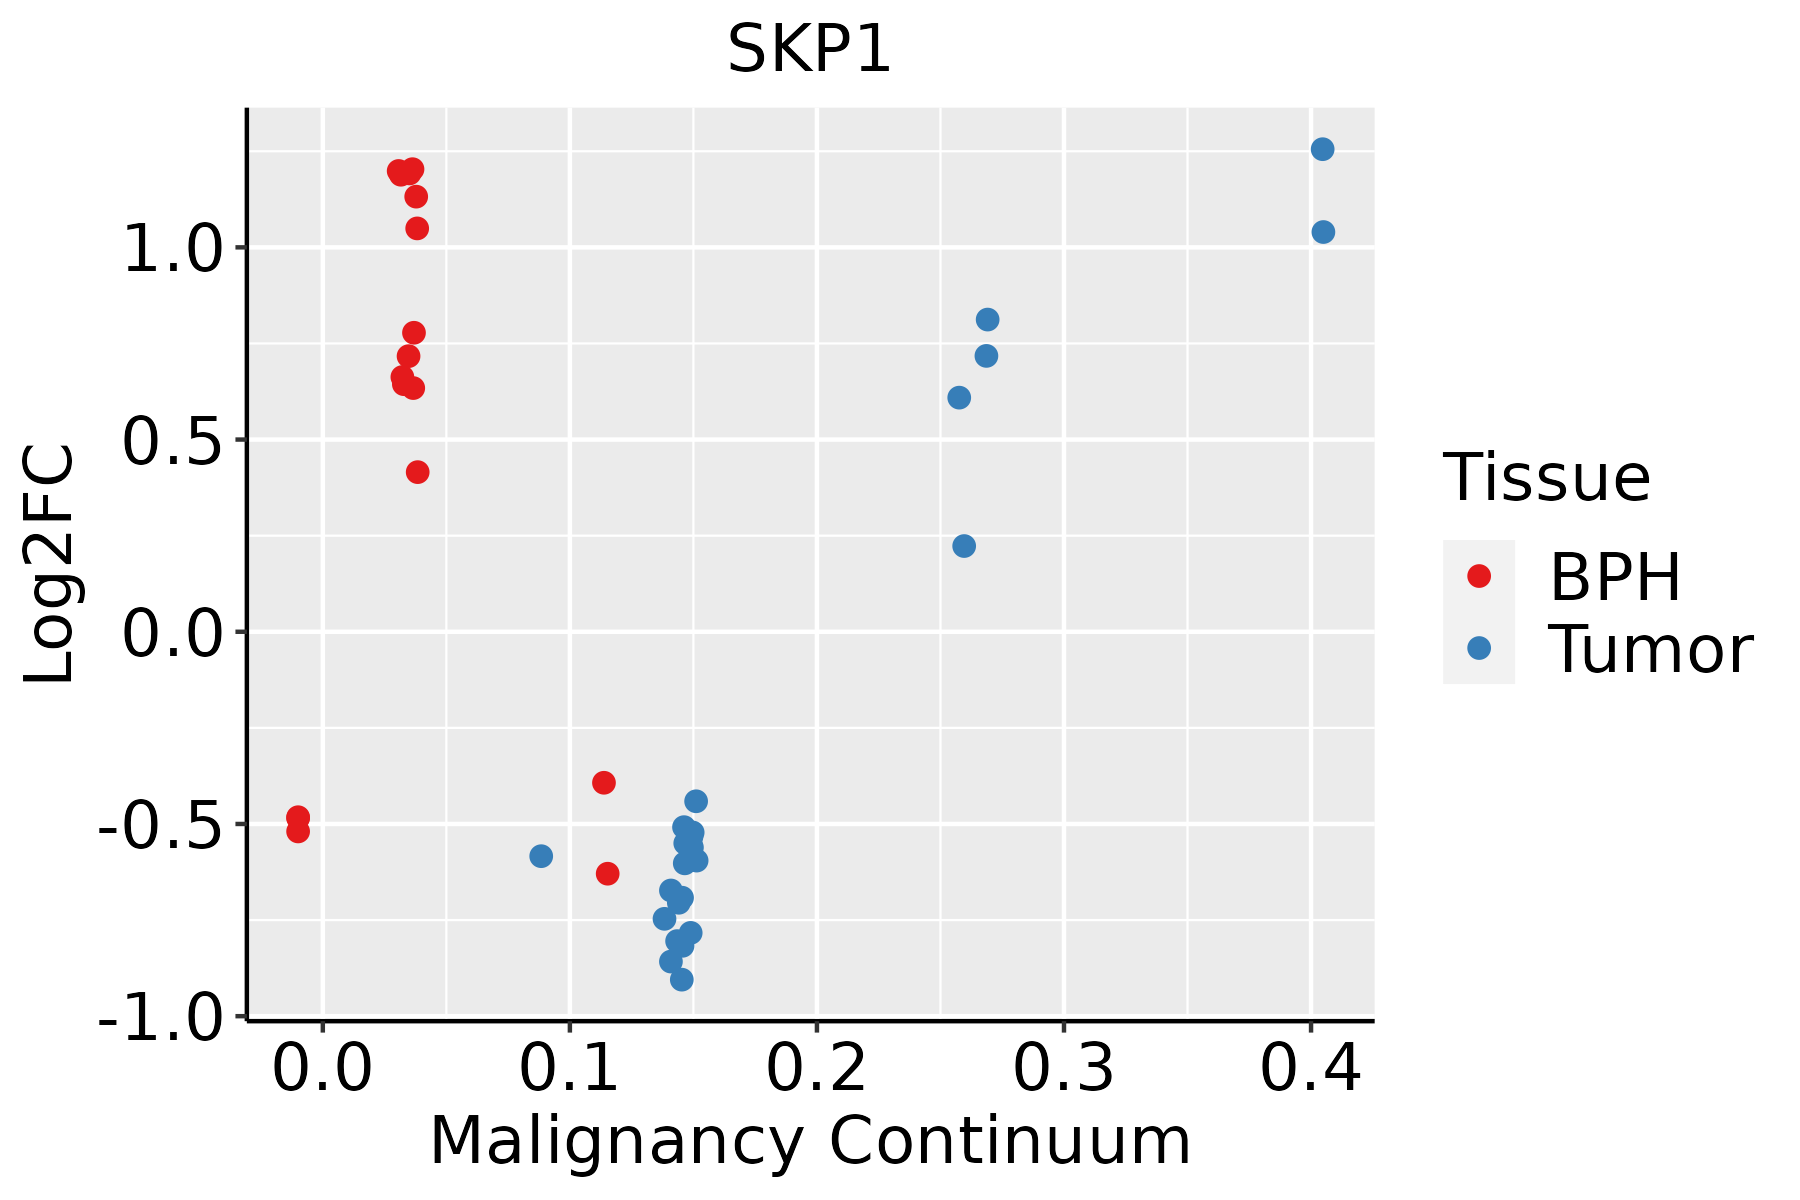 | BPH: Benign Prostatic Hyperplasia |
| Skin |  | AK: Actinic keratosis |
| cSCC: Cutaneous squamous cell carcinoma | ||
| SCCIS:squamous cell carcinoma in situ | ||
| Thyroid | 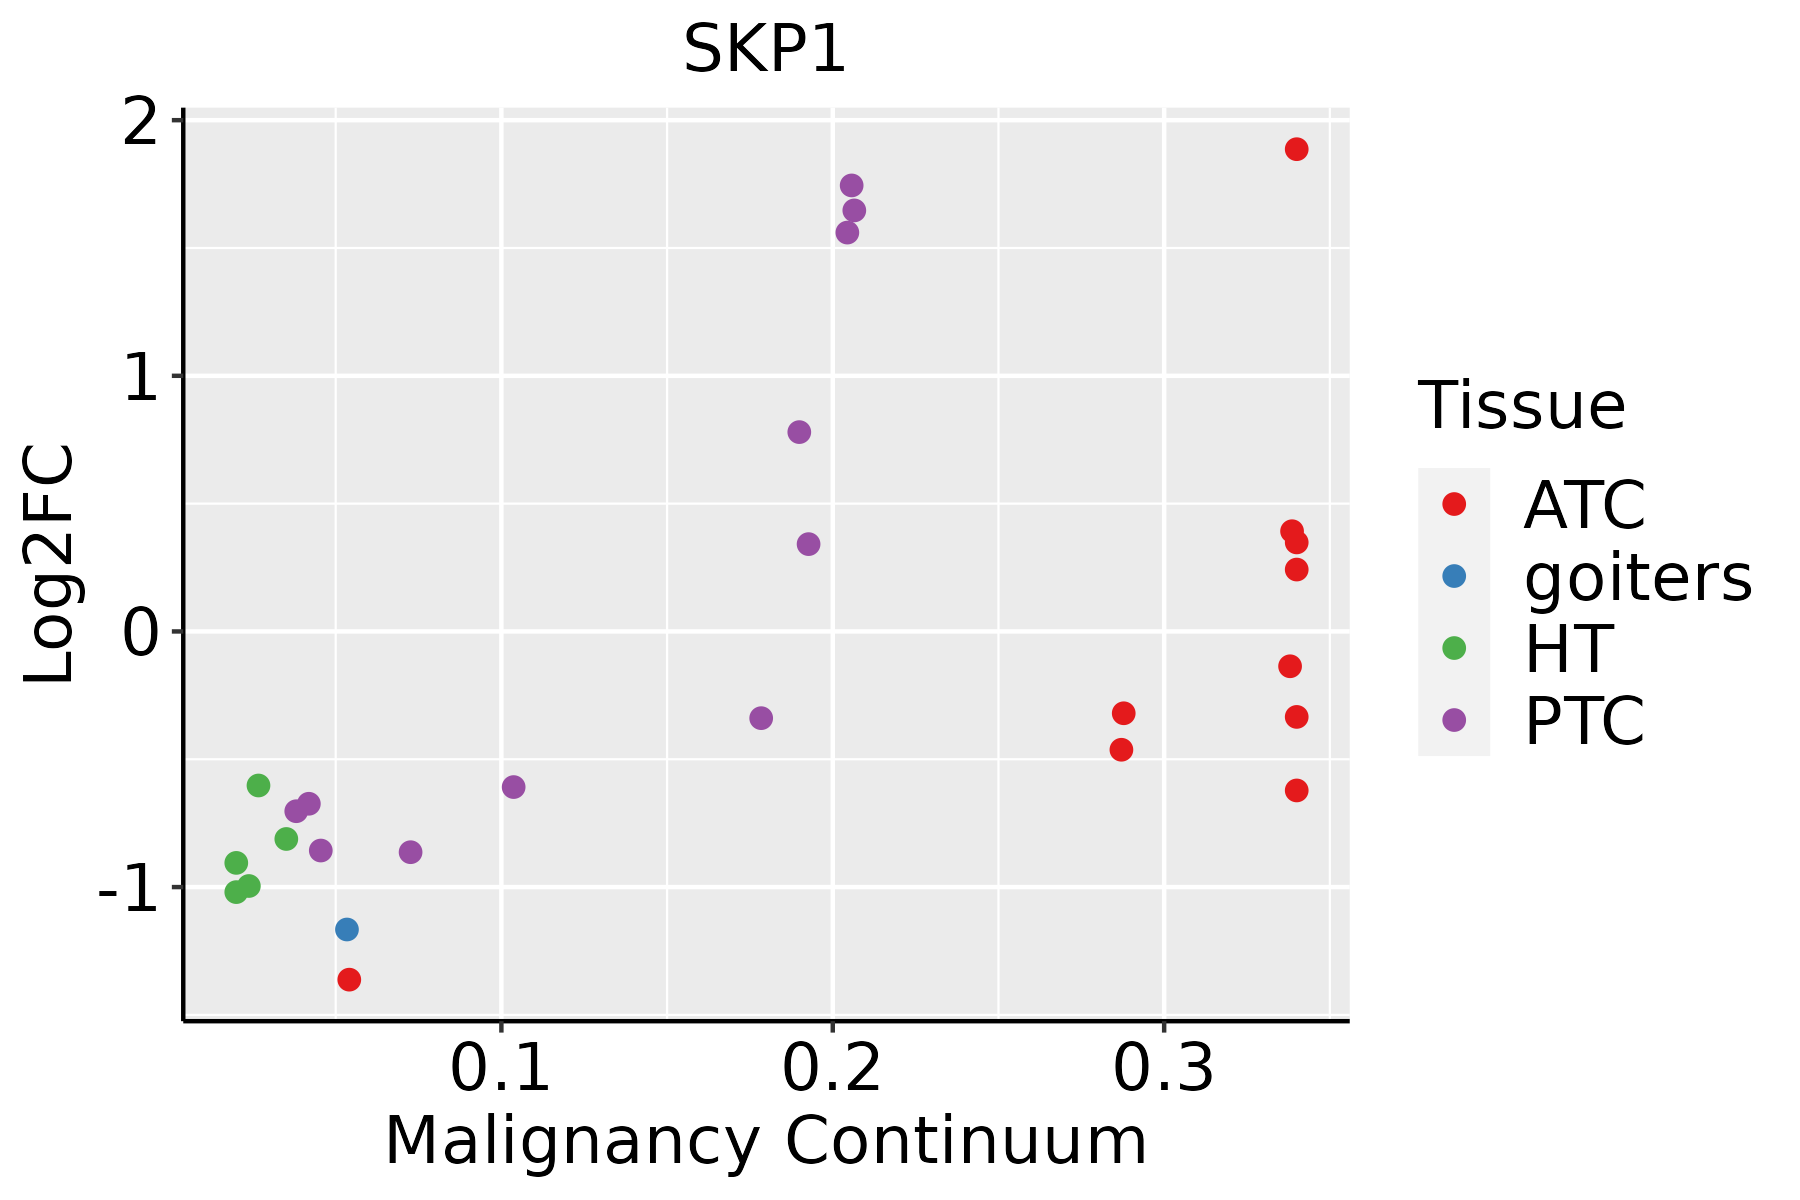 | ATC: Anaplastic thyroid cancer |
| HT: Hashimoto's thyroiditis | ||
| PTC: Papillary thyroid cancer |
| ∗log2FC in expression of this searched gene in stem-like cells from each diseased tissue sample relative to stem-like cells in normal samples in each tissue plotted against the malignancy continuum. Samples are colored based on if they are from different disease stage. |
Top |
Malignant transformation related pathway analysis |
| Find out the enriched GO biological processes and KEGG pathways involved in transition from healthy to precancer to cancer |
| Tissue | Disease Stage | Enriched GO biological Processes |
| Colorectum | AD |  |
| Colorectum | SER |  |
| Colorectum | MSS |  |
| Colorectum | MSI-H |  |
| Colorectum | FAP |  |
| ∗Top 15 enriched GO BP terms are showed in the bar plot of each disease state in each tissue. Each row represents a significant GO biological process which is colored according to the -log10(p.adjust). |
| Page: 1 2 3 4 5 6 7 8 9 |
| GO ID | Tissue | Disease Stage | Description | Gene Ratio | Bg Ratio | pvalue | p.adjust | Count |
| GO:19033209 | Breast | Precancer | regulation of protein modification by small protein conjugation or removal | 38/1080 | 242/18723 | 1.71e-08 | 1.17e-06 | 38 |
| GO:00313969 | Breast | Precancer | regulation of protein ubiquitination | 33/1080 | 210/18723 | 1.45e-07 | 7.82e-06 | 33 |
| GO:00104989 | Breast | Precancer | proteasomal protein catabolic process | 58/1080 | 490/18723 | 1.54e-07 | 8.05e-06 | 58 |
| GO:00451859 | Breast | Precancer | maintenance of protein location | 19/1080 | 94/18723 | 1.43e-06 | 5.35e-05 | 19 |
| GO:00512358 | Breast | Precancer | maintenance of location | 40/1080 | 327/18723 | 5.85e-06 | 1.71e-04 | 40 |
| GO:00516519 | Breast | Precancer | maintenance of location in cell | 30/1080 | 214/18723 | 5.91e-06 | 1.71e-04 | 30 |
| GO:00325076 | Breast | Precancer | maintenance of protein location in cell | 14/1080 | 65/18723 | 1.59e-05 | 3.89e-04 | 14 |
| GO:00725954 | Breast | Precancer | maintenance of protein localization in organelle | 10/1080 | 42/18723 | 1.06e-04 | 1.93e-03 | 10 |
| GO:19046668 | Breast | Precancer | regulation of ubiquitin protein ligase activity | 7/1080 | 23/18723 | 2.26e-04 | 3.42e-03 | 7 |
| GO:00431619 | Breast | Precancer | proteasome-mediated ubiquitin-dependent protein catabolic process | 42/1080 | 412/18723 | 2.49e-04 | 3.72e-03 | 42 |
| GO:00514386 | Breast | Precancer | regulation of ubiquitin-protein transferase activity | 10/1080 | 53/18723 | 7.88e-04 | 9.29e-03 | 10 |
| GO:001049814 | Breast | IDC | proteasomal protein catabolic process | 75/1434 | 490/18723 | 5.59e-09 | 4.41e-07 | 75 |
| GO:190332014 | Breast | IDC | regulation of protein modification by small protein conjugation or removal | 43/1434 | 242/18723 | 1.71e-07 | 9.16e-06 | 43 |
| GO:003139614 | Breast | IDC | regulation of protein ubiquitination | 37/1434 | 210/18723 | 1.50e-06 | 6.36e-05 | 37 |
| GO:005165114 | Breast | IDC | maintenance of location in cell | 37/1434 | 214/18723 | 2.39e-06 | 9.35e-05 | 37 |
| GO:004518514 | Breast | IDC | maintenance of protein location | 21/1434 | 94/18723 | 6.69e-06 | 2.05e-04 | 21 |
| GO:004316114 | Breast | IDC | proteasome-mediated ubiquitin-dependent protein catabolic process | 57/1434 | 412/18723 | 9.55e-06 | 2.68e-04 | 57 |
| GO:005123513 | Breast | IDC | maintenance of location | 48/1434 | 327/18723 | 9.90e-06 | 2.77e-04 | 48 |
| GO:003250714 | Breast | IDC | maintenance of protein location in cell | 16/1434 | 65/18723 | 2.29e-05 | 5.51e-04 | 16 |
| GO:007259512 | Breast | IDC | maintenance of protein localization in organelle | 12/1434 | 42/18723 | 4.94e-05 | 1.08e-03 | 12 |
| Page: 1 2 3 4 5 6 7 8 9 10 11 12 13 14 15 16 17 18 19 20 21 22 23 24 25 |
| Pathway ID | Tissue | Disease Stage | Description | Gene Ratio | Bg Ratio | pvalue | p.adjust | qvalue | Count |
| hsa0513218 | Breast | Precancer | Salmonella infection | 49/684 | 249/8465 | 2.92e-09 | 6.15e-08 | 4.71e-08 | 49 |
| hsa0513118 | Breast | Precancer | Shigellosis | 44/684 | 247/8465 | 3.91e-07 | 6.86e-06 | 5.26e-06 | 44 |
| hsa0414118 | Breast | Precancer | Protein processing in endoplasmic reticulum | 33/684 | 174/8465 | 2.78e-06 | 3.83e-05 | 2.94e-05 | 33 |
| hsa0513219 | Breast | Precancer | Salmonella infection | 49/684 | 249/8465 | 2.92e-09 | 6.15e-08 | 4.71e-08 | 49 |
| hsa0513119 | Breast | Precancer | Shigellosis | 44/684 | 247/8465 | 3.91e-07 | 6.86e-06 | 5.26e-06 | 44 |
| hsa0414119 | Breast | Precancer | Protein processing in endoplasmic reticulum | 33/684 | 174/8465 | 2.78e-06 | 3.83e-05 | 2.94e-05 | 33 |
| hsa0513224 | Breast | IDC | Salmonella infection | 55/867 | 249/8465 | 2.07e-08 | 4.49e-07 | 3.36e-07 | 55 |
| hsa0513124 | Breast | IDC | Shigellosis | 47/867 | 247/8465 | 1.78e-05 | 2.00e-04 | 1.49e-04 | 47 |
| hsa0414124 | Breast | IDC | Protein processing in endoplasmic reticulum | 36/867 | 174/8465 | 2.73e-05 | 2.86e-04 | 2.14e-04 | 36 |
| hsa0517014 | Breast | IDC | Human immunodeficiency virus 1 infection | 33/867 | 212/8465 | 9.28e-03 | 4.37e-02 | 3.27e-02 | 33 |
| hsa0513234 | Breast | IDC | Salmonella infection | 55/867 | 249/8465 | 2.07e-08 | 4.49e-07 | 3.36e-07 | 55 |
| hsa0513134 | Breast | IDC | Shigellosis | 47/867 | 247/8465 | 1.78e-05 | 2.00e-04 | 1.49e-04 | 47 |
| hsa0414134 | Breast | IDC | Protein processing in endoplasmic reticulum | 36/867 | 174/8465 | 2.73e-05 | 2.86e-04 | 2.14e-04 | 36 |
| hsa0517015 | Breast | IDC | Human immunodeficiency virus 1 infection | 33/867 | 212/8465 | 9.28e-03 | 4.37e-02 | 3.27e-02 | 33 |
| hsa0513243 | Breast | DCIS | Salmonella infection | 55/846 | 249/8465 | 8.71e-09 | 1.87e-07 | 1.38e-07 | 55 |
| hsa0414143 | Breast | DCIS | Protein processing in endoplasmic reticulum | 36/846 | 174/8465 | 1.60e-05 | 1.91e-04 | 1.41e-04 | 36 |
| hsa0513144 | Breast | DCIS | Shigellosis | 46/846 | 247/8465 | 2.06e-05 | 2.38e-04 | 1.75e-04 | 46 |
| hsa0517024 | Breast | DCIS | Human immunodeficiency virus 1 infection | 33/846 | 212/8465 | 6.49e-03 | 3.22e-02 | 2.37e-02 | 33 |
| hsa0513253 | Breast | DCIS | Salmonella infection | 55/846 | 249/8465 | 8.71e-09 | 1.87e-07 | 1.38e-07 | 55 |
| hsa0414153 | Breast | DCIS | Protein processing in endoplasmic reticulum | 36/846 | 174/8465 | 1.60e-05 | 1.91e-04 | 1.41e-04 | 36 |
| Page: 1 2 3 4 5 6 7 8 9 10 11 12 13 14 15 |
Top |
Cell-cell communication analysis |
| Identification of potential cell-cell interactions between two cell types and their ligand-receptor pairs for different disease states |
| Ligand | Receptor | LRpair | Pathway | Tissue | Disease Stage |
| Page: 1 |
Top |
Single-cell gene regulatory network inference analysis |
| Find out the significant the regulons (TFs) and the target genes of each regulon across cell types for different disease states |
| TF | Cell Type | Tissue | Disease Stage | Target Gene | RSS | Regulon Activity |
| ∗The dot plots of a searched regulon are shown for all cell subpopulations in each disease state of each tissue based on the regulon specific score inferred using pySCENIC and by calculating the average expression. |
| Page: 1 |
Top |
Somatic mutation of malignant transformation related genes |
| Annotation of somatic variants for genes involved in malignant transformation |
| Hugo Symbol | Variant Class | Variant Classification | dbSNP RS | HGVSc | HGVSp | HGVSp Short | SWISSPROT | BIOTYPE | SIFT | PolyPhen | Tumor Sample Barcode | Tissue | Histology | Sex | Age | Stage | Therapy Types | Drugs | Outcome |
| SKP1 | SNV | Missense_Mutation | novel | c.228G>C | p.Glu76Asp | p.E76D | P63208 | protein_coding | tolerated(0.54) | benign(0.005) | TCGA-AN-A0XW-01 | Breast | breast invasive carcinoma | Female | <65 | III/IV | Unknown | Unknown | SD |
| SKP1 | SNV | Missense_Mutation | novel | c.411N>T | p.Lys137Asn | p.K137N | P63208 | protein_coding | deleterious(0.04) | benign(0.158) | TCGA-AA-3877-01 | Colorectum | colon adenocarcinoma | Female | >=65 | I/II | Unknown | Unknown | SD |
| SKP1 | SNV | Missense_Mutation | novel | c.407G>C | p.Arg136Pro | p.R136P | P63208 | protein_coding | deleterious(0.01) | benign(0.012) | TCGA-AM-5820-01 | Colorectum | colon adenocarcinoma | Female | <65 | I/II | Unknown | Unknown | SD |
| SKP1 | SNV | Missense_Mutation | novel | c.406N>T | p.Arg136Cys | p.R136C | P63208 | protein_coding | deleterious(0.04) | benign(0.011) | TCGA-CA-6717-01 | Colorectum | colon adenocarcinoma | Male | <65 | I/II | Chemotherapy | oxaliplatin | CR |
| SKP1 | SNV | Missense_Mutation | novel | c.382N>C | p.Lys128Gln | p.K128Q | P63208 | protein_coding | deleterious(0) | possibly_damaging(0.656) | TCGA-D1-A1O8-01 | Endometrium | uterine corpus endometrioid carcinoma | Female | >=65 | III/IV | Unknown | Unknown | SD |
| SKP1 | insertion | Frame_Shift_Ins | novel | c.226_227insCATCTTTATTATCTTTGCGTATAGCAATTCGTATTATTGGGCAAGAC | p.Glu76AlafsTer34 | p.E76Afs*34 | P63208 | protein_coding | TCGA-DD-A73E-01 | Liver | liver hepatocellular carcinoma | Male | >=65 | I/II | Unknown | Unknown | SD | ||
| SKP1 | SNV | Missense_Mutation | c.49N>T | p.Asp17Tyr | p.D17Y | P63208 | protein_coding | deleterious(0) | possibly_damaging(0.891) | TCGA-05-4382-01 | Lung | lung adenocarcinoma | Male | >=65 | I/II | Unknown | Unknown | PD | |
| SKP1 | SNV | Missense_Mutation | novel | c.239A>G | p.Lys80Arg | p.K80R | P63208 | protein_coding | tolerated(0.27) | possibly_damaging(0.899) | TCGA-05-4427-01 | Lung | lung adenocarcinoma | Female | >=65 | I/II | Chemotherapy | cisplatin | CR |
| SKP1 | SNV | Missense_Mutation | novel | c.139N>G | p.Leu47Val | p.L47V | P63208 | protein_coding | tolerated(0.11) | probably_damaging(0.959) | TCGA-49-6742-01 | Lung | lung adenocarcinoma | Male | >=65 | I/II | Chemotherapy | alimta | PD |
| SKP1 | SNV | Missense_Mutation | novel | c.317N>G | p.Ala106Gly | p.A106G | P63208 | protein_coding | deleterious(0) | possibly_damaging(0.698) | TCGA-55-8089-01 | Lung | lung adenocarcinoma | Male | <65 | I/II | Unknown | Unknown | SD |
| Page: 1 2 |
Top |
Related drugs of malignant transformation related genes |
| Identification of chemicals and drugs interact with genes involved in malignant transfromation |
| (DGIdb 4.0) |
| Entrez ID | Symbol | Category | Interaction Types | Drug Claim Name | Drug Name | PMIDs |
| Page: 1 |

Copyright 2023-Present -The University of Texas Health Science Center at Houston |