
|
|||||
|
 | |
| |
| |
| |
| |
| |
|
Gene: SKIV2L2 |
Gene summary for SKIV2L2 |
| Gene information | Species | Human | Gene symbol | SKIV2L2 | Gene ID | 23517 |
| Gene name | Mtr4 exosome RNA helicase | |
| Gene Alias | Dob1 | |
| Cytomap | 5q11.2 | |
| Gene Type | protein-coding | GO ID | GO:0000375 | UniProtAcc | P42285 |
Top |
Malignant transformation analysis |
| Identification of the aberrant gene expression in precancerous and cancerous lesions by comparing the gene expression of stem-like cells in diseased tissues with normal stem cells |
| Entrez ID | Symbol | Replicates | Species | Organ | Tissue | Adj P-value | Log2FC | Malignancy |
| 23517 | SKIV2L2 | P1T-E | Human | Esophagus | ESCC | 3.97e-02 | 1.27e-01 | 0.0875 |
| 23517 | SKIV2L2 | P2T-E | Human | Esophagus | ESCC | 7.33e-20 | 3.60e-01 | 0.1177 |
| 23517 | SKIV2L2 | P4T-E | Human | Esophagus | ESCC | 3.61e-09 | 2.13e-01 | 0.1323 |
| 23517 | SKIV2L2 | P5T-E | Human | Esophagus | ESCC | 4.25e-23 | 2.54e-01 | 0.1327 |
| 23517 | SKIV2L2 | P8T-E | Human | Esophagus | ESCC | 6.51e-15 | 1.45e-01 | 0.0889 |
| 23517 | SKIV2L2 | P9T-E | Human | Esophagus | ESCC | 2.18e-12 | 2.06e-01 | 0.1131 |
| 23517 | SKIV2L2 | P10T-E | Human | Esophagus | ESCC | 4.99e-26 | 2.65e-01 | 0.116 |
| 23517 | SKIV2L2 | P11T-E | Human | Esophagus | ESCC | 1.04e-08 | 3.94e-01 | 0.1426 |
| 23517 | SKIV2L2 | P12T-E | Human | Esophagus | ESCC | 1.81e-18 | 2.82e-01 | 0.1122 |
| 23517 | SKIV2L2 | P15T-E | Human | Esophagus | ESCC | 8.43e-15 | 2.63e-01 | 0.1149 |
| 23517 | SKIV2L2 | P16T-E | Human | Esophagus | ESCC | 4.24e-16 | 1.99e-01 | 0.1153 |
| 23517 | SKIV2L2 | P17T-E | Human | Esophagus | ESCC | 3.04e-05 | 8.98e-02 | 0.1278 |
| 23517 | SKIV2L2 | P20T-E | Human | Esophagus | ESCC | 3.97e-11 | 2.25e-01 | 0.1124 |
| 23517 | SKIV2L2 | P21T-E | Human | Esophagus | ESCC | 1.35e-18 | 2.87e-01 | 0.1617 |
| 23517 | SKIV2L2 | P22T-E | Human | Esophagus | ESCC | 4.01e-18 | 1.85e-01 | 0.1236 |
| 23517 | SKIV2L2 | P23T-E | Human | Esophagus | ESCC | 2.39e-03 | 2.04e-01 | 0.108 |
| 23517 | SKIV2L2 | P24T-E | Human | Esophagus | ESCC | 1.89e-13 | 1.58e-01 | 0.1287 |
| 23517 | SKIV2L2 | P26T-E | Human | Esophagus | ESCC | 5.30e-29 | 2.72e-01 | 0.1276 |
| 23517 | SKIV2L2 | P27T-E | Human | Esophagus | ESCC | 2.73e-16 | 1.43e-01 | 0.1055 |
| 23517 | SKIV2L2 | P28T-E | Human | Esophagus | ESCC | 8.00e-12 | 6.50e-02 | 0.1149 |
| Page: 1 2 3 4 5 |
| Tissue | Expression Dynamics | Abbreviation |
| Esophagus | 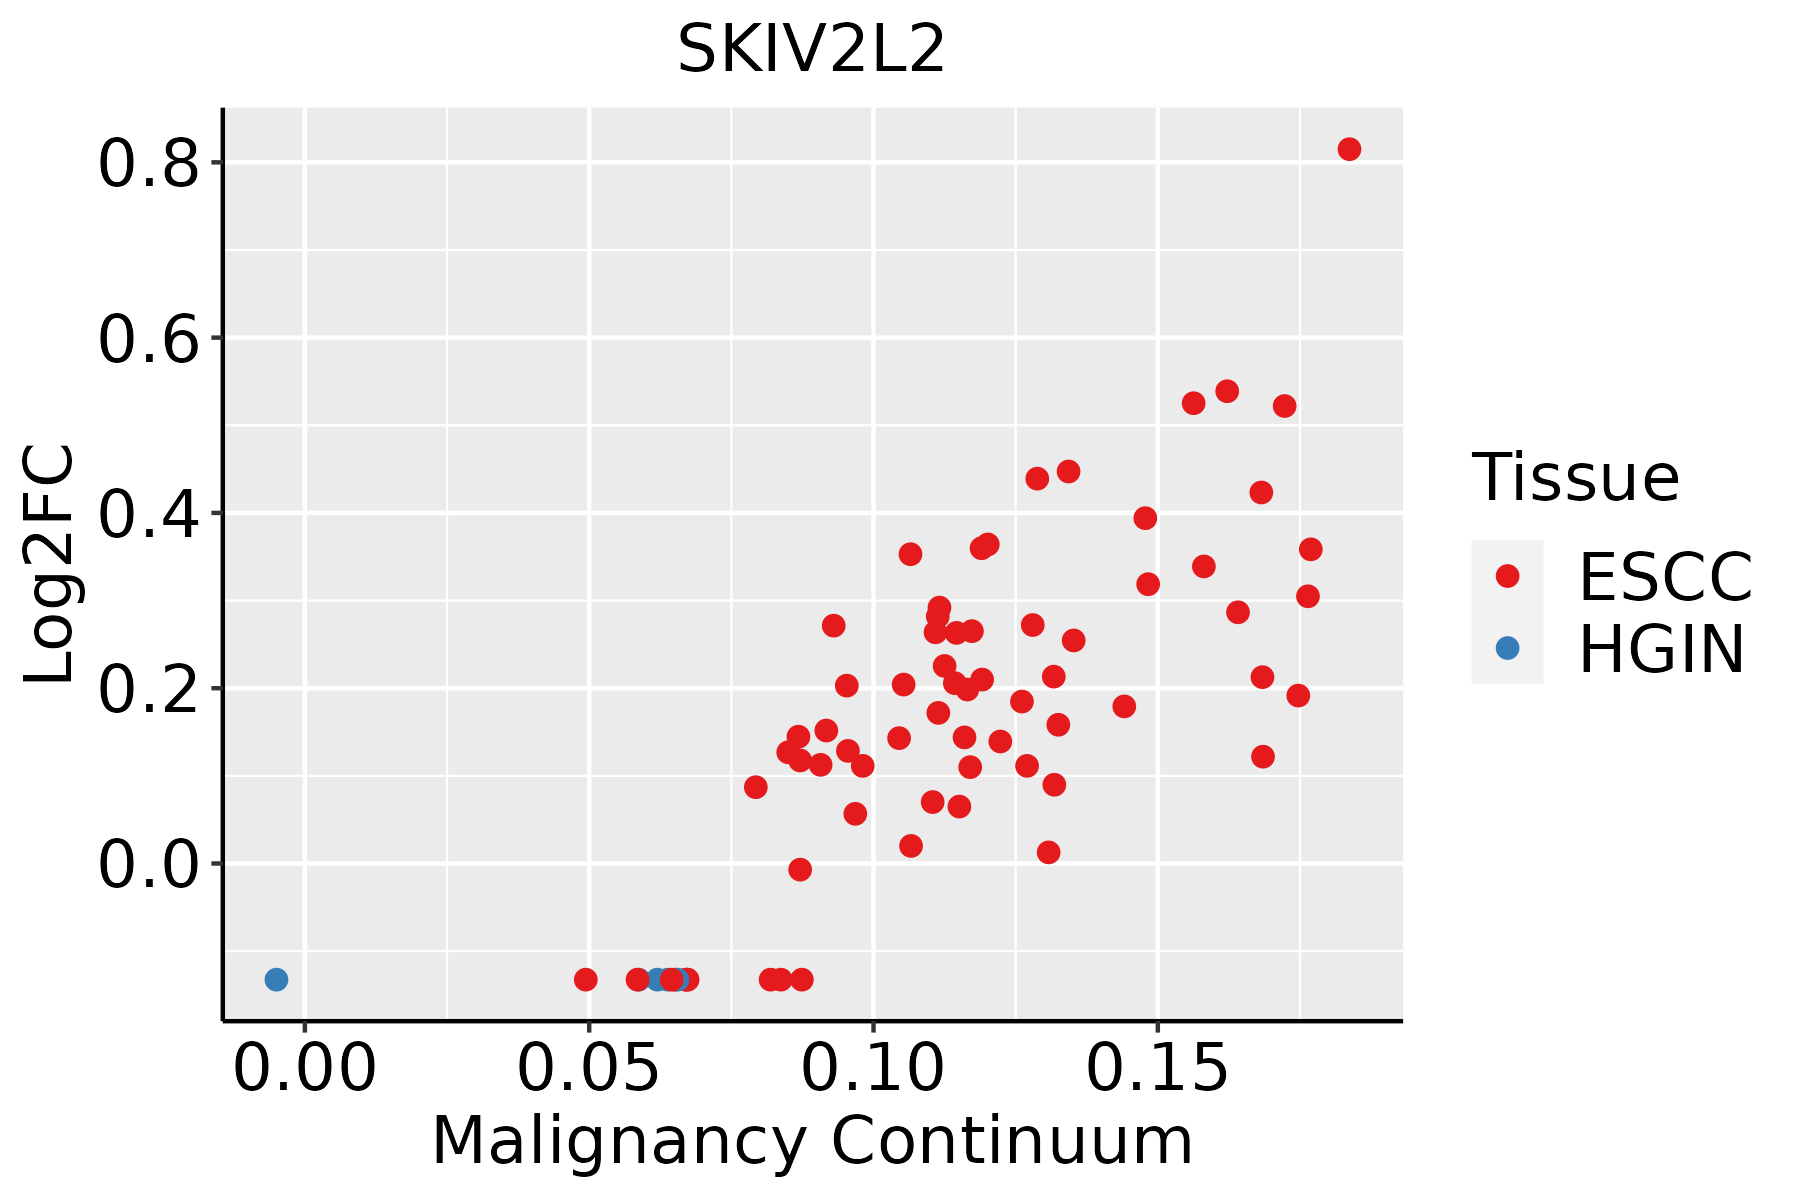 | ESCC: Esophageal squamous cell carcinoma |
| HGIN: High-grade intraepithelial neoplasias | ||
| LGIN: Low-grade intraepithelial neoplasias | ||
| Liver |  | HCC: Hepatocellular carcinoma |
| NAFLD: Non-alcoholic fatty liver disease | ||
| Oral Cavity |  | EOLP: Erosive Oral lichen planus |
| LP: leukoplakia | ||
| NEOLP: Non-erosive oral lichen planus | ||
| OSCC: Oral squamous cell carcinoma | ||
| Prostate | 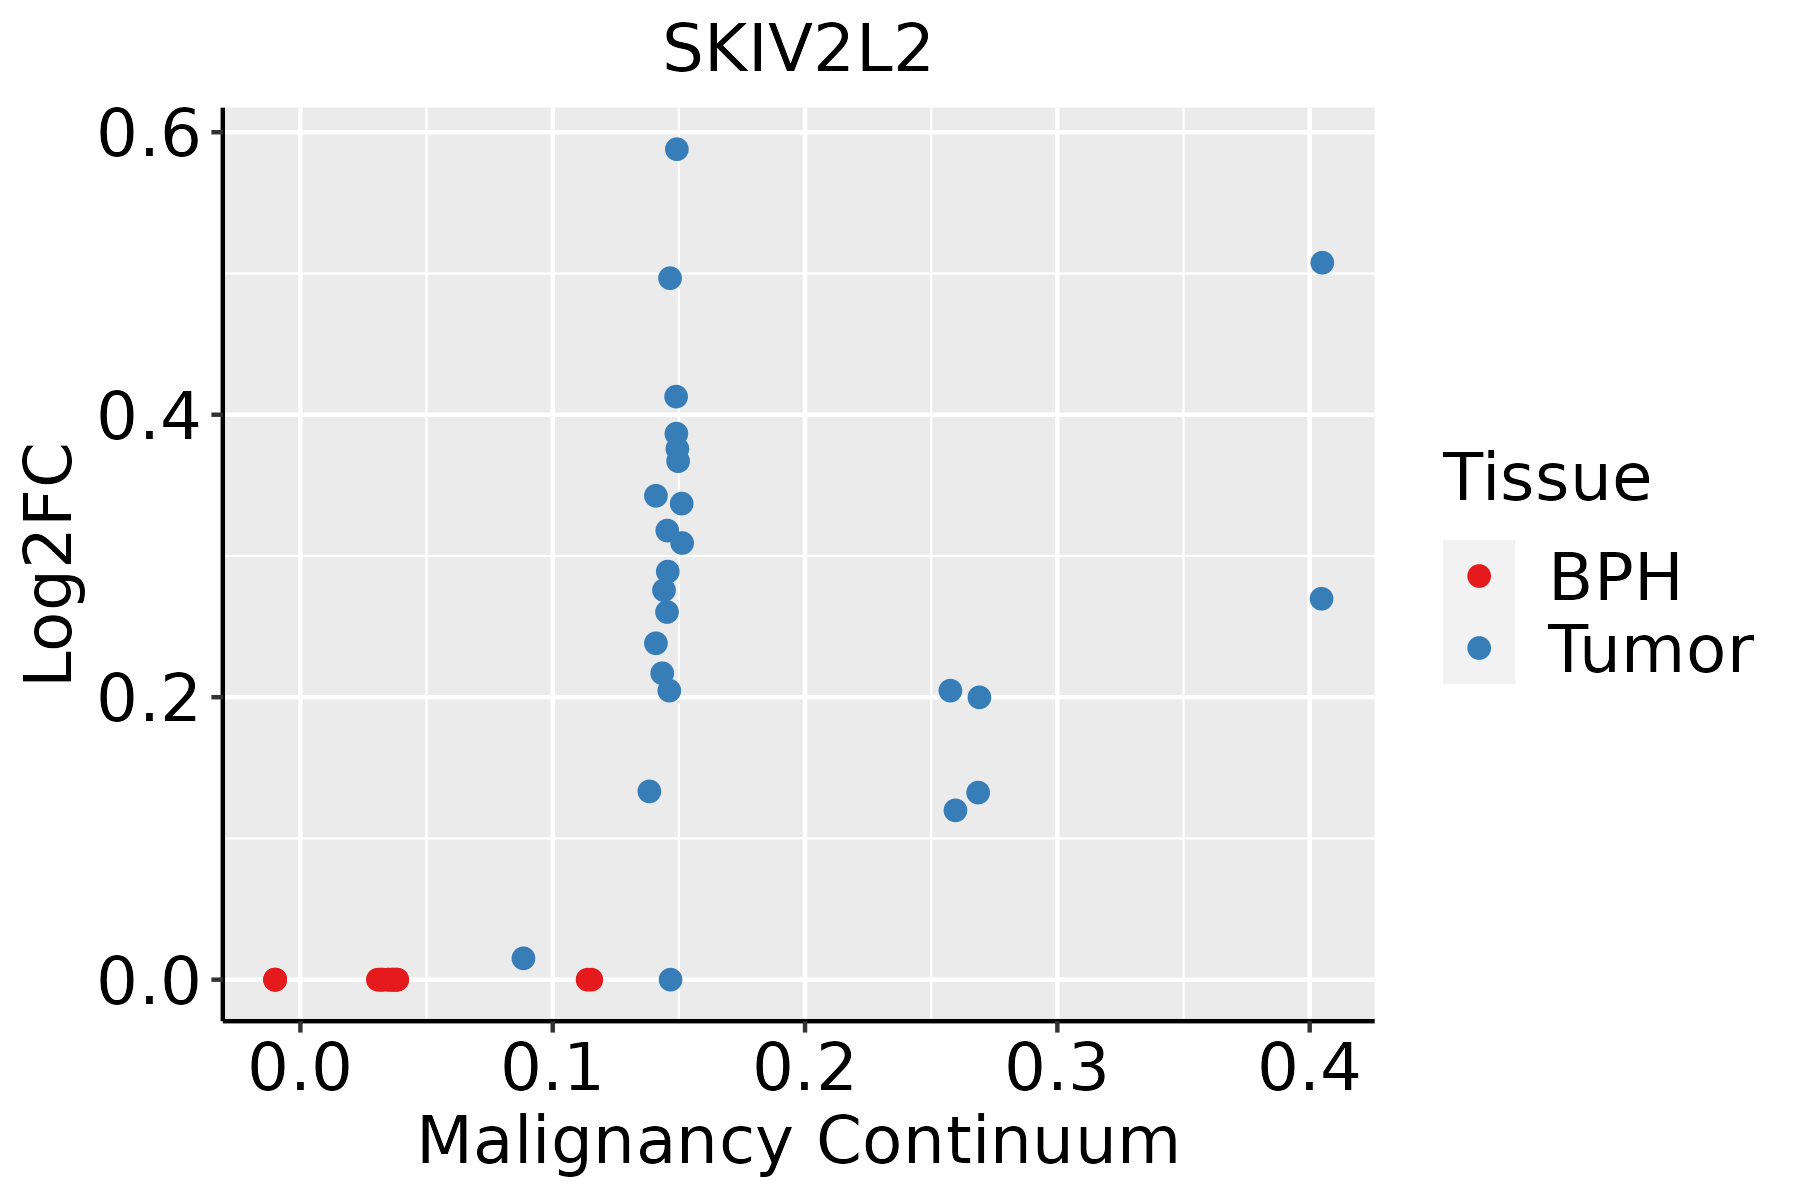 | BPH: Benign Prostatic Hyperplasia |
| Skin | 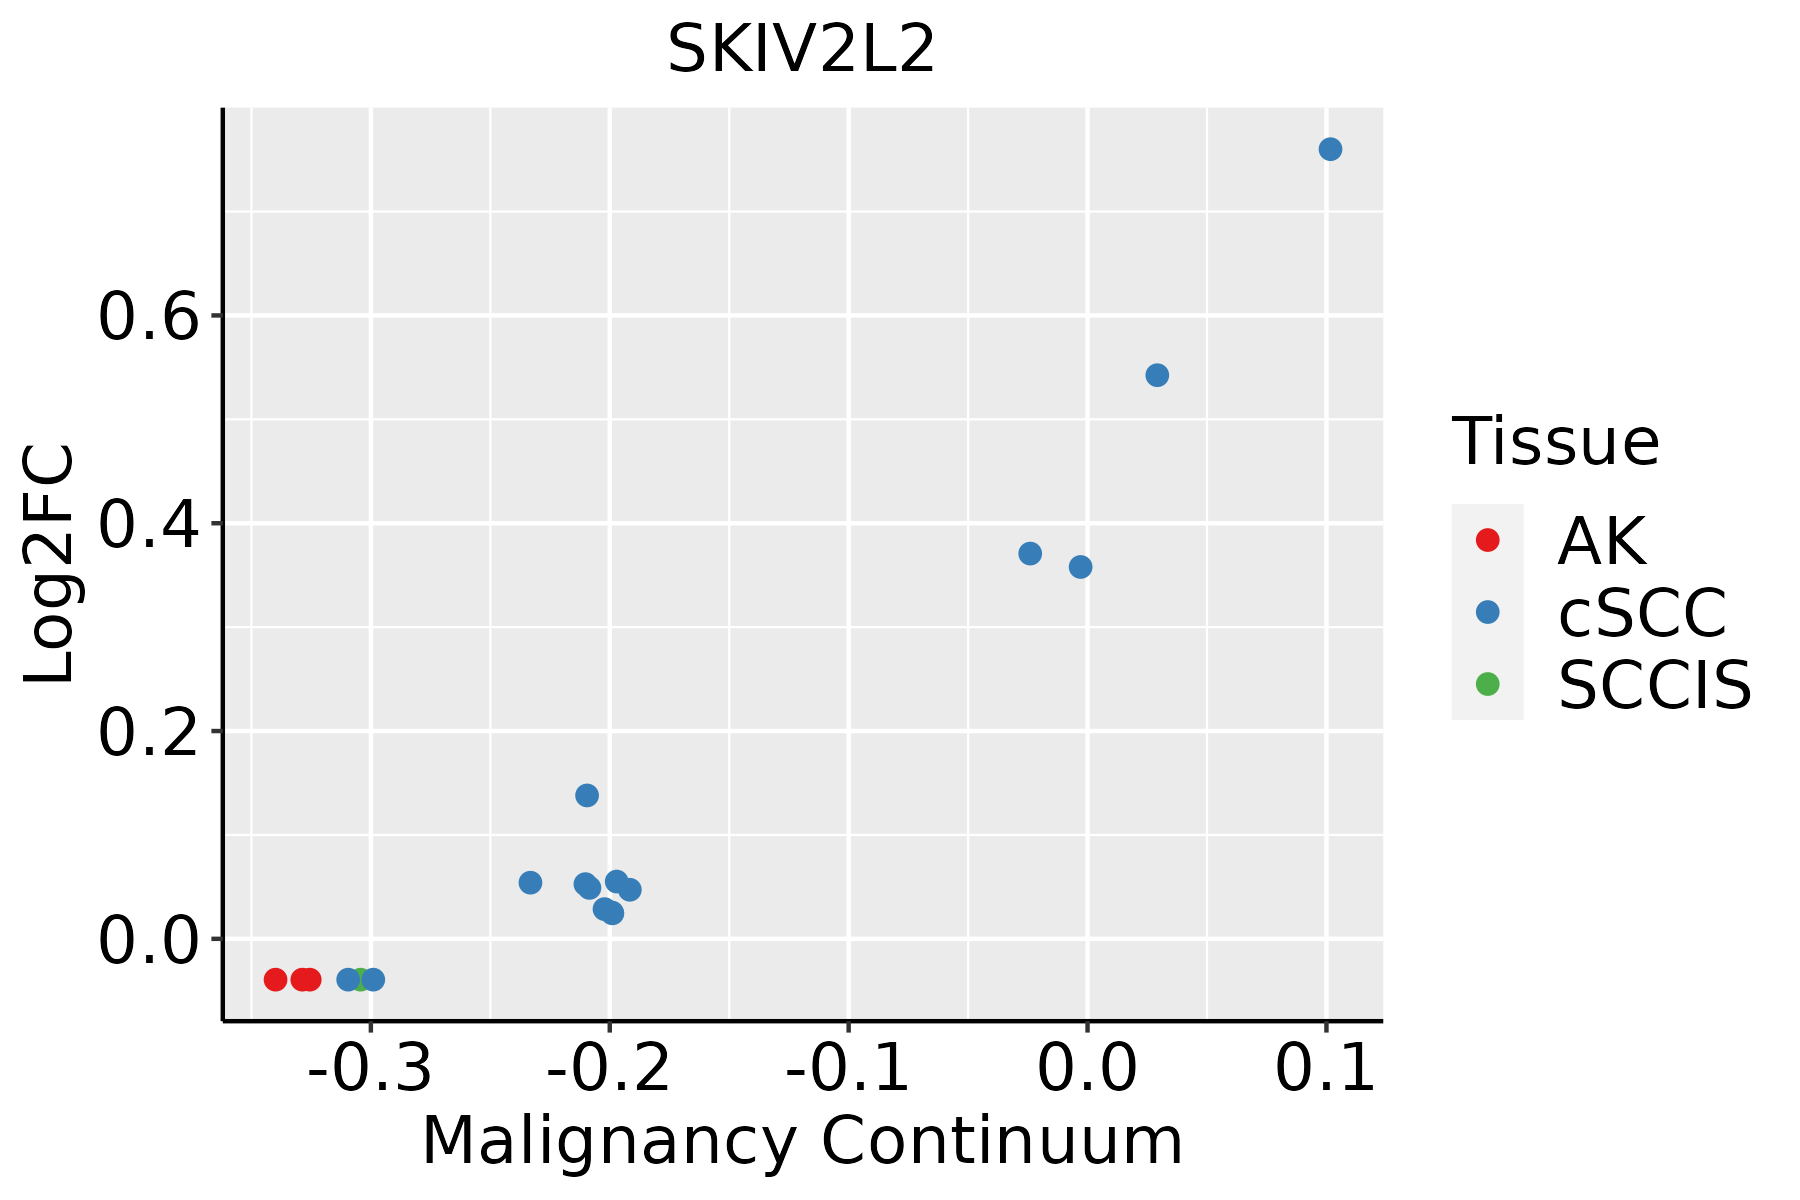 | AK: Actinic keratosis |
| cSCC: Cutaneous squamous cell carcinoma | ||
| SCCIS:squamous cell carcinoma in situ |
| ∗log2FC in expression of this searched gene in stem-like cells from each diseased tissue sample relative to stem-like cells in normal samples in each tissue plotted against the malignancy continuum. Samples are colored based on if they are from different disease stage. |
Top |
Malignant transformation related pathway analysis |
| Find out the enriched GO biological processes and KEGG pathways involved in transition from healthy to precancer to cancer |
| Tissue | Disease Stage | Enriched GO biological Processes |
| Colorectum | AD |  |
| Colorectum | SER |  |
| Colorectum | MSS |  |
| Colorectum | MSI-H |  |
| Colorectum | FAP |  |
| ∗Top 15 enriched GO BP terms are showed in the bar plot of each disease state in each tissue. Each row represents a significant GO biological process which is colored according to the -log10(p.adjust). |
| Page: 1 2 3 4 5 6 7 8 9 |
| GO ID | Tissue | Disease Stage | Description | Gene Ratio | Bg Ratio | pvalue | p.adjust | Count |
| Page: 1 |
| Pathway ID | Tissue | Disease Stage | Description | Gene Ratio | Bg Ratio | pvalue | p.adjust | qvalue | Count |
| hsa03018 | Liver | Cirrhotic | RNA degradation | 44/2530 | 79/8465 | 1.43e-06 | 1.65e-05 | 1.02e-05 | 44 |
| hsa030181 | Liver | Cirrhotic | RNA degradation | 44/2530 | 79/8465 | 1.43e-06 | 1.65e-05 | 1.02e-05 | 44 |
| hsa030182 | Liver | HCC | RNA degradation | 58/4020 | 79/8465 | 2.29e-06 | 2.19e-05 | 1.22e-05 | 58 |
| hsa030183 | Liver | HCC | RNA degradation | 58/4020 | 79/8465 | 2.29e-06 | 2.19e-05 | 1.22e-05 | 58 |
| Page: 1 |
Top |
Cell-cell communication analysis |
| Identification of potential cell-cell interactions between two cell types and their ligand-receptor pairs for different disease states |
| Ligand | Receptor | LRpair | Pathway | Tissue | Disease Stage |
| Page: 1 |
Top |
Single-cell gene regulatory network inference analysis |
| Find out the significant the regulons (TFs) and the target genes of each regulon across cell types for different disease states |
| TF | Cell Type | Tissue | Disease Stage | Target Gene | RSS | Regulon Activity |
| ∗The dot plots of a searched regulon are shown for all cell subpopulations in each disease state of each tissue based on the regulon specific score inferred using pySCENIC and by calculating the average expression. |
| Page: 1 |
Top |
Somatic mutation of malignant transformation related genes |
| Annotation of somatic variants for genes involved in malignant transformation |
| Hugo Symbol | Variant Class | Variant Classification | dbSNP RS | HGVSc | HGVSp | HGVSp Short | SWISSPROT | BIOTYPE | SIFT | PolyPhen | Tumor Sample Barcode | Tissue | Histology | Sex | Age | Stage | Therapy Types | Drugs | Outcome |
| SKIV2L2 | SNV | Missense_Mutation | novel | c.740C>T | p.Ala247Val | p.A247V | P42285 | protein_coding | deleterious(0.01) | possibly_damaging(0.906) | TCGA-AC-A5XU-01 | Breast | breast invasive carcinoma | Female | >=65 | I/II | Hormone Therapy | letrozole | SD |
| SKIV2L2 | SNV | Missense_Mutation | novel | c.2764N>T | p.Pro922Ser | p.P922S | P42285 | protein_coding | tolerated(0.13) | benign(0.22) | TCGA-AN-A046-01 | Breast | breast invasive carcinoma | Female | >=65 | I/II | Unknown | Unknown | SD |
| SKIV2L2 | SNV | Missense_Mutation | c.2464N>C | p.Cys822Arg | p.C822R | P42285 | protein_coding | deleterious(0.01) | possibly_damaging(0.449) | TCGA-BH-A18V-01 | Breast | breast invasive carcinoma | Female | <65 | I/II | Unknown | Unknown | SD | |
| SKIV2L2 | SNV | Missense_Mutation | novel | c.1505G>A | p.Arg502His | p.R502H | P42285 | protein_coding | deleterious(0) | probably_damaging(0.922) | TCGA-2W-A8YY-01 | Cervix | cervical & endocervical cancer | Female | <65 | I/II | Chemotherapy | cisplatin | CR |
| SKIV2L2 | SNV | Missense_Mutation | c.1618N>C | p.Asp540His | p.D540H | P42285 | protein_coding | deleterious(0) | probably_damaging(0.98) | TCGA-Q1-A73O-01 | Cervix | cervical & endocervical cancer | Female | <65 | I/II | Chemotherapy | cisplatin | CR | |
| SKIV2L2 | SNV | Missense_Mutation | c.3121T>G | p.Tyr1041Asp | p.Y1041D | P42285 | protein_coding | deleterious(0) | probably_damaging(0.98) | TCGA-3L-AA1B-01 | Colorectum | colon adenocarcinoma | Female | <65 | I/II | Unknown | Unknown | SD | |
| SKIV2L2 | SNV | Missense_Mutation | c.2305C>T | p.Arg769Cys | p.R769C | P42285 | protein_coding | deleterious(0) | probably_damaging(0.997) | TCGA-AA-3492-01 | Colorectum | colon adenocarcinoma | Female | >=65 | I/II | Unknown | Unknown | SD | |
| SKIV2L2 | SNV | Missense_Mutation | novel | c.511N>A | p.Ala171Thr | p.A171T | P42285 | protein_coding | deleterious(0.02) | probably_damaging(0.989) | TCGA-AA-3877-01 | Colorectum | colon adenocarcinoma | Female | >=65 | I/II | Unknown | Unknown | SD |
| SKIV2L2 | SNV | Missense_Mutation | c.239C>A | p.Pro80His | p.P80H | P42285 | protein_coding | tolerated(0.59) | benign(0.372) | TCGA-AD-A5EJ-01 | Colorectum | colon adenocarcinoma | Female | >=65 | I/II | Unknown | Unknown | SD | |
| SKIV2L2 | SNV | Missense_Mutation | c.1634N>T | p.Pro545Leu | p.P545L | P42285 | protein_coding | deleterious(0) | benign(0.077) | TCGA-AU-6004-01 | Colorectum | colon adenocarcinoma | Female | >=65 | I/II | Unknown | Unknown | SD |
| Page: 1 2 3 4 5 6 7 8 9 10 |
Top |
Related drugs of malignant transformation related genes |
| Identification of chemicals and drugs interact with genes involved in malignant transfromation |
| (DGIdb 4.0) |
| Entrez ID | Symbol | Category | Interaction Types | Drug Claim Name | Drug Name | PMIDs |
| Page: 1 |

Copyright 2023-Present -The University of Texas Health Science Center at Houston |