
|
|||||
|
 | |
| |
| |
| |
| |
| |
|
Gene: SKAP2 |
Gene summary for SKAP2 |
| Gene information | Species | Human | Gene symbol | SKAP2 | Gene ID | 8935 |
| Gene name | src kinase associated phosphoprotein 2 | |
| Gene Alias | PRAP | |
| Cytomap | 7p15.2 | |
| Gene Type | protein-coding | GO ID | GO:0001775 | UniProtAcc | B7Z5R3 |
Top |
Malignant transformation analysis |
| Identification of the aberrant gene expression in precancerous and cancerous lesions by comparing the gene expression of stem-like cells in diseased tissues with normal stem cells |
| Entrez ID | Symbol | Replicates | Species | Organ | Tissue | Adj P-value | Log2FC | Malignancy |
| 8935 | SKAP2 | HTA11_3410_2000001011 | Human | Colorectum | AD | 5.63e-06 | -3.81e-01 | 0.0155 |
| 8935 | SKAP2 | HTA11_347_2000001011 | Human | Colorectum | AD | 3.29e-04 | 4.01e-01 | -0.1954 |
| 8935 | SKAP2 | HTA11_3361_2000001011 | Human | Colorectum | AD | 2.48e-02 | -2.65e-01 | -0.1207 |
| 8935 | SKAP2 | HTA11_99999970781_79442 | Human | Colorectum | MSS | 1.34e-05 | -3.72e-01 | 0.294 |
| 8935 | SKAP2 | HTA11_99999974143_84620 | Human | Colorectum | MSS | 1.23e-09 | -4.26e-01 | 0.3005 |
| 8935 | SKAP2 | A001-C-207 | Human | Colorectum | FAP | 1.52e-04 | -4.06e-01 | 0.1278 |
| 8935 | SKAP2 | A015-C-203 | Human | Colorectum | FAP | 3.43e-20 | -4.12e-01 | -0.1294 |
| 8935 | SKAP2 | A002-C-201 | Human | Colorectum | FAP | 1.75e-09 | -4.27e-01 | 0.0324 |
| 8935 | SKAP2 | A001-C-119 | Human | Colorectum | FAP | 3.27e-07 | -5.17e-01 | -0.1557 |
| 8935 | SKAP2 | A001-C-108 | Human | Colorectum | FAP | 3.59e-13 | -3.47e-01 | -0.0272 |
| 8935 | SKAP2 | A002-C-205 | Human | Colorectum | FAP | 3.54e-15 | -4.70e-01 | -0.1236 |
| 8935 | SKAP2 | A001-C-104 | Human | Colorectum | FAP | 1.17e-03 | -3.17e-01 | 0.0184 |
| 8935 | SKAP2 | A015-C-005 | Human | Colorectum | FAP | 1.08e-06 | -4.00e-01 | -0.0336 |
| 8935 | SKAP2 | A015-C-006 | Human | Colorectum | FAP | 7.03e-13 | -5.20e-01 | -0.0994 |
| 8935 | SKAP2 | A015-C-106 | Human | Colorectum | FAP | 6.51e-11 | -3.53e-01 | -0.0511 |
| 8935 | SKAP2 | A002-C-114 | Human | Colorectum | FAP | 1.71e-12 | -4.89e-01 | -0.1561 |
| 8935 | SKAP2 | A015-C-104 | Human | Colorectum | FAP | 1.38e-23 | -4.89e-01 | -0.1899 |
| 8935 | SKAP2 | A001-C-014 | Human | Colorectum | FAP | 3.76e-12 | -3.88e-01 | 0.0135 |
| 8935 | SKAP2 | A002-C-016 | Human | Colorectum | FAP | 7.29e-17 | -3.00e-01 | 0.0521 |
| 8935 | SKAP2 | A015-C-002 | Human | Colorectum | FAP | 7.92e-08 | -4.28e-01 | -0.0763 |
| Page: 1 2 3 4 5 6 7 8 |
| Tissue | Expression Dynamics | Abbreviation |
| Colorectum (GSE201348) | 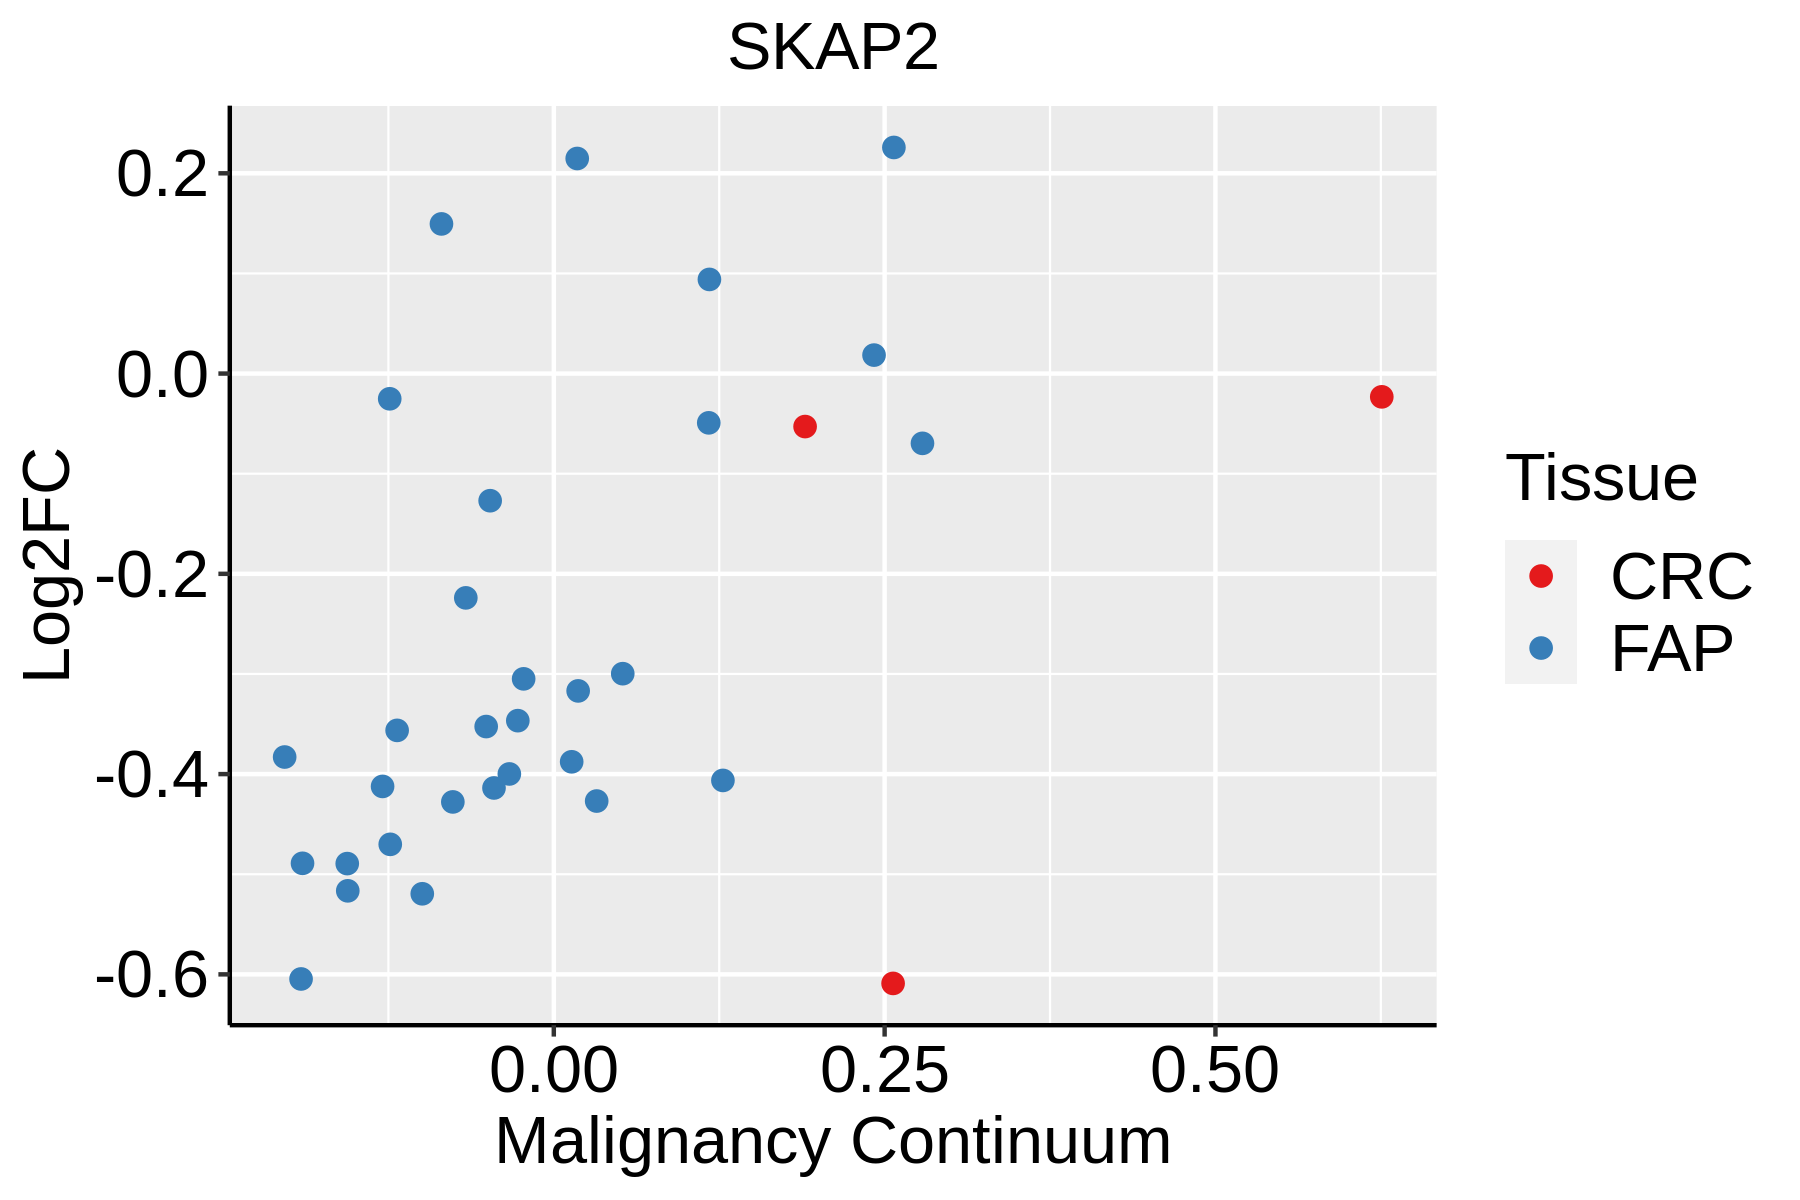 | FAP: Familial adenomatous polyposis |
| CRC: Colorectal cancer | ||
| Colorectum (HTA11) |  | AD: Adenomas |
| SER: Sessile serrated lesions | ||
| MSI-H: Microsatellite-high colorectal cancer | ||
| MSS: Microsatellite stable colorectal cancer | ||
| Esophagus | 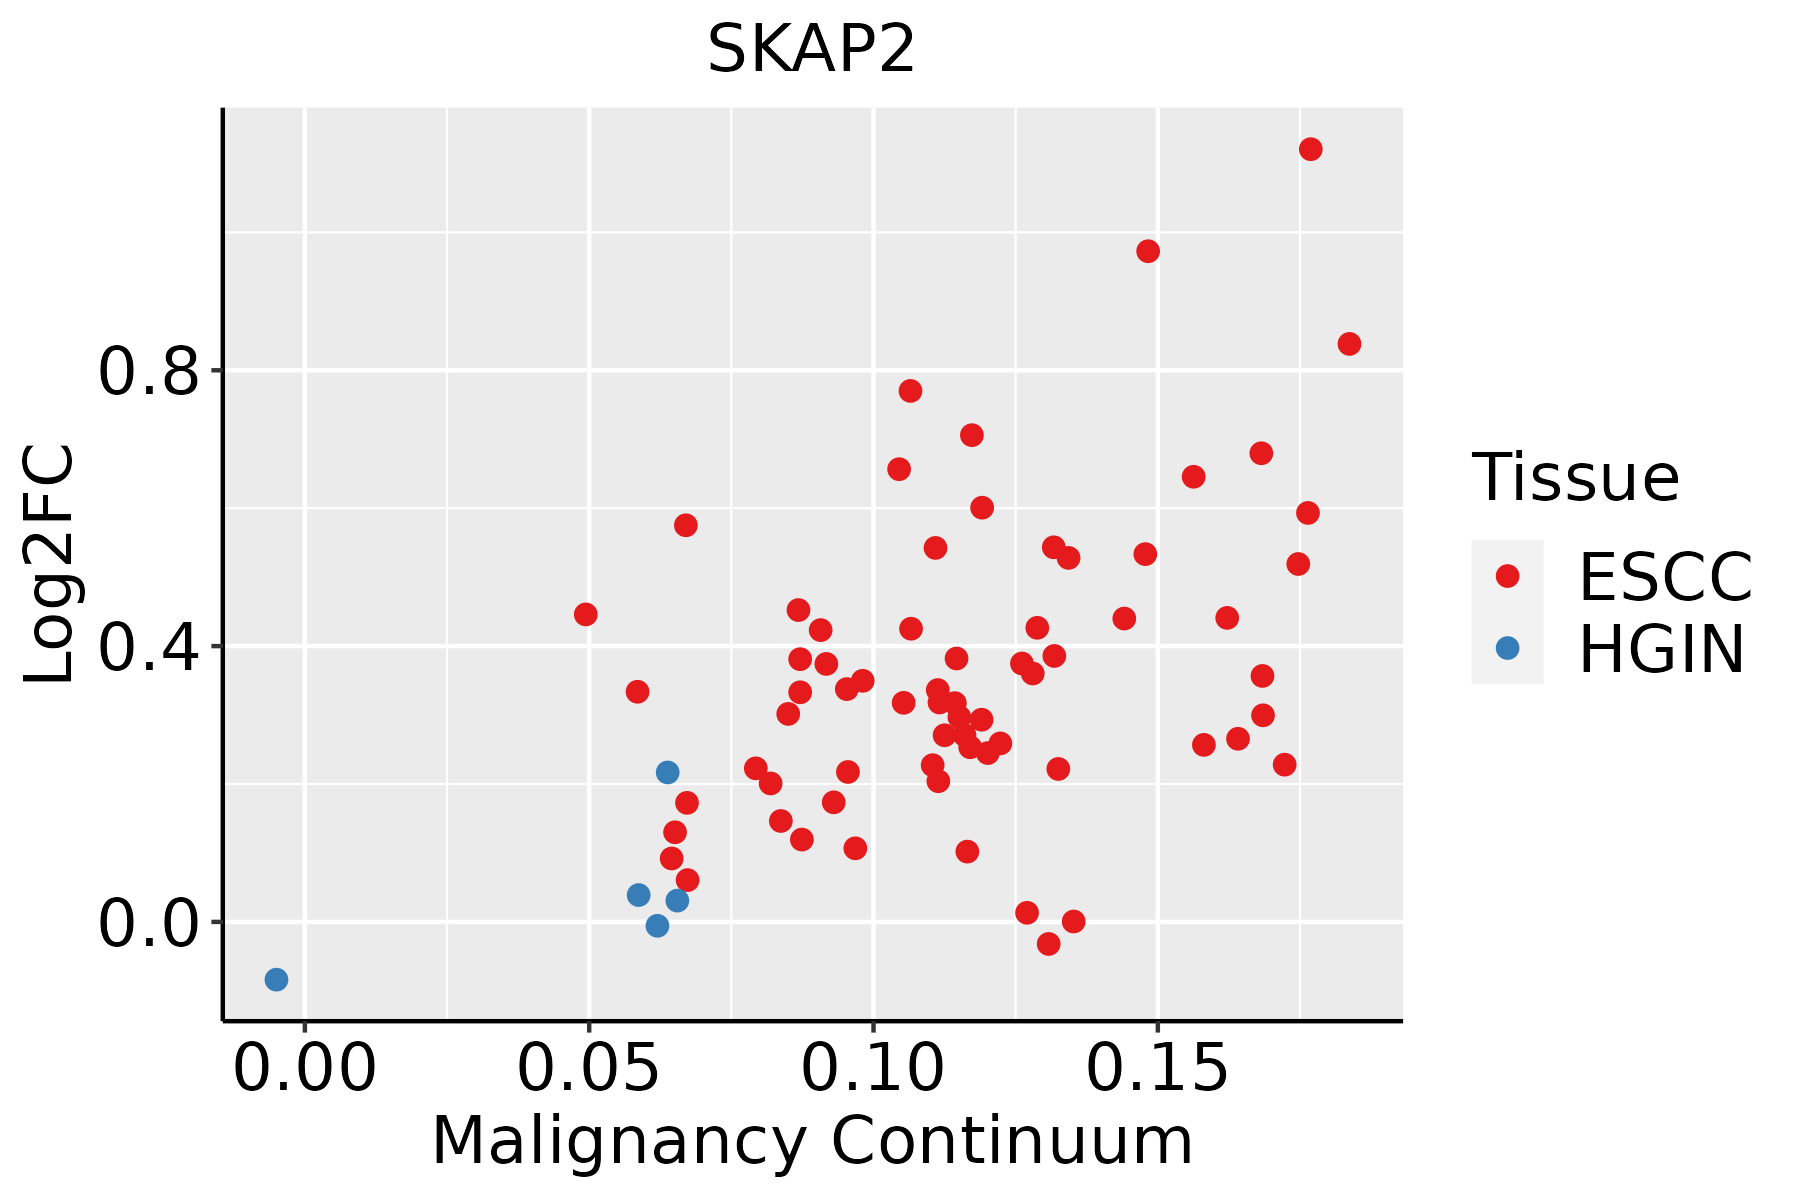 | ESCC: Esophageal squamous cell carcinoma |
| HGIN: High-grade intraepithelial neoplasias | ||
| LGIN: Low-grade intraepithelial neoplasias | ||
| Liver |  | HCC: Hepatocellular carcinoma |
| NAFLD: Non-alcoholic fatty liver disease | ||
| Oral Cavity | 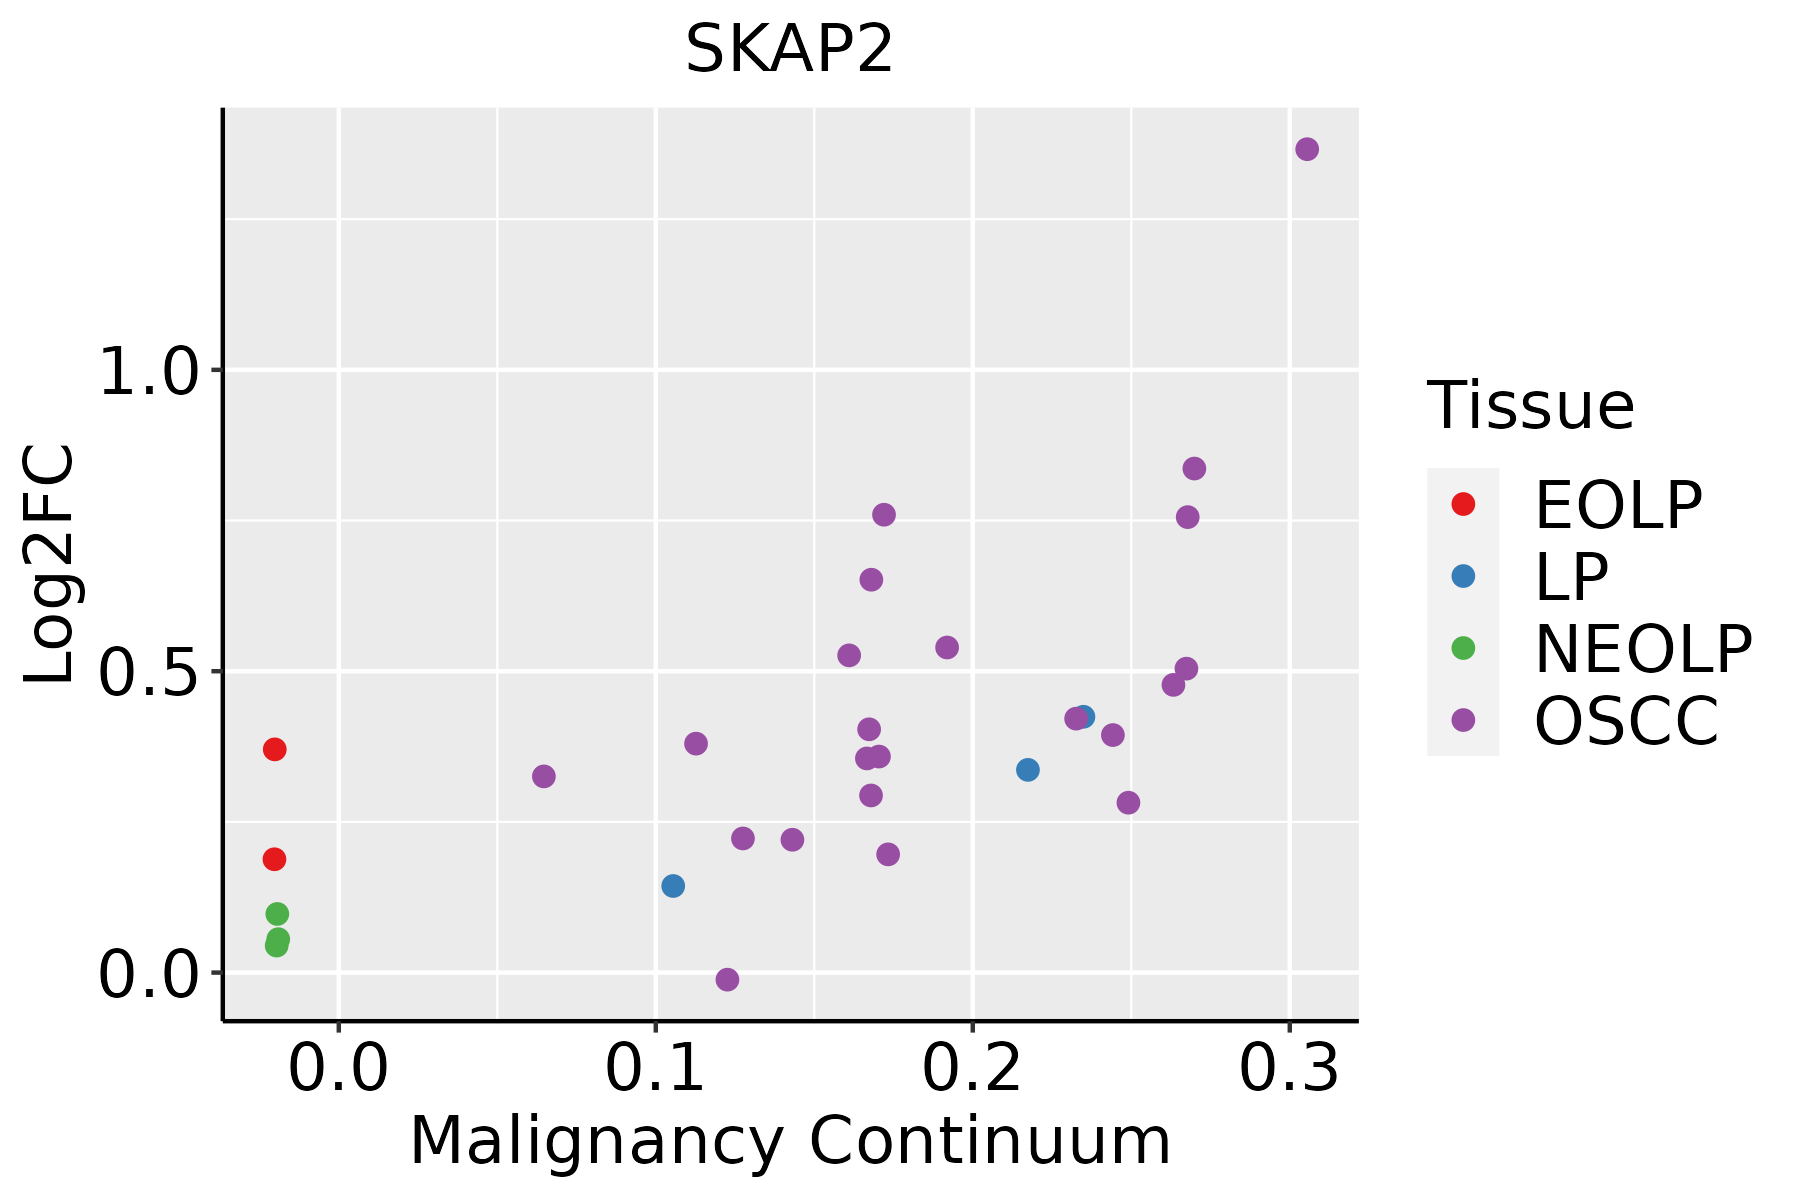 | EOLP: Erosive Oral lichen planus |
| LP: leukoplakia | ||
| NEOLP: Non-erosive oral lichen planus | ||
| OSCC: Oral squamous cell carcinoma | ||
| Skin | 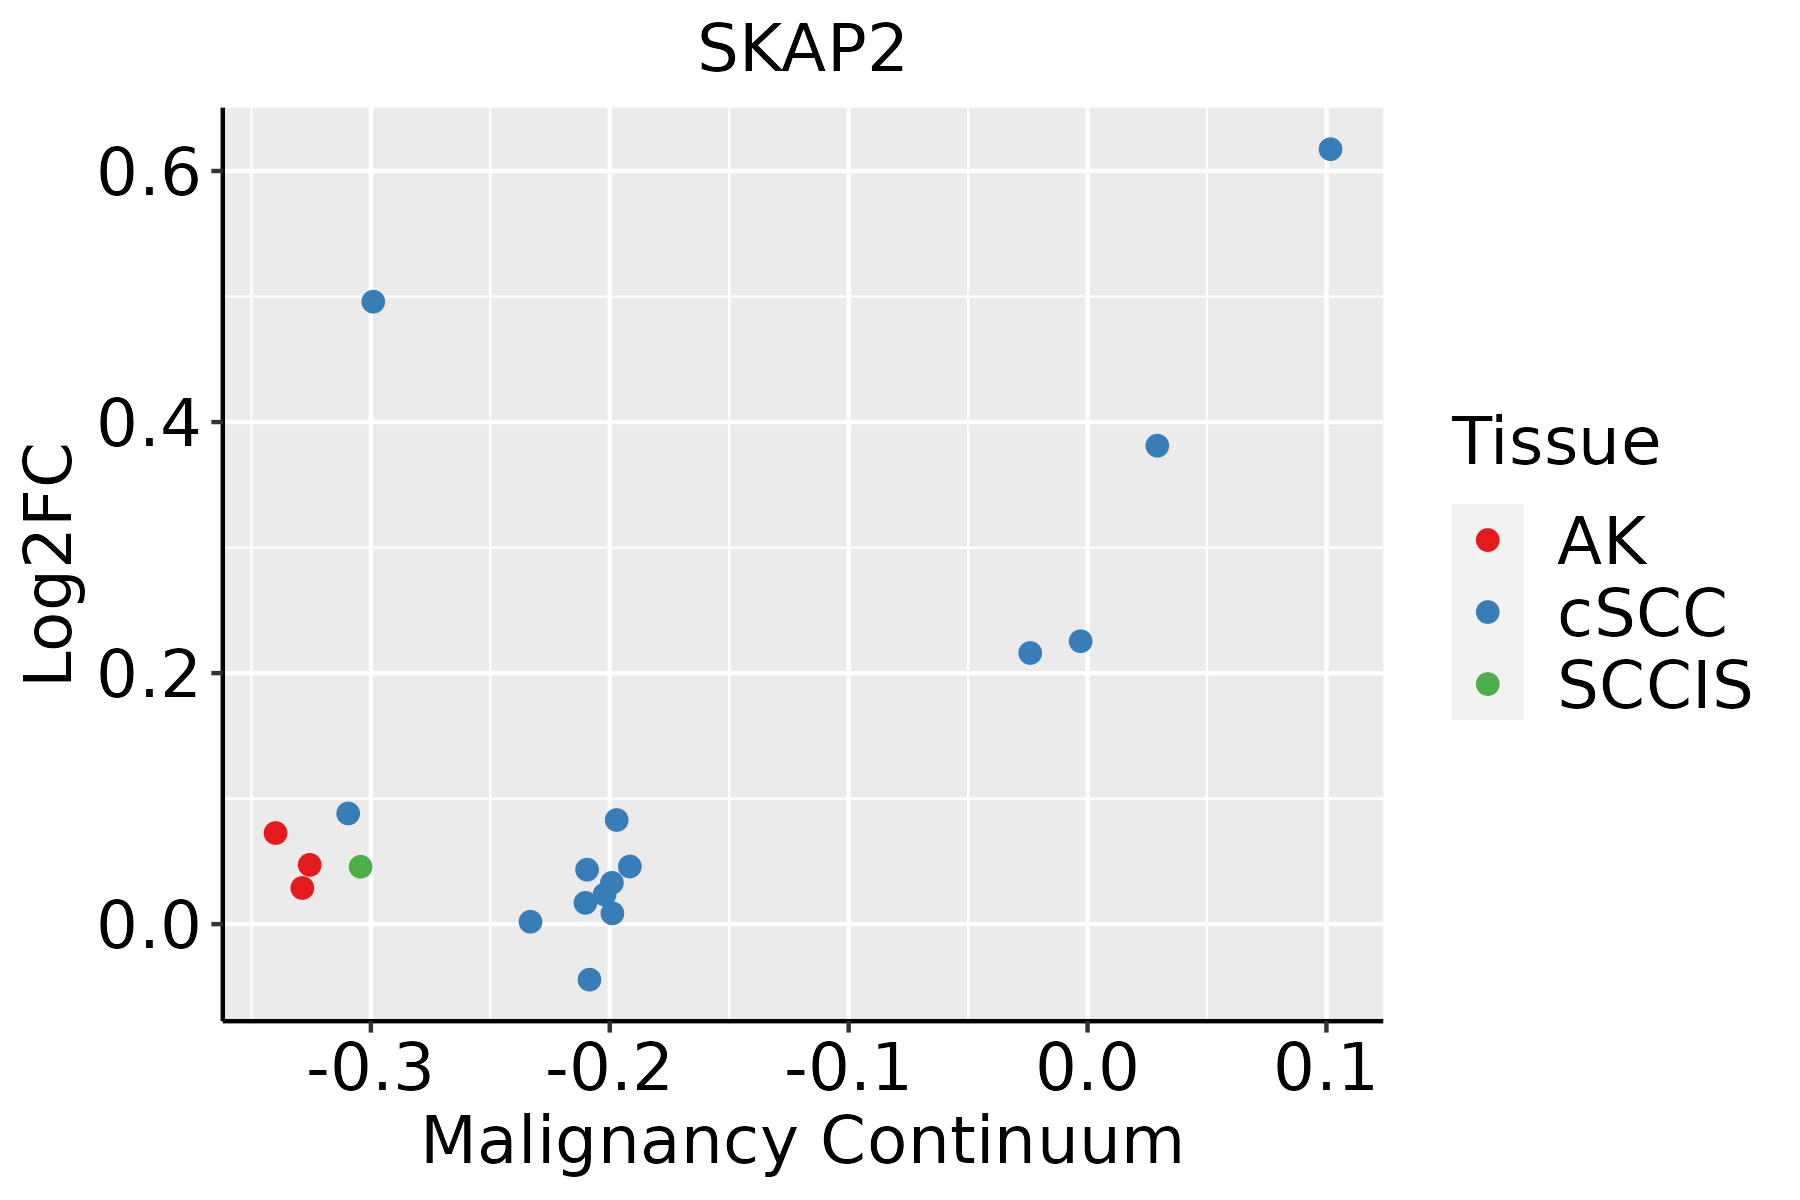 | AK: Actinic keratosis |
| cSCC: Cutaneous squamous cell carcinoma | ||
| SCCIS:squamous cell carcinoma in situ | ||
| Thyroid | 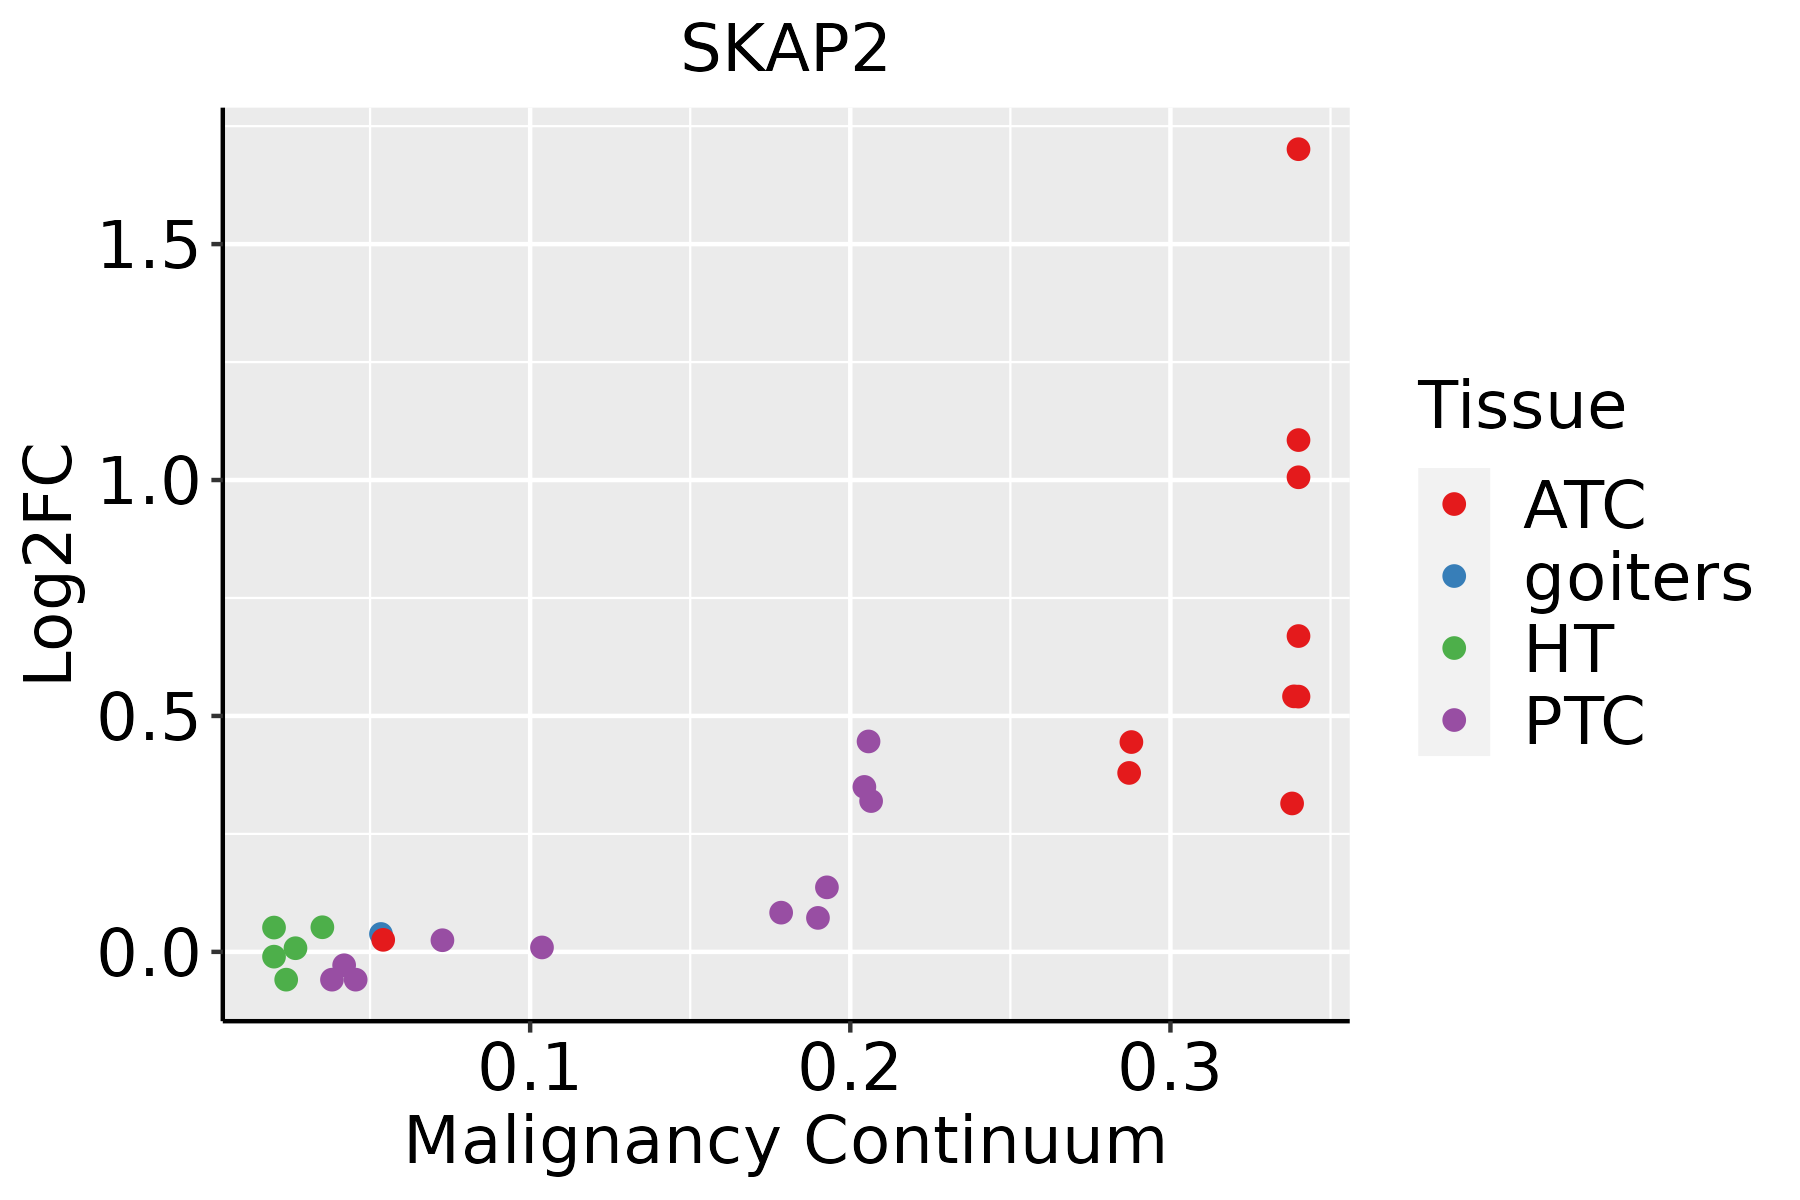 | ATC: Anaplastic thyroid cancer |
| HT: Hashimoto's thyroiditis | ||
| PTC: Papillary thyroid cancer |
| ∗log2FC in expression of this searched gene in stem-like cells from each diseased tissue sample relative to stem-like cells in normal samples in each tissue plotted against the malignancy continuum. Samples are colored based on if they are from different disease stage. |
Top |
Malignant transformation related pathway analysis |
| Find out the enriched GO biological processes and KEGG pathways involved in transition from healthy to precancer to cancer |
| Tissue | Disease Stage | Enriched GO biological Processes |
| Colorectum | AD |  |
| Colorectum | SER |  |
| Colorectum | MSS |  |
| Colorectum | MSI-H |  |
| Colorectum | FAP |  |
| ∗Top 15 enriched GO BP terms are showed in the bar plot of each disease state in each tissue. Each row represents a significant GO biological process which is colored according to the -log10(p.adjust). |
| Page: 1 2 3 4 5 6 7 8 9 |
| GO ID | Tissue | Disease Stage | Description | Gene Ratio | Bg Ratio | pvalue | p.adjust | Count |
| GO:00421132 | Oral cavity | EOLP | B cell activation | 61/2218 | 334/18723 | 3.68e-04 | 3.35e-03 | 61 |
| Page: 1 |
| Pathway ID | Tissue | Disease Stage | Description | Gene Ratio | Bg Ratio | pvalue | p.adjust | qvalue | Count |
| hsa05135 | Colorectum | AD | Yersinia infection | 58/2092 | 137/8465 | 3.90e-06 | 4.35e-05 | 2.78e-05 | 58 |
| hsa051351 | Colorectum | AD | Yersinia infection | 58/2092 | 137/8465 | 3.90e-06 | 4.35e-05 | 2.78e-05 | 58 |
| hsa051354 | Colorectum | MSS | Yersinia infection | 53/1875 | 137/8465 | 7.73e-06 | 8.93e-05 | 5.47e-05 | 53 |
| hsa051355 | Colorectum | MSS | Yersinia infection | 53/1875 | 137/8465 | 7.73e-06 | 8.93e-05 | 5.47e-05 | 53 |
| hsa051356 | Colorectum | FAP | Yersinia infection | 43/1404 | 137/8465 | 1.21e-05 | 1.62e-04 | 9.86e-05 | 43 |
| hsa051357 | Colorectum | FAP | Yersinia infection | 43/1404 | 137/8465 | 1.21e-05 | 1.62e-04 | 9.86e-05 | 43 |
| hsa0513526 | Esophagus | ESCC | Yersinia infection | 100/4205 | 137/8465 | 1.80e-08 | 1.59e-07 | 8.12e-08 | 100 |
| hsa05135111 | Esophagus | ESCC | Yersinia infection | 100/4205 | 137/8465 | 1.80e-08 | 1.59e-07 | 8.12e-08 | 100 |
| hsa0513542 | Liver | HCC | Yersinia infection | 92/4020 | 137/8465 | 2.25e-06 | 2.19e-05 | 1.22e-05 | 92 |
| hsa0513552 | Liver | HCC | Yersinia infection | 92/4020 | 137/8465 | 2.25e-06 | 2.19e-05 | 1.22e-05 | 92 |
| hsa0513520 | Oral cavity | OSCC | Yersinia infection | 94/3704 | 137/8465 | 2.85e-09 | 3.08e-08 | 1.57e-08 | 94 |
| hsa05135110 | Oral cavity | OSCC | Yersinia infection | 94/3704 | 137/8465 | 2.85e-09 | 3.08e-08 | 1.57e-08 | 94 |
| hsa0513544 | Oral cavity | EOLP | Yersinia infection | 44/1218 | 137/8465 | 8.88e-08 | 1.06e-06 | 6.27e-07 | 44 |
| hsa0513554 | Oral cavity | EOLP | Yersinia infection | 44/1218 | 137/8465 | 8.88e-08 | 1.06e-06 | 6.27e-07 | 44 |
| Page: 1 |
Top |
Cell-cell communication analysis |
| Identification of potential cell-cell interactions between two cell types and their ligand-receptor pairs for different disease states |
| Ligand | Receptor | LRpair | Pathway | Tissue | Disease Stage |
| Page: 1 |
Top |
Single-cell gene regulatory network inference analysis |
| Find out the significant the regulons (TFs) and the target genes of each regulon across cell types for different disease states |
| TF | Cell Type | Tissue | Disease Stage | Target Gene | RSS | Regulon Activity |
| ∗The dot plots of a searched regulon are shown for all cell subpopulations in each disease state of each tissue based on the regulon specific score inferred using pySCENIC and by calculating the average expression. |
| Page: 1 |
Top |
Somatic mutation of malignant transformation related genes |
| Annotation of somatic variants for genes involved in malignant transformation |
| Hugo Symbol | Variant Class | Variant Classification | dbSNP RS | HGVSc | HGVSp | HGVSp Short | SWISSPROT | BIOTYPE | SIFT | PolyPhen | Tumor Sample Barcode | Tissue | Histology | Sex | Age | Stage | Therapy Types | Drugs | Outcome |
| SKAP2 | SNV | Missense_Mutation | c.682N>A | p.Glu228Lys | p.E228K | O75563 | protein_coding | deleterious(0.04) | possibly_damaging(0.836) | TCGA-AC-A23H-01 | Breast | breast invasive carcinoma | Female | >=65 | I/II | Unknown | Unknown | PD | |
| SKAP2 | SNV | Missense_Mutation | novel | c.773N>G | p.Asp258Gly | p.D258G | O75563 | protein_coding | tolerated(0.09) | possibly_damaging(0.62) | TCGA-AO-A128-01 | Breast | breast invasive carcinoma | Female | <65 | I/II | Chemotherapy | doxorubicin | SD |
| SKAP2 | SNV | Missense_Mutation | c.406N>C | p.Glu136Gln | p.E136Q | O75563 | protein_coding | deleterious(0) | probably_damaging(0.967) | TCGA-D8-A1JA-01 | Breast | breast invasive carcinoma | Female | <65 | III/IV | Chemotherapy | adriamycin | PD | |
| SKAP2 | SNV | Missense_Mutation | c.302N>T | p.Ser101Phe | p.S101F | O75563 | protein_coding | deleterious(0.04) | benign(0.07) | TCGA-DG-A2KM-01 | Cervix | cervical & endocervical cancer | Female | <65 | I/II | Chemotherapy | cisplatin | SD | |
| SKAP2 | SNV | Missense_Mutation | c.770N>T | p.Asp257Val | p.D257V | O75563 | protein_coding | deleterious(0.01) | possibly_damaging(0.503) | TCGA-AA-3848-01 | Colorectum | colon adenocarcinoma | Female | >=65 | III/IV | Unknown | Unknown | PD | |
| SKAP2 | SNV | Missense_Mutation | c.160N>T | p.Asp54Tyr | p.D54Y | O75563 | protein_coding | deleterious(0.02) | possibly_damaging(0.872) | TCGA-AZ-4315-01 | Colorectum | colon adenocarcinoma | Male | <65 | I/II | Unknown | Unknown | SD | |
| SKAP2 | SNV | Missense_Mutation | c.157N>C | p.Lys53Gln | p.K53Q | O75563 | protein_coding | tolerated(0.73) | possibly_damaging(0.883) | TCGA-CA-6718-01 | Colorectum | colon adenocarcinoma | Male | <65 | I/II | Unknown | Unknown | PD | |
| SKAP2 | SNV | Missense_Mutation | c.423G>T | p.Trp141Cys | p.W141C | O75563 | protein_coding | deleterious(0) | probably_damaging(0.999) | TCGA-AG-A026-01 | Colorectum | rectum adenocarcinoma | Male | >=65 | I/II | Unknown | Unknown | PD | |
| SKAP2 | SNV | Missense_Mutation | novel | c.106A>C | p.Asn36His | p.N36H | O75563 | protein_coding | deleterious(0) | possibly_damaging(0.905) | TCGA-F5-6814-01 | Colorectum | rectum adenocarcinoma | Male | <65 | I/II | Unknown | Unknown | SD |
| SKAP2 | SNV | Missense_Mutation | novel | c.601G>A | p.Ala201Thr | p.A201T | O75563 | protein_coding | deleterious(0) | probably_damaging(1) | TCGA-A5-A1OF-01 | Endometrium | uterine corpus endometrioid carcinoma | Female | <65 | I/II | Unknown | Unknown | SD |
| Page: 1 2 3 4 |
Top |
Related drugs of malignant transformation related genes |
| Identification of chemicals and drugs interact with genes involved in malignant transfromation |
| (DGIdb 4.0) |
| Entrez ID | Symbol | Category | Interaction Types | Drug Claim Name | Drug Name | PMIDs |
| Page: 1 |

Copyright 2023-Present -The University of Texas Health Science Center at Houston |