
|
|||||
|
 | |
| |
| |
| |
| |
| |
|
Gene: SKAP1 |
Gene summary for SKAP1 |
| Gene information | Species | Human | Gene symbol | SKAP1 | Gene ID | 8631 |
| Gene name | src kinase associated phosphoprotein 1 | |
| Gene Alias | HEL-S-81p | |
| Cytomap | 17q21.32 | |
| Gene Type | protein-coding | GO ID | GO:0001952 | UniProtAcc | Q86WV1 |
Top |
Malignant transformation analysis |
| Identification of the aberrant gene expression in precancerous and cancerous lesions by comparing the gene expression of stem-like cells in diseased tissues with normal stem cells |
| Entrez ID | Symbol | Replicates | Species | Organ | Tissue | Adj P-value | Log2FC | Malignancy |
| 8631 | SKAP1 | HTA11_1938_2000001011 | Human | Colorectum | AD | 4.82e-05 | 2.64e-01 | -0.0811 |
| 8631 | SKAP1 | HTA11_78_2000001011 | Human | Colorectum | AD | 3.56e-04 | 2.53e-01 | -0.1088 |
| 8631 | SKAP1 | HTA11_6818_2000001021 | Human | Colorectum | AD | 7.48e-25 | 8.70e-01 | 0.0588 |
| 8631 | SKAP1 | HTA11_99999965062_69753 | Human | Colorectum | MSI-H | 1.80e-15 | 1.80e+00 | 0.3487 |
| 8631 | SKAP1 | HTA11_99999965104_69814 | Human | Colorectum | MSS | 2.51e-04 | 3.15e-01 | 0.281 |
| 8631 | SKAP1 | HTA11_99999971662_82457 | Human | Colorectum | MSS | 2.17e-05 | 2.46e-01 | 0.3859 |
| 8631 | SKAP1 | A001-C-207 | Human | Colorectum | FAP | 1.15e-02 | 2.63e-01 | 0.1278 |
| 8631 | SKAP1 | A015-C-204 | Human | Colorectum | FAP | 2.76e-02 | 2.66e-01 | -0.0228 |
| 8631 | SKAP1 | A001-C-119 | Human | Colorectum | FAP | 4.45e-03 | 2.85e-01 | -0.1557 |
| 8631 | SKAP1 | A001-C-104 | Human | Colorectum | FAP | 5.11e-05 | 4.17e-01 | 0.0184 |
| 8631 | SKAP1 | A015-C-006 | Human | Colorectum | FAP | 2.96e-05 | 4.20e-01 | -0.0994 |
| 8631 | SKAP1 | CRC-1-8810 | Human | Colorectum | CRC | 9.66e-28 | 7.82e-01 | 0.6257 |
| 8631 | SKAP1 | AEH-subject1 | Human | Endometrium | AEH | 1.38e-12 | 4.82e-01 | -0.3059 |
| 8631 | SKAP1 | AEH-subject3 | Human | Endometrium | AEH | 1.83e-08 | 4.22e-01 | -0.2576 |
| 8631 | SKAP1 | AEH-subject4 | Human | Endometrium | AEH | 6.80e-07 | 3.76e-01 | -0.2657 |
| 8631 | SKAP1 | EEC-subject4 | Human | Endometrium | EEC | 3.90e-26 | 7.32e-01 | -0.2571 |
| 8631 | SKAP1 | GSM5276935 | Human | Endometrium | EEC | 7.40e-03 | -7.38e-02 | -0.123 |
| 8631 | SKAP1 | GSM6177620_NYU_UCEC1_lib1_lib1 | Human | Endometrium | EEC | 1.18e-02 | -4.85e-02 | -0.1869 |
| 8631 | SKAP1 | GSM6177621_NYU_UCEC2_lib1_lib1 | Human | Endometrium | EEC | 2.33e-03 | -4.58e-02 | -0.1934 |
| 8631 | SKAP1 | GSM6177622_NYU_UCEC3_lib1_lib1 | Human | Endometrium | EEC | 7.40e-03 | -7.51e-02 | -0.1917 |
| Page: 1 |
| Tissue | Expression Dynamics | Abbreviation |
| Colorectum (GSE201348) |  | FAP: Familial adenomatous polyposis |
| CRC: Colorectal cancer | ||
| Colorectum (HTA11) | 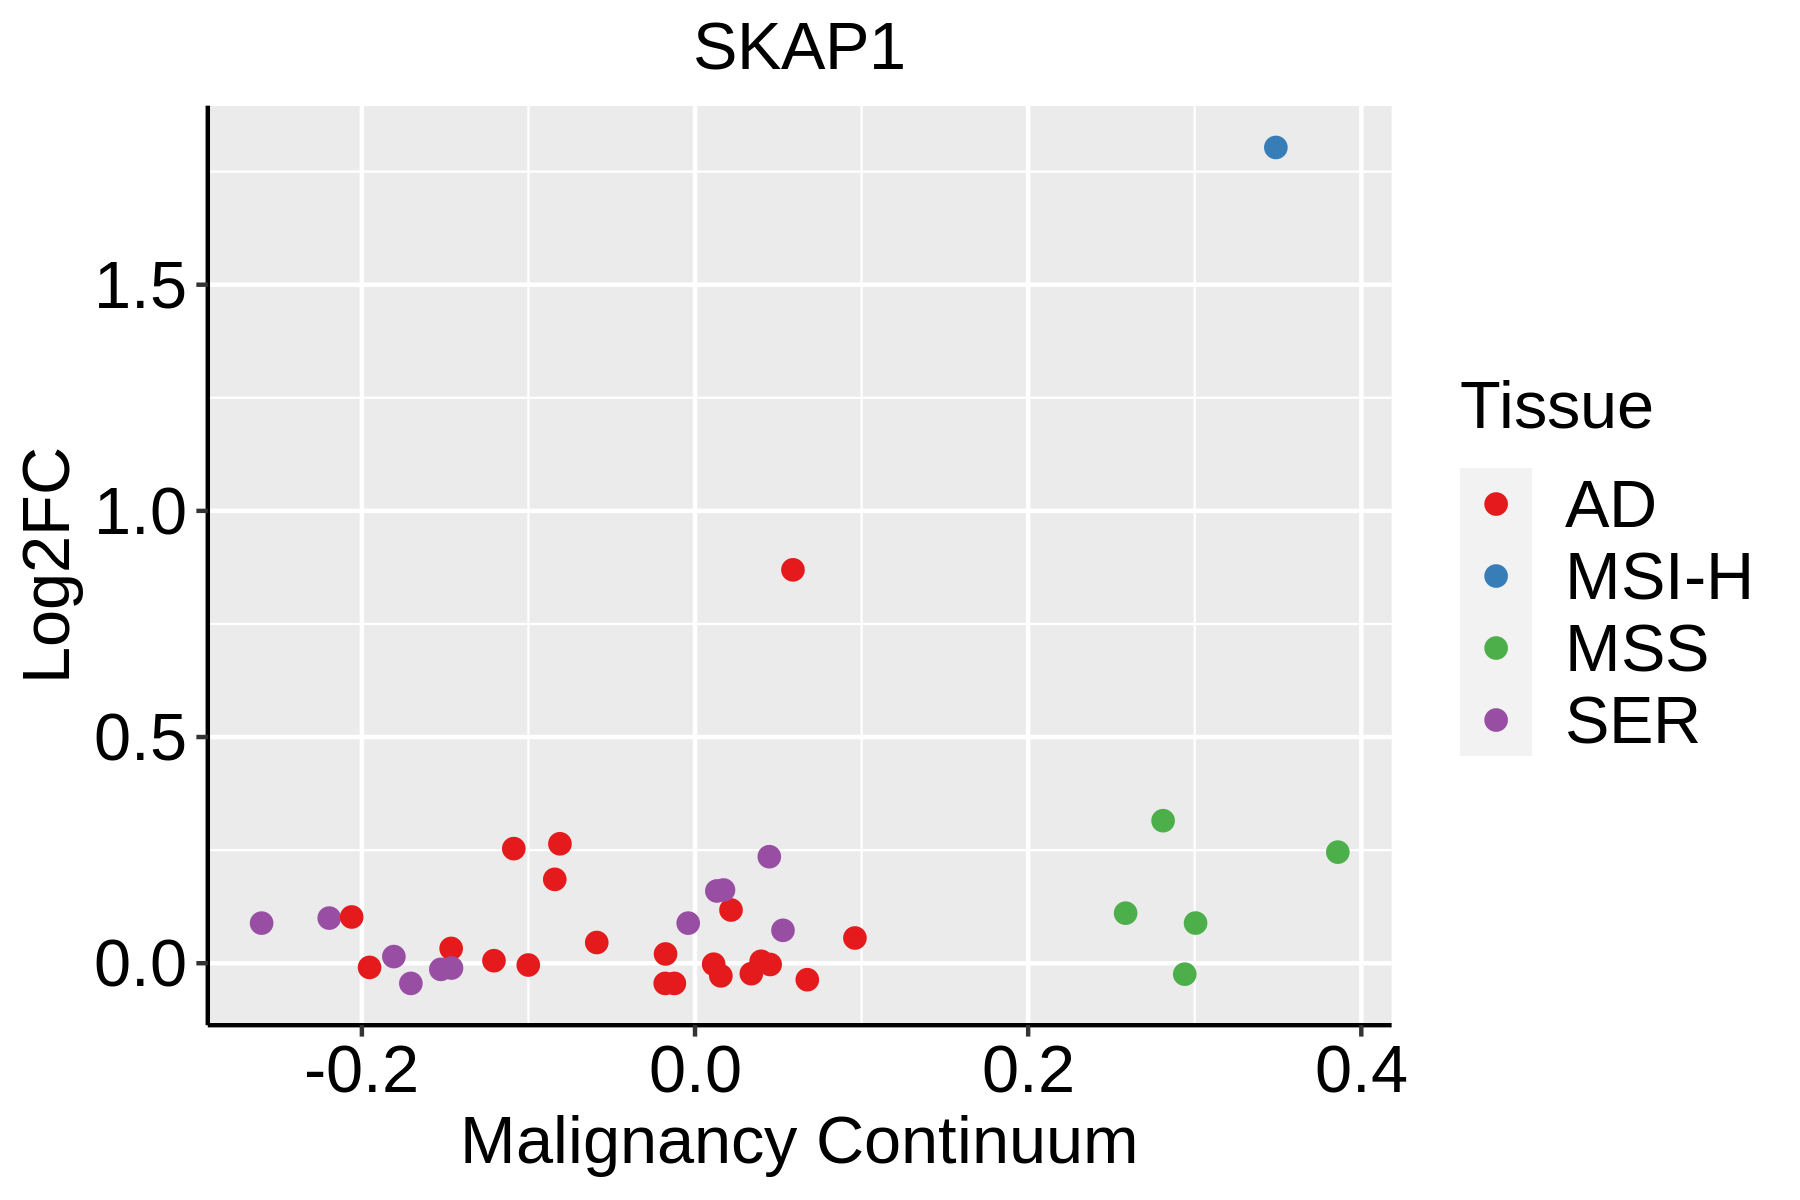 | AD: Adenomas |
| SER: Sessile serrated lesions | ||
| MSI-H: Microsatellite-high colorectal cancer | ||
| MSS: Microsatellite stable colorectal cancer | ||
| Endometrium | 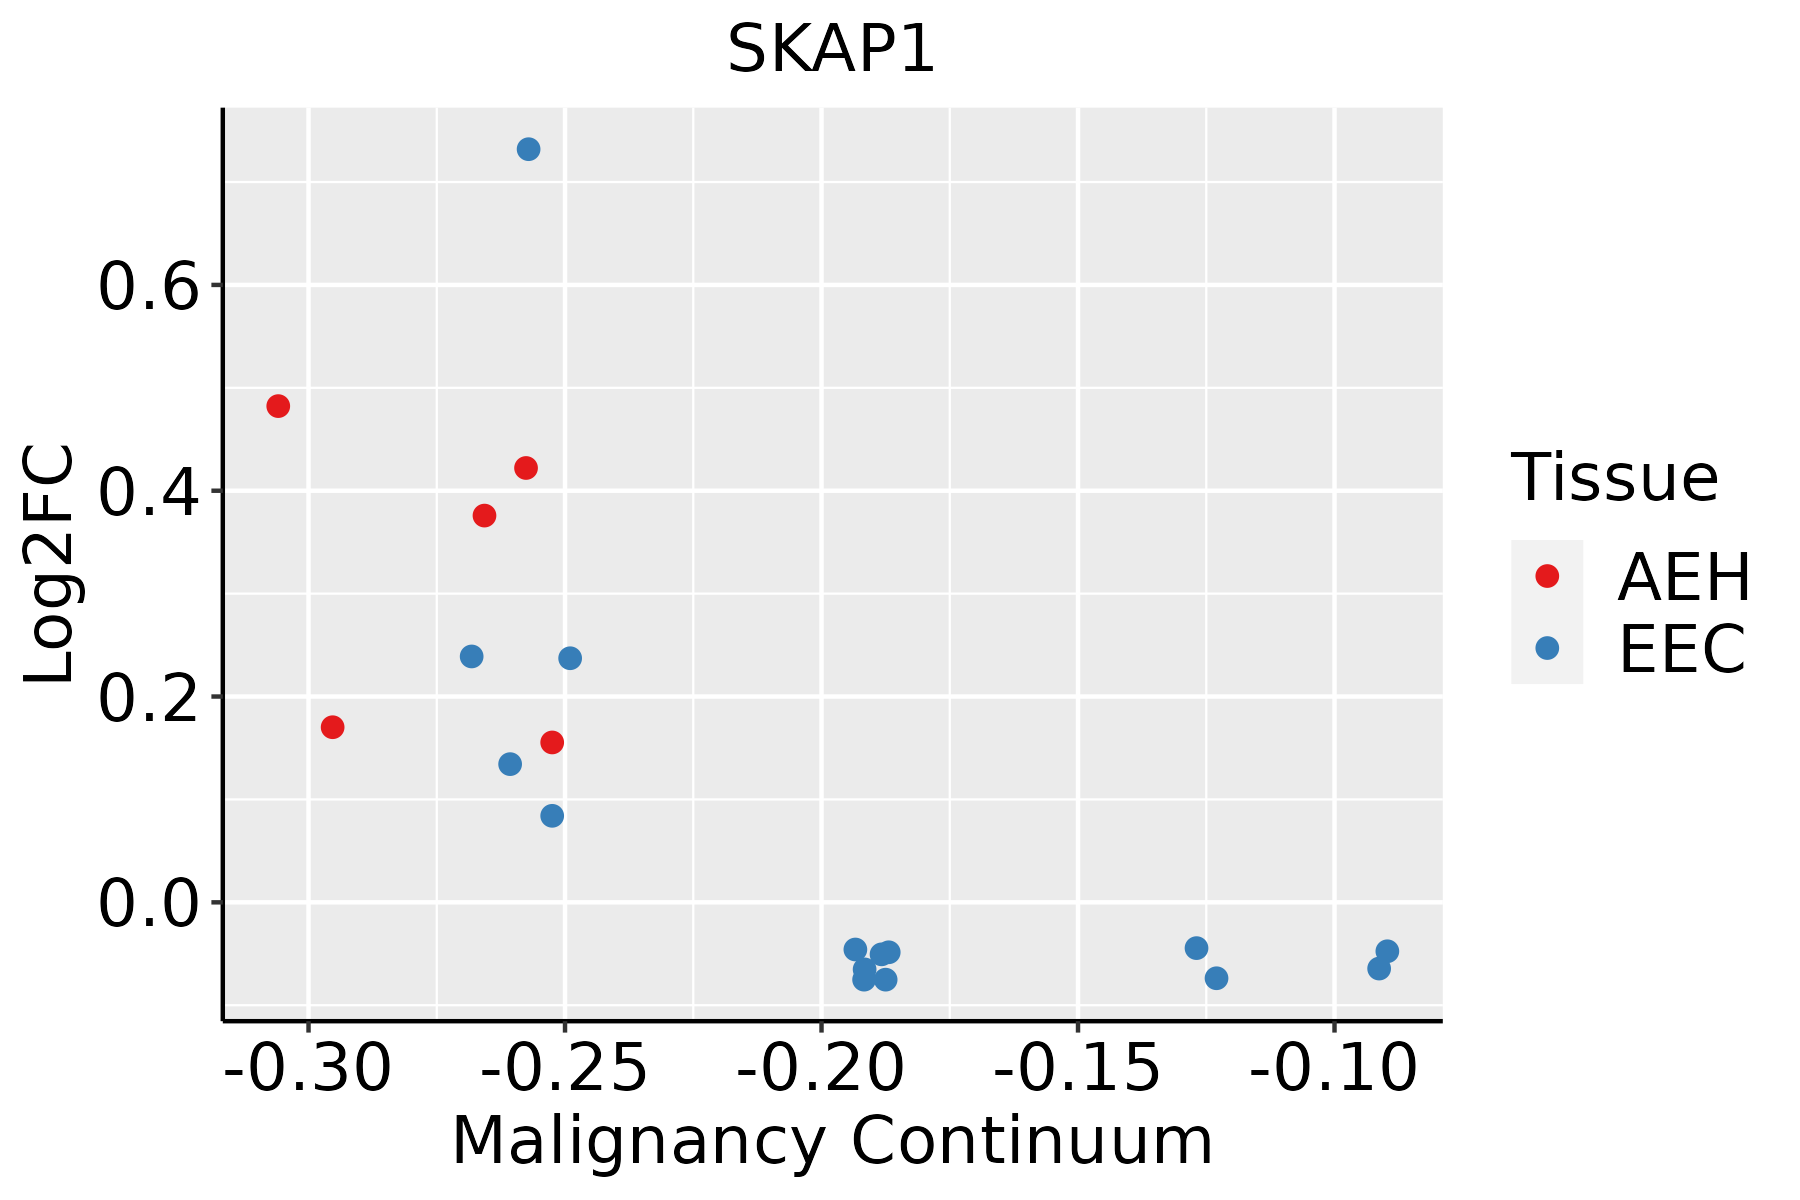 | AEH: Atypical endometrial hyperplasia |
| EEC: Endometrioid Cancer |
| ∗log2FC in expression of this searched gene in stem-like cells from each diseased tissue sample relative to stem-like cells in normal samples in each tissue plotted against the malignancy continuum. Samples are colored based on if they are from different disease stage. |
Top |
Malignant transformation related pathway analysis |
| Find out the enriched GO biological processes and KEGG pathways involved in transition from healthy to precancer to cancer |
| Tissue | Disease Stage | Enriched GO biological Processes |
| Colorectum | AD |  |
| Colorectum | SER |  |
| Colorectum | MSS |  |
| Colorectum | MSI-H |  |
| Colorectum | FAP |  |
| ∗Top 15 enriched GO BP terms are showed in the bar plot of each disease state in each tissue. Each row represents a significant GO biological process which is colored according to the -log10(p.adjust). |
| Page: 1 2 3 4 5 6 7 8 9 |
| GO ID | Tissue | Disease Stage | Description | Gene Ratio | Bg Ratio | pvalue | p.adjust | Count |
| GO:0072659 | Colorectum | AD | protein localization to plasma membrane | 122/3918 | 284/18723 | 2.86e-17 | 1.49e-14 | 122 |
| GO:1990778 | Colorectum | AD | protein localization to cell periphery | 129/3918 | 333/18723 | 5.51e-14 | 1.15e-11 | 129 |
| GO:0043254 | Colorectum | AD | regulation of protein-containing complex assembly | 148/3918 | 428/18723 | 2.64e-11 | 3.18e-09 | 148 |
| GO:0031334 | Colorectum | AD | positive regulation of protein-containing complex assembly | 91/3918 | 237/18723 | 4.78e-10 | 3.99e-08 | 91 |
| GO:0010811 | Colorectum | AD | positive regulation of cell-substrate adhesion | 53/3918 | 123/18723 | 2.30e-08 | 1.27e-06 | 53 |
| GO:0010810 | Colorectum | AD | regulation of cell-substrate adhesion | 81/3918 | 221/18723 | 4.80e-08 | 2.55e-06 | 81 |
| GO:0031589 | Colorectum | AD | cell-substrate adhesion | 116/3918 | 363/18723 | 4.68e-07 | 1.76e-05 | 116 |
| GO:0001952 | Colorectum | AD | regulation of cell-matrix adhesion | 50/3918 | 128/18723 | 2.05e-06 | 6.05e-05 | 50 |
| GO:0001954 | Colorectum | AD | positive regulation of cell-matrix adhesion | 27/3918 | 58/18723 | 1.12e-05 | 2.55e-04 | 27 |
| GO:0007160 | Colorectum | AD | cell-matrix adhesion | 75/3918 | 233/18723 | 3.56e-05 | 6.45e-04 | 75 |
| GO:0045785 | Colorectum | AD | positive regulation of cell adhesion | 122/3918 | 437/18723 | 2.65e-04 | 3.28e-03 | 122 |
| GO:00726592 | Colorectum | MSS | protein localization to plasma membrane | 113/3467 | 284/18723 | 3.23e-17 | 1.55e-14 | 113 |
| GO:19907782 | Colorectum | MSS | protein localization to cell periphery | 120/3467 | 333/18723 | 2.02e-14 | 5.47e-12 | 120 |
| GO:00432542 | Colorectum | MSS | regulation of protein-containing complex assembly | 130/3467 | 428/18723 | 1.38e-09 | 1.03e-07 | 130 |
| GO:00313342 | Colorectum | MSS | positive regulation of protein-containing complex assembly | 82/3467 | 237/18723 | 2.49e-09 | 1.75e-07 | 82 |
| GO:00108102 | Colorectum | MSS | regulation of cell-substrate adhesion | 73/3467 | 221/18723 | 1.56e-07 | 7.16e-06 | 73 |
| GO:00108112 | Colorectum | MSS | positive regulation of cell-substrate adhesion | 47/3467 | 123/18723 | 2.28e-07 | 9.79e-06 | 47 |
| GO:00315892 | Colorectum | MSS | cell-substrate adhesion | 104/3467 | 363/18723 | 1.35e-06 | 4.51e-05 | 104 |
| GO:00019522 | Colorectum | MSS | regulation of cell-matrix adhesion | 45/3467 | 128/18723 | 5.75e-06 | 1.53e-04 | 45 |
| GO:00019542 | Colorectum | MSS | positive regulation of cell-matrix adhesion | 23/3467 | 58/18723 | 1.39e-04 | 2.06e-03 | 23 |
| Page: 1 2 3 4 5 |
| Pathway ID | Tissue | Disease Stage | Description | Gene Ratio | Bg Ratio | pvalue | p.adjust | qvalue | Count |
| hsa04015 | Colorectum | AD | Rap1 signaling pathway | 71/2092 | 210/8465 | 1.72e-03 | 9.68e-03 | 6.18e-03 | 71 |
| hsa040151 | Colorectum | AD | Rap1 signaling pathway | 71/2092 | 210/8465 | 1.72e-03 | 9.68e-03 | 6.18e-03 | 71 |
| hsa040154 | Colorectum | MSS | Rap1 signaling pathway | 66/1875 | 210/8465 | 1.03e-03 | 5.94e-03 | 3.64e-03 | 66 |
| hsa040155 | Colorectum | MSS | Rap1 signaling pathway | 66/1875 | 210/8465 | 1.03e-03 | 5.94e-03 | 3.64e-03 | 66 |
| hsa040156 | Colorectum | FAP | Rap1 signaling pathway | 53/1404 | 210/8465 | 7.93e-04 | 5.14e-03 | 3.13e-03 | 53 |
| hsa040157 | Colorectum | FAP | Rap1 signaling pathway | 53/1404 | 210/8465 | 7.93e-04 | 5.14e-03 | 3.13e-03 | 53 |
| hsa040158 | Colorectum | CRC | Rap1 signaling pathway | 48/1091 | 210/8465 | 4.00e-05 | 8.70e-04 | 5.90e-04 | 48 |
| hsa040159 | Colorectum | CRC | Rap1 signaling pathway | 48/1091 | 210/8465 | 4.00e-05 | 8.70e-04 | 5.90e-04 | 48 |
| hsa0401514 | Endometrium | AEH | Rap1 signaling pathway | 49/1197 | 210/8465 | 2.03e-04 | 1.78e-03 | 1.30e-03 | 49 |
| hsa0401515 | Endometrium | AEH | Rap1 signaling pathway | 49/1197 | 210/8465 | 2.03e-04 | 1.78e-03 | 1.30e-03 | 49 |
| Page: 1 |
Top |
Cell-cell communication analysis |
| Identification of potential cell-cell interactions between two cell types and their ligand-receptor pairs for different disease states |
| Ligand | Receptor | LRpair | Pathway | Tissue | Disease Stage |
| Page: 1 |
Top |
Single-cell gene regulatory network inference analysis |
| Find out the significant the regulons (TFs) and the target genes of each regulon across cell types for different disease states |
| TF | Cell Type | Tissue | Disease Stage | Target Gene | RSS | Regulon Activity |
| ∗The dot plots of a searched regulon are shown for all cell subpopulations in each disease state of each tissue based on the regulon specific score inferred using pySCENIC and by calculating the average expression. |
| Page: 1 |
Top |
Somatic mutation of malignant transformation related genes |
| Annotation of somatic variants for genes involved in malignant transformation |
| Hugo Symbol | Variant Class | Variant Classification | dbSNP RS | HGVSc | HGVSp | HGVSp Short | SWISSPROT | BIOTYPE | SIFT | PolyPhen | Tumor Sample Barcode | Tissue | Histology | Sex | Age | Stage | Therapy Types | Drugs | Outcome |
| SKAP1 | SNV | Missense_Mutation | c.934N>A | p.Glu312Lys | p.E312K | Q86WV1 | protein_coding | deleterious(0) | probably_damaging(0.998) | TCGA-C5-A1BJ-01 | Cervix | cervical & endocervical cancer | Female | <65 | I/II | Unknown | Unknown | SD | |
| SKAP1 | SNV | Missense_Mutation | c.488N>A | p.Arg163Gln | p.R163Q | Q86WV1 | protein_coding | tolerated(0.4) | benign(0.006) | TCGA-JW-A852-01 | Cervix | cervical & endocervical cancer | Female | <65 | I/II | Unknown | Unknown | PD | |
| SKAP1 | SNV | Missense_Mutation | c.8N>T | p.Ala3Val | p.A3V | Q86WV1 | protein_coding | deleterious(0.02) | possibly_damaging(0.815) | TCGA-A6-6653-01 | Colorectum | colon adenocarcinoma | Male | >=65 | I/II | Unknown | Unknown | SD | |
| SKAP1 | SNV | Missense_Mutation | c.497C>T | p.Pro166Leu | p.P166L | Q86WV1 | protein_coding | tolerated(0.25) | benign(0.29) | TCGA-AA-3662-01 | Colorectum | colon adenocarcinoma | Female | >=65 | III/IV | Chemotherapy | capecitabine | PR | |
| SKAP1 | SNV | Missense_Mutation | rs573034197 | c.487N>T | p.Arg163Trp | p.R163W | Q86WV1 | protein_coding | deleterious(0) | probably_damaging(0.917) | TCGA-AY-5543-01 | Colorectum | colon adenocarcinoma | Female | >=65 | I/II | Chemotherapy | oxaliplatin | SD |
| SKAP1 | SNV | Missense_Mutation | rs573034197 | c.487N>T | p.Arg163Trp | p.R163W | Q86WV1 | protein_coding | deleterious(0) | probably_damaging(0.917) | TCGA-WS-AB45-01 | Colorectum | colon adenocarcinoma | Female | <65 | I/II | Unknown | Unknown | SD |
| SKAP1 | SNV | Missense_Mutation | rs368601769 | c.377N>T | p.Ser126Leu | p.S126L | Q86WV1 | protein_coding | tolerated(0.1) | probably_damaging(0.964) | TCGA-AF-2687-01 | Colorectum | rectum adenocarcinoma | Male | <65 | III/IV | Chemotherapy | xeloda | PD |
| SKAP1 | SNV | Missense_Mutation | novel | c.218N>T | p.Ser73Ile | p.S73I | Q86WV1 | protein_coding | deleterious(0.01) | probably_damaging(0.994) | TCGA-A5-A0G2-01 | Endometrium | uterine corpus endometrioid carcinoma | Female | <65 | III/IV | Unknown | Unknown | SD |
| SKAP1 | SNV | Missense_Mutation | novel | c.1058N>A | p.Ala353Asp | p.A353D | Q86WV1 | protein_coding | deleterious(0.03) | probably_damaging(0.96) | TCGA-A5-A1OF-01 | Endometrium | uterine corpus endometrioid carcinoma | Female | <65 | I/II | Unknown | Unknown | SD |
| SKAP1 | SNV | Missense_Mutation | c.215A>C | p.His72Pro | p.H72P | Q86WV1 | protein_coding | tolerated(0.25) | benign(0) | TCGA-AP-A0LM-01 | Endometrium | uterine corpus endometrioid carcinoma | Female | <65 | III/IV | Chemotherapy | cisplatin | SD |
| Page: 1 2 3 4 |
Top |
Related drugs of malignant transformation related genes |
| Identification of chemicals and drugs interact with genes involved in malignant transfromation |
| (DGIdb 4.0) |
| Entrez ID | Symbol | Category | Interaction Types | Drug Claim Name | Drug Name | PMIDs |
| Page: 1 |

Copyright 2023-Present -The University of Texas Health Science Center at Houston |