
|
|||||
|
 | |
| |
| |
| |
| |
| |
|
Gene: SKA3 |
Gene summary for SKA3 |
| Gene information | Species | Human | Gene symbol | SKA3 | Gene ID | 221150 |
| Gene name | spindle and kinetochore associated complex subunit 3 | |
| Gene Alias | C13orf3 | |
| Cytomap | 13q12.11 | |
| Gene Type | protein-coding | GO ID | GO:0000226 | UniProtAcc | Q8IX90 |
Top |
Malignant transformation analysis |
| Identification of the aberrant gene expression in precancerous and cancerous lesions by comparing the gene expression of stem-like cells in diseased tissues with normal stem cells |
| Entrez ID | Symbol | Replicates | Species | Organ | Tissue | Adj P-value | Log2FC | Malignancy |
| 221150 | SKA3 | P2T-E | Human | Esophagus | ESCC | 4.93e-04 | 1.58e-01 | 0.1177 |
| 221150 | SKA3 | P10T-E | Human | Esophagus | ESCC | 8.01e-03 | 1.25e-01 | 0.116 |
| 221150 | SKA3 | P21T-E | Human | Esophagus | ESCC | 4.55e-05 | 2.33e-01 | 0.1617 |
| 221150 | SKA3 | P24T-E | Human | Esophagus | ESCC | 4.07e-05 | 1.99e-01 | 0.1287 |
| 221150 | SKA3 | P28T-E | Human | Esophagus | ESCC | 8.93e-04 | 8.15e-02 | 0.1149 |
| 221150 | SKA3 | P31T-E | Human | Esophagus | ESCC | 3.10e-04 | 1.33e-01 | 0.1251 |
| 221150 | SKA3 | P32T-E | Human | Esophagus | ESCC | 2.60e-07 | 1.67e-01 | 0.1666 |
| 221150 | SKA3 | P49T-E | Human | Esophagus | ESCC | 4.51e-03 | 5.16e-01 | 0.1768 |
| 221150 | SKA3 | P52T-E | Human | Esophagus | ESCC | 1.57e-06 | 1.07e-01 | 0.1555 |
| 221150 | SKA3 | P74T-E | Human | Esophagus | ESCC | 1.69e-03 | 1.57e-01 | 0.1479 |
| 221150 | SKA3 | P76T-E | Human | Esophagus | ESCC | 8.18e-03 | 1.13e-01 | 0.1207 |
| 221150 | SKA3 | P79T-E | Human | Esophagus | ESCC | 4.49e-04 | 1.82e-01 | 0.1154 |
| 221150 | SKA3 | P83T-E | Human | Esophagus | ESCC | 1.60e-03 | 2.68e-01 | 0.1738 |
| 221150 | SKA3 | P89T-E | Human | Esophagus | ESCC | 2.86e-02 | 3.43e-01 | 0.1752 |
| 221150 | SKA3 | P91T-E | Human | Esophagus | ESCC | 3.30e-05 | 8.05e-01 | 0.1828 |
| 221150 | SKA3 | P107T-E | Human | Esophagus | ESCC | 6.96e-08 | 2.65e-01 | 0.171 |
| 221150 | SKA3 | P130T-E | Human | Esophagus | ESCC | 3.54e-10 | 3.04e-01 | 0.1676 |
| Page: 1 |
| Tissue | Expression Dynamics | Abbreviation |
| Esophagus | 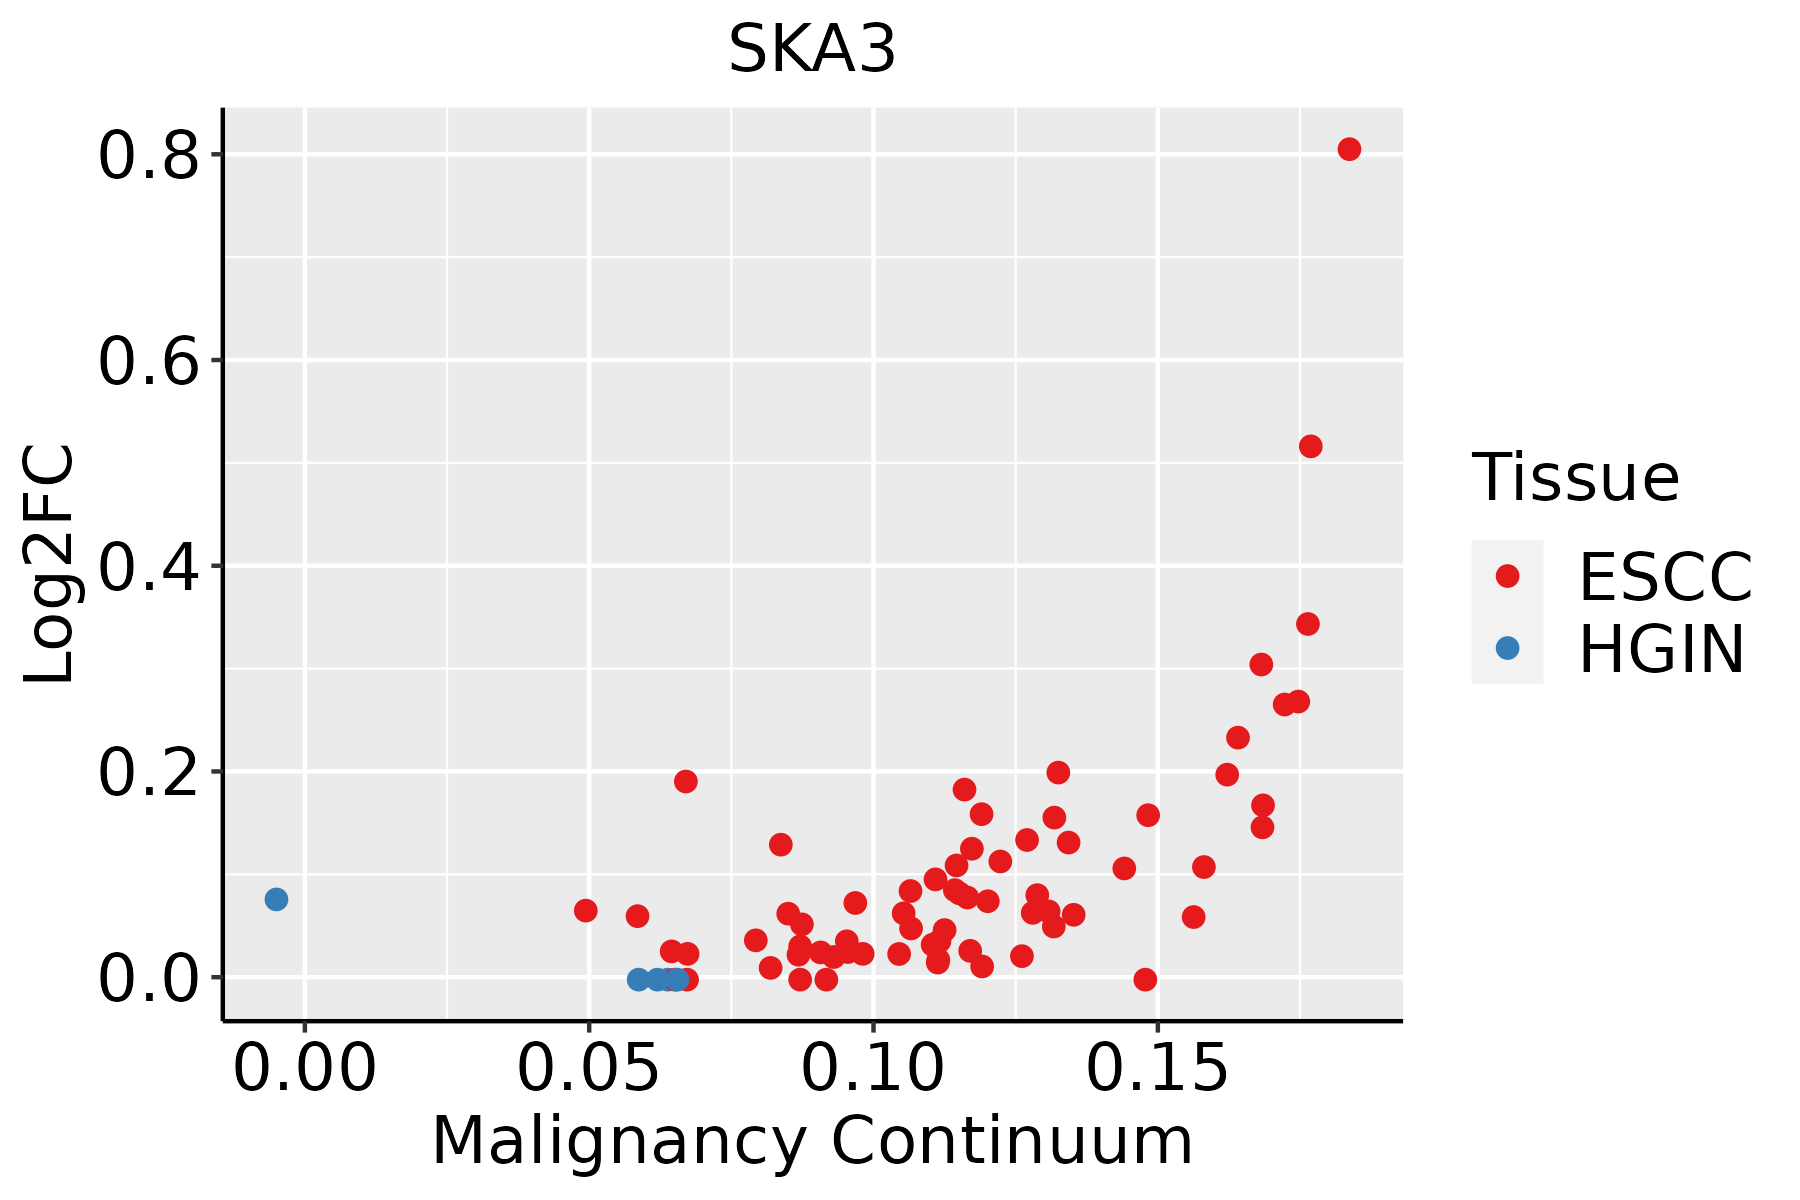 | ESCC: Esophageal squamous cell carcinoma |
| HGIN: High-grade intraepithelial neoplasias | ||
| LGIN: Low-grade intraepithelial neoplasias |
| ∗log2FC in expression of this searched gene in stem-like cells from each diseased tissue sample relative to stem-like cells in normal samples in each tissue plotted against the malignancy continuum. Samples are colored based on if they are from different disease stage. |
Top |
Malignant transformation related pathway analysis |
| Find out the enriched GO biological processes and KEGG pathways involved in transition from healthy to precancer to cancer |
| Tissue | Disease Stage | Enriched GO biological Processes |
| Colorectum | AD |  |
| Colorectum | SER |  |
| Colorectum | MSS |  |
| Colorectum | MSI-H |  |
| Colorectum | FAP |  |
| ∗Top 15 enriched GO BP terms are showed in the bar plot of each disease state in each tissue. Each row represents a significant GO biological process which is colored according to the -log10(p.adjust). |
| Page: 1 2 3 4 5 6 7 8 9 |
| GO ID | Tissue | Disease Stage | Description | Gene Ratio | Bg Ratio | pvalue | p.adjust | Count |
| GO:000705911 | Esophagus | ESCC | chromosome segregation | 238/8552 | 346/18723 | 1.72e-18 | 1.82e-16 | 238 |
| GO:00705078 | Esophagus | ESCC | regulation of microtubule cytoskeleton organization | 99/8552 | 148/18723 | 1.43e-07 | 2.29e-06 | 99 |
| GO:00311094 | Esophagus | ESCC | microtubule polymerization or depolymerization | 77/8552 | 122/18723 | 7.60e-05 | 5.68e-04 | 77 |
| GO:00311104 | Esophagus | ESCC | regulation of microtubule polymerization or depolymerization | 57/8552 | 88/18723 | 2.32e-04 | 1.44e-03 | 57 |
| GO:00328864 | Esophagus | ESCC | regulation of microtubule-based process | 134/8552 | 240/18723 | 9.44e-04 | 4.80e-03 | 134 |
| Page: 1 |
| Pathway ID | Tissue | Disease Stage | Description | Gene Ratio | Bg Ratio | pvalue | p.adjust | qvalue | Count |
| Page: 1 |
Top |
Cell-cell communication analysis |
| Identification of potential cell-cell interactions between two cell types and their ligand-receptor pairs for different disease states |
| Ligand | Receptor | LRpair | Pathway | Tissue | Disease Stage |
| Page: 1 |
Top |
Single-cell gene regulatory network inference analysis |
| Find out the significant the regulons (TFs) and the target genes of each regulon across cell types for different disease states |
| TF | Cell Type | Tissue | Disease Stage | Target Gene | RSS | Regulon Activity |
| ∗The dot plots of a searched regulon are shown for all cell subpopulations in each disease state of each tissue based on the regulon specific score inferred using pySCENIC and by calculating the average expression. |
| Page: 1 |
Top |
Somatic mutation of malignant transformation related genes |
| Annotation of somatic variants for genes involved in malignant transformation |
| Hugo Symbol | Variant Class | Variant Classification | dbSNP RS | HGVSc | HGVSp | HGVSp Short | SWISSPROT | BIOTYPE | SIFT | PolyPhen | Tumor Sample Barcode | Tissue | Histology | Sex | Age | Stage | Therapy Types | Drugs | Outcome |
| SKA3 | SNV | Missense_Mutation | c.1231N>C | p.Glu411Gln | p.E411Q | Q8IX90 | protein_coding | deleterious(0) | probably_damaging(0.984) | TCGA-A8-A07R-01 | Breast | breast invasive carcinoma | Female | >=65 | III/IV | Ancillary | zoledronic | SD | |
| SKA3 | SNV | Missense_Mutation | novel | c.1034N>G | p.Ser345Cys | p.S345C | Q8IX90 | protein_coding | deleterious(0) | benign(0.062) | TCGA-BH-A18J-01 | Breast | breast invasive carcinoma | Female | <65 | III/IV | Unknown | Unknown | PD |
| SKA3 | SNV | Missense_Mutation | c.1085N>G | p.Pro362Arg | p.P362R | Q8IX90 | protein_coding | deleterious(0) | probably_damaging(1) | TCGA-BH-A1EV-01 | Breast | breast invasive carcinoma | Female | <65 | III/IV | Unknown | Unknown | PD | |
| SKA3 | insertion | Nonsense_Mutation | novel | c.467_468insCTTTCAGTATAGAGGTTTCTGAAGAATCTGATCCTGAG | p.Gln157PhefsTer7 | p.Q157Ffs*7 | Q8IX90 | protein_coding | TCGA-A8-A08H-01 | Breast | breast invasive carcinoma | Female | >=65 | I/II | Unknown | Unknown | SD | ||
| SKA3 | SNV | Missense_Mutation | c.640N>C | p.Glu214Gln | p.E214Q | Q8IX90 | protein_coding | deleterious(0.01) | probably_damaging(0.948) | TCGA-VS-A9UH-01 | Cervix | cervical & endocervical cancer | Female | <65 | I/II | Chemotherapy | cisplatin | CR | |
| SKA3 | SNV | Missense_Mutation | novel | c.1015N>C | p.Glu339Gln | p.E339Q | Q8IX90 | protein_coding | tolerated(0.15) | benign(0.066) | TCGA-ZJ-AAX8-01 | Cervix | cervical & endocervical cancer | Female | <65 | III/IV | Unknown | Unknown | SD |
| SKA3 | SNV | Missense_Mutation | c.683N>T | p.Tyr228Phe | p.Y228F | Q8IX90 | protein_coding | deleterious(0.01) | possibly_damaging(0.827) | TCGA-AA-3811-01 | Colorectum | colon adenocarcinoma | Female | >=65 | III/IV | Unknown | Unknown | PD | |
| SKA3 | SNV | Missense_Mutation | c.80G>T | p.Arg27Leu | p.R27L | Q8IX90 | protein_coding | deleterious(0.03) | benign(0.072) | TCGA-AD-6965-01 | Colorectum | colon adenocarcinoma | Male | <65 | III/IV | Chemotherapy | oxaliplatin | PD | |
| SKA3 | SNV | Missense_Mutation | c.747G>T | p.Glu249Asp | p.E249D | Q8IX90 | protein_coding | tolerated(0.31) | possibly_damaging(0.613) | TCGA-AZ-4615-01 | Colorectum | colon adenocarcinoma | Male | >=65 | III/IV | Chemotherapy | xeloda | PD | |
| SKA3 | SNV | Missense_Mutation | novel | c.434N>A | p.Ser145Asn | p.S145N | Q8IX90 | protein_coding | tolerated(0.18) | benign(0.003) | TCGA-AZ-6599-01 | Colorectum | colon adenocarcinoma | Male | >=65 | I/II | Unknown | Unknown | SD |
| Page: 1 2 3 4 5 6 |
Top |
Related drugs of malignant transformation related genes |
| Identification of chemicals and drugs interact with genes involved in malignant transfromation |
| (DGIdb 4.0) |
| Entrez ID | Symbol | Category | Interaction Types | Drug Claim Name | Drug Name | PMIDs |
| Page: 1 |

Copyright 2023-Present -The University of Texas Health Science Center at Houston |