
|
|||||
|
 | |
| |
| |
| |
| |
| |
|
Gene: SKA1 |
Gene summary for SKA1 |
| Gene information | Species | Human | Gene symbol | SKA1 | Gene ID | 220134 |
| Gene name | spindle and kinetochore associated complex subunit 1 | |
| Gene Alias | C18orf24 | |
| Cytomap | 18q21.1 | |
| Gene Type | protein-coding | GO ID | GO:0000226 | UniProtAcc | A0A024R294 |
Top |
Malignant transformation analysis |
| Identification of the aberrant gene expression in precancerous and cancerous lesions by comparing the gene expression of stem-like cells in diseased tissues with normal stem cells |
| Entrez ID | Symbol | Replicates | Species | Organ | Tissue | Adj P-value | Log2FC | Malignancy |
| 220134 | SKA1 | HCC1_Meng | Human | Liver | HCC | 2.30e-06 | 2.77e-02 | 0.0246 |
| 220134 | SKA1 | HCC1 | Human | Liver | HCC | 3.29e-07 | 1.38e+00 | 0.5336 |
| 220134 | SKA1 | HCC2 | Human | Liver | HCC | 2.33e-16 | 1.76e+00 | 0.5341 |
| 220134 | SKA1 | HCC5 | Human | Liver | HCC | 2.39e-14 | 6.66e-01 | 0.4932 |
| 220134 | SKA1 | S014 | Human | Liver | HCC | 1.27e-04 | 3.12e-01 | 0.2254 |
| 220134 | SKA1 | S016 | Human | Liver | HCC | 3.60e-05 | 1.77e-01 | 0.2243 |
| 220134 | SKA1 | S028 | Human | Liver | HCC | 1.64e-05 | 2.83e-01 | 0.2503 |
| 220134 | SKA1 | S029 | Human | Liver | HCC | 5.90e-03 | 2.68e-01 | 0.2581 |
| Page: 1 |
| Tissue | Expression Dynamics | Abbreviation |
| Liver | 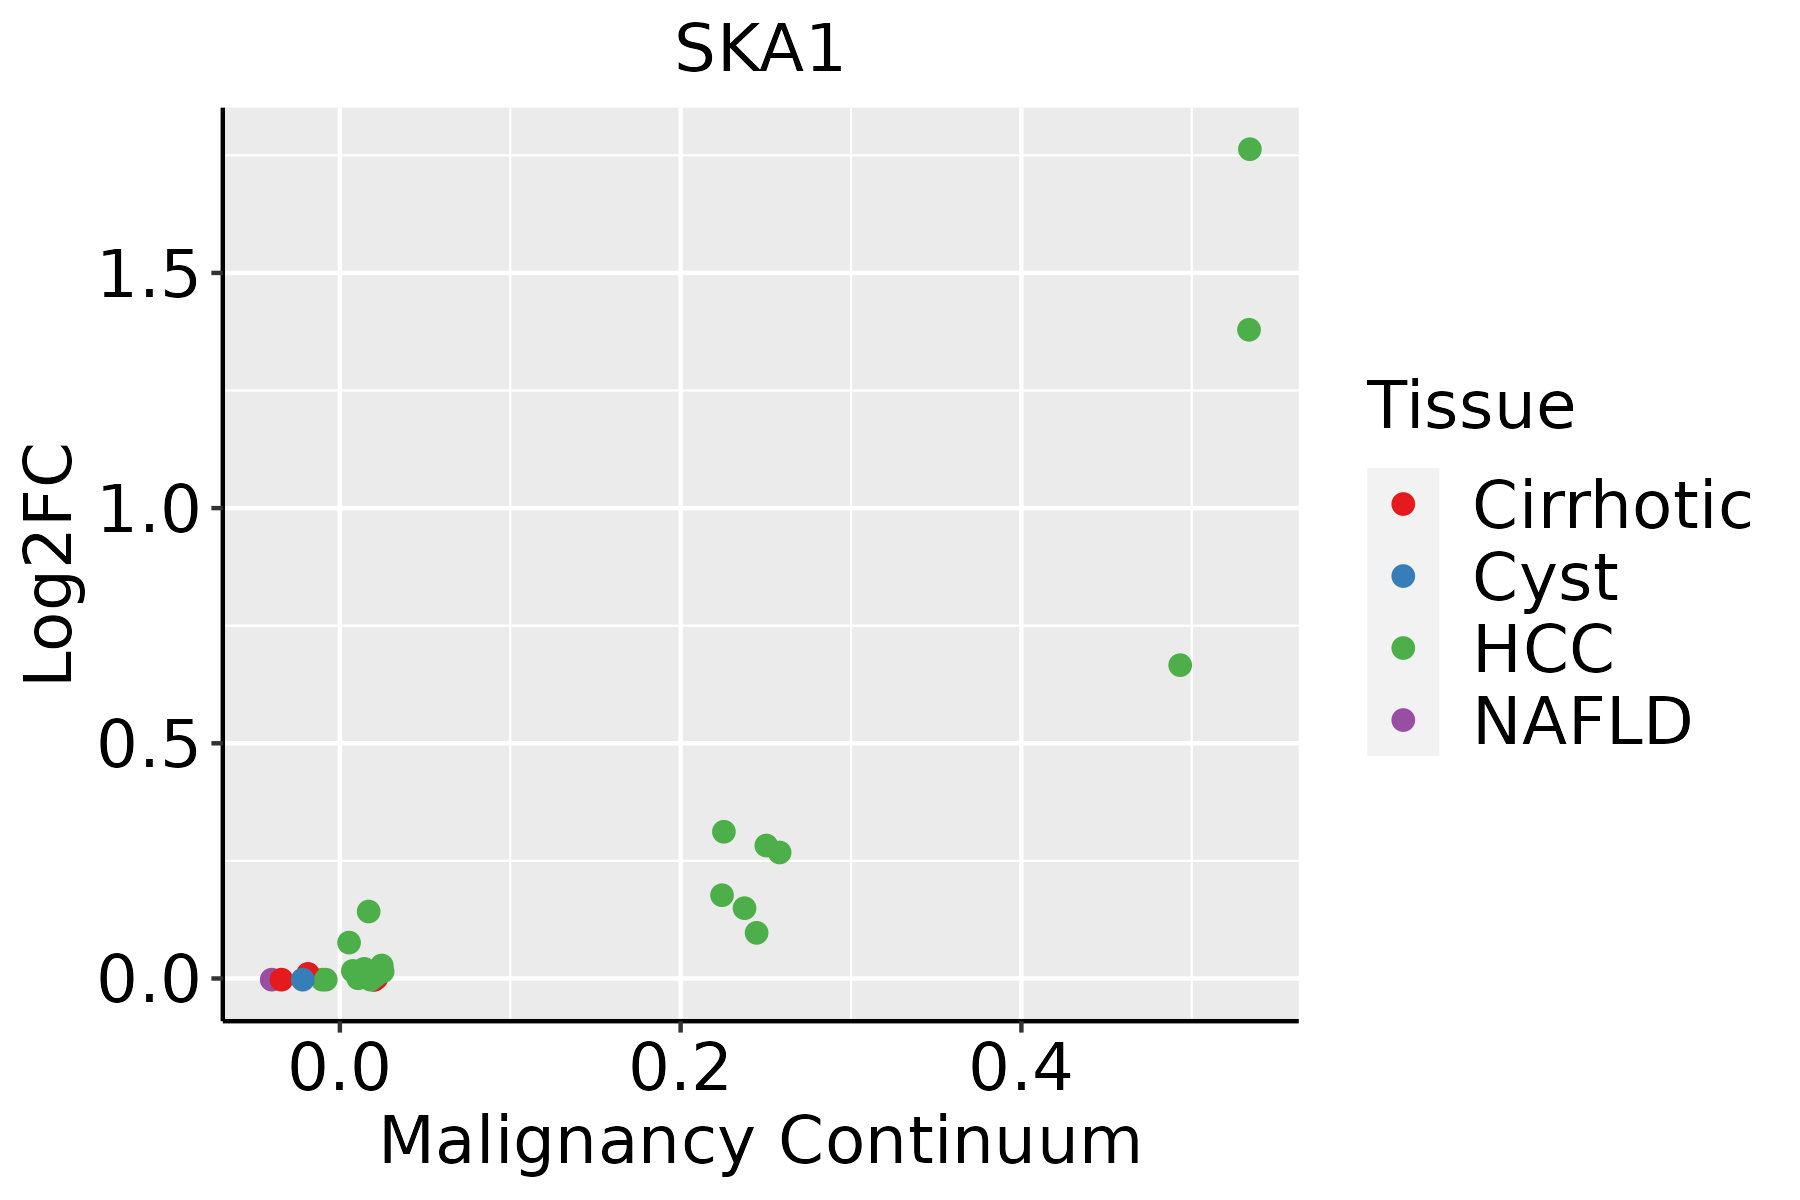 | HCC: Hepatocellular carcinoma |
| NAFLD: Non-alcoholic fatty liver disease |
| ∗log2FC in expression of this searched gene in stem-like cells from each diseased tissue sample relative to stem-like cells in normal samples in each tissue plotted against the malignancy continuum. Samples are colored based on if they are from different disease stage. |
Top |
Malignant transformation related pathway analysis |
| Find out the enriched GO biological processes and KEGG pathways involved in transition from healthy to precancer to cancer |
| Tissue | Disease Stage | Enriched GO biological Processes |
| Colorectum | AD |  |
| Colorectum | SER |  |
| Colorectum | MSS |  |
| Colorectum | MSI-H |  |
| Colorectum | FAP |  |
| ∗Top 15 enriched GO BP terms are showed in the bar plot of each disease state in each tissue. Each row represents a significant GO biological process which is colored according to the -log10(p.adjust). |
| Page: 1 2 3 4 5 6 7 8 9 |
| GO ID | Tissue | Disease Stage | Description | Gene Ratio | Bg Ratio | pvalue | p.adjust | Count |
| GO:0007059 | Liver | HCC | chromosome segregation | 197/7958 | 346/18723 | 3.57e-08 | 7.87e-07 | 197 |
| GO:007050711 | Liver | HCC | regulation of microtubule cytoskeleton organization | 88/7958 | 148/18723 | 2.28e-05 | 2.41e-04 | 88 |
| GO:0031109 | Liver | HCC | microtubule polymerization or depolymerization | 68/7958 | 122/18723 | 2.14e-03 | 1.08e-02 | 68 |
| GO:0031110 | Liver | HCC | regulation of microtubule polymerization or depolymerization | 51/7958 | 88/18723 | 2.46e-03 | 1.19e-02 | 51 |
| GO:0032886 | Liver | HCC | regulation of microtubule-based process | 123/7958 | 240/18723 | 3.69e-03 | 1.64e-02 | 123 |
| Page: 1 |
| Pathway ID | Tissue | Disease Stage | Description | Gene Ratio | Bg Ratio | pvalue | p.adjust | qvalue | Count |
| Page: 1 |
Top |
Cell-cell communication analysis |
| Identification of potential cell-cell interactions between two cell types and their ligand-receptor pairs for different disease states |
| Ligand | Receptor | LRpair | Pathway | Tissue | Disease Stage |
| Page: 1 |
Top |
Single-cell gene regulatory network inference analysis |
| Find out the significant the regulons (TFs) and the target genes of each regulon across cell types for different disease states |
| TF | Cell Type | Tissue | Disease Stage | Target Gene | RSS | Regulon Activity |
| ∗The dot plots of a searched regulon are shown for all cell subpopulations in each disease state of each tissue based on the regulon specific score inferred using pySCENIC and by calculating the average expression. |
| Page: 1 |
Top |
Somatic mutation of malignant transformation related genes |
| Annotation of somatic variants for genes involved in malignant transformation |
| Hugo Symbol | Variant Class | Variant Classification | dbSNP RS | HGVSc | HGVSp | HGVSp Short | SWISSPROT | BIOTYPE | SIFT | PolyPhen | Tumor Sample Barcode | Tissue | Histology | Sex | Age | Stage | Therapy Types | Drugs | Outcome |
| SKA1 | SNV | Missense_Mutation | novel | c.80N>T | p.Arg27Ile | p.R27I | Q96BD8 | protein_coding | deleterious(0) | probably_damaging(0.935) | TCGA-AN-A046-01 | Breast | breast invasive carcinoma | Female | >=65 | I/II | Unknown | Unknown | SD |
| SKA1 | SNV | Missense_Mutation | novel | c.590N>G | p.Phe197Cys | p.F197C | Q96BD8 | protein_coding | deleterious(0) | probably_damaging(0.997) | TCGA-B6-A400-01 | Breast | breast invasive carcinoma | Female | <65 | III/IV | Unknown | Unknown | SD |
| SKA1 | insertion | Nonsense_Mutation | novel | c.679_680insGTAGCTAGGACTACAGGCGCCCGCCGCCACCATGCCAGGCT | p.Lys227SerfsTer3 | p.K227Sfs*3 | Q96BD8 | protein_coding | TCGA-AR-A0TY-01 | Breast | breast invasive carcinoma | Female | <65 | I/II | Unspecific | Paclitaxel | PD | ||
| SKA1 | SNV | Missense_Mutation | rs767928042 | c.65N>C | p.Lys22Thr | p.K22T | Q96BD8 | protein_coding | tolerated(0.06) | benign(0.133) | TCGA-2W-A8YY-01 | Cervix | cervical & endocervical cancer | Female | <65 | I/II | Chemotherapy | cisplatin | CR |
| SKA1 | SNV | Missense_Mutation | novel | c.610N>A | p.Asp204Asn | p.D204N | Q96BD8 | protein_coding | deleterious(0) | benign(0.042) | TCGA-2W-A8YY-01 | Cervix | cervical & endocervical cancer | Female | <65 | I/II | Chemotherapy | cisplatin | CR |
| SKA1 | SNV | Missense_Mutation | novel | c.595N>C | p.Asp199His | p.D199H | Q96BD8 | protein_coding | deleterious(0.01) | possibly_damaging(0.5) | TCGA-EA-A3HU-01 | Cervix | cervical & endocervical cancer | Female | <65 | I/II | Unknown | Unknown | SD |
| SKA1 | SNV | Missense_Mutation | rs375685203 | c.752N>A | p.Arg251His | p.R251H | Q96BD8 | protein_coding | deleterious(0.03) | probably_damaging(0.997) | TCGA-AA-3713-01 | Colorectum | colon adenocarcinoma | Male | >=65 | III/IV | Chemotherapy | 5-fluorouracil | PR |
| SKA1 | SNV | Missense_Mutation | c.247N>T | p.Asp83Tyr | p.D83Y | Q96BD8 | protein_coding | deleterious(0) | probably_damaging(0.947) | TCGA-EI-6917-01 | Colorectum | rectum adenocarcinoma | Male | <65 | III/IV | Chemotherapy | 5fluorouracil+oxaciplatina+l-folinian | SD | |
| SKA1 | SNV | Missense_Mutation | novel | c.487N>T | p.Asp163Tyr | p.D163Y | Q96BD8 | protein_coding | tolerated(0.26) | probably_damaging(0.916) | TCGA-F5-6814-01 | Colorectum | rectum adenocarcinoma | Male | <65 | I/II | Unknown | Unknown | SD |
| SKA1 | SNV | Missense_Mutation | c.491N>C | p.Val164Ala | p.V164A | Q96BD8 | protein_coding | tolerated(0.29) | benign(0.109) | TCGA-A5-A0GP-01 | Endometrium | uterine corpus endometrioid carcinoma | Female | <65 | I/II | Unknown | Unknown | SD |
| Page: 1 2 3 |
Top |
Related drugs of malignant transformation related genes |
| Identification of chemicals and drugs interact with genes involved in malignant transfromation |
| (DGIdb 4.0) |
| Entrez ID | Symbol | Category | Interaction Types | Drug Claim Name | Drug Name | PMIDs |
| Page: 1 |

Copyright 2023-Present -The University of Texas Health Science Center at Houston |