
|
|||||
|
 | |
| |
| |
| |
| |
| |
|
Gene: SIX4 |
Gene summary for SIX4 |
| Gene information | Species | Human | Gene symbol | SIX4 | Gene ID | 51804 |
| Gene name | SIX homeobox 4 | |
| Gene Alias | AREC3 | |
| Cytomap | 14q23.1 | |
| Gene Type | protein-coding | GO ID | GO:0000003 | UniProtAcc | Q9UIU6 |
Top |
Malignant transformation analysis |
| Identification of the aberrant gene expression in precancerous and cancerous lesions by comparing the gene expression of stem-like cells in diseased tissues with normal stem cells |
| Entrez ID | Symbol | Replicates | Species | Organ | Tissue | Adj P-value | Log2FC | Malignancy |
| 51804 | SIX4 | LZE4T | Human | Esophagus | ESCC | 5.12e-06 | 2.43e-01 | 0.0811 |
| 51804 | SIX4 | LZE5T | Human | Esophagus | ESCC | 7.69e-04 | 2.71e-01 | 0.0514 |
| 51804 | SIX4 | LZE24T | Human | Esophagus | ESCC | 1.53e-11 | 3.60e-01 | 0.0596 |
| 51804 | SIX4 | LZE21T | Human | Esophagus | ESCC | 6.44e-04 | 1.93e-01 | 0.0655 |
| 51804 | SIX4 | P2T-E | Human | Esophagus | ESCC | 2.85e-06 | 1.39e-01 | 0.1177 |
| 51804 | SIX4 | P4T-E | Human | Esophagus | ESCC | 4.34e-07 | 1.32e-01 | 0.1323 |
| 51804 | SIX4 | P8T-E | Human | Esophagus | ESCC | 2.51e-18 | 2.83e-01 | 0.0889 |
| 51804 | SIX4 | P10T-E | Human | Esophagus | ESCC | 2.56e-17 | 2.83e-01 | 0.116 |
| 51804 | SIX4 | P12T-E | Human | Esophagus | ESCC | 5.70e-18 | 3.01e-01 | 0.1122 |
| 51804 | SIX4 | P15T-E | Human | Esophagus | ESCC | 1.50e-29 | 6.88e-01 | 0.1149 |
| 51804 | SIX4 | P16T-E | Human | Esophagus | ESCC | 1.34e-07 | 1.63e-01 | 0.1153 |
| 51804 | SIX4 | P22T-E | Human | Esophagus | ESCC | 1.17e-04 | 3.00e-02 | 0.1236 |
| 51804 | SIX4 | P23T-E | Human | Esophagus | ESCC | 2.65e-06 | 2.32e-01 | 0.108 |
| 51804 | SIX4 | P24T-E | Human | Esophagus | ESCC | 3.82e-04 | 6.49e-02 | 0.1287 |
| 51804 | SIX4 | P26T-E | Human | Esophagus | ESCC | 4.45e-13 | 2.43e-01 | 0.1276 |
| 51804 | SIX4 | P27T-E | Human | Esophagus | ESCC | 2.13e-06 | 1.40e-01 | 0.1055 |
| 51804 | SIX4 | P28T-E | Human | Esophagus | ESCC | 8.32e-06 | 9.05e-02 | 0.1149 |
| 51804 | SIX4 | P30T-E | Human | Esophagus | ESCC | 8.28e-06 | 1.78e-01 | 0.137 |
| 51804 | SIX4 | P31T-E | Human | Esophagus | ESCC | 4.39e-08 | 7.56e-02 | 0.1251 |
| 51804 | SIX4 | P37T-E | Human | Esophagus | ESCC | 1.06e-06 | 1.01e-01 | 0.1371 |
| Page: 1 2 |
| Tissue | Expression Dynamics | Abbreviation |
| Esophagus | 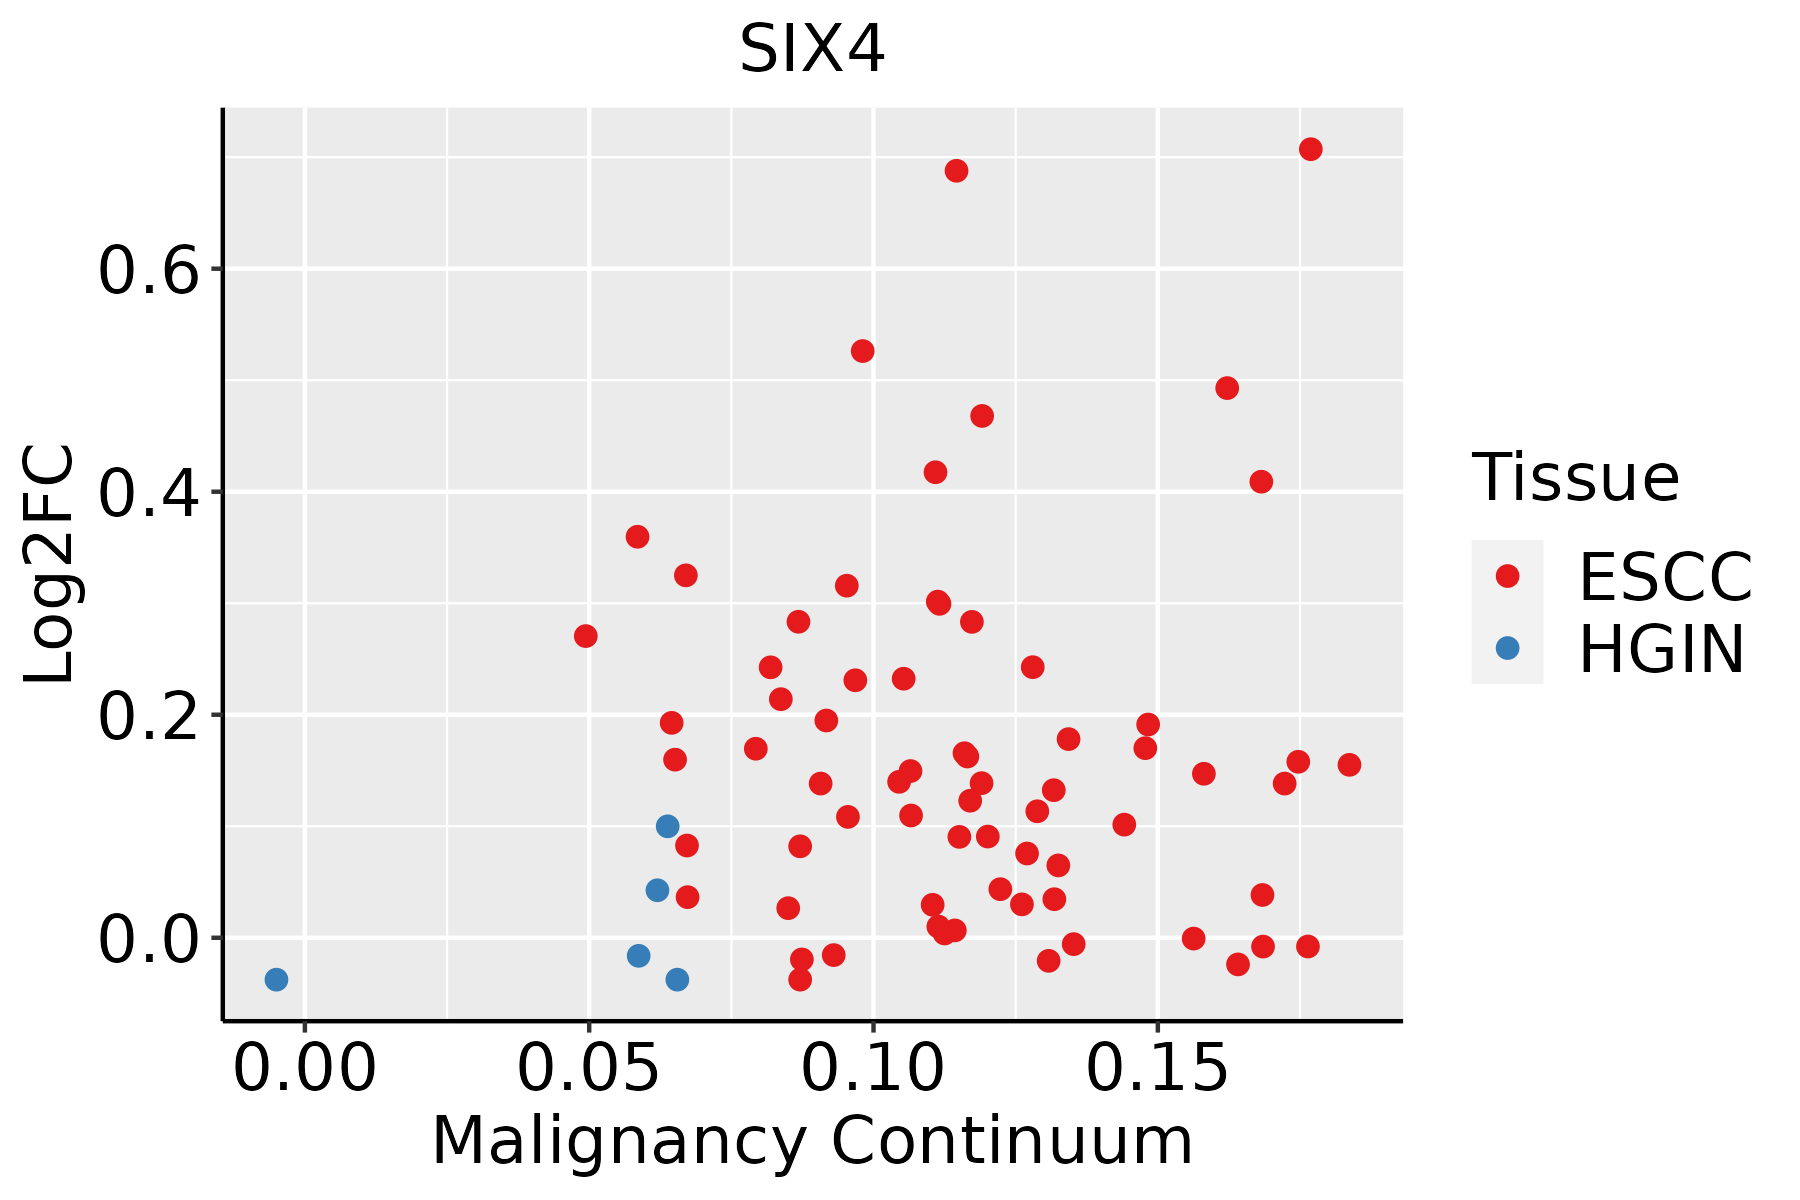 | ESCC: Esophageal squamous cell carcinoma |
| HGIN: High-grade intraepithelial neoplasias | ||
| LGIN: Low-grade intraepithelial neoplasias |
| ∗log2FC in expression of this searched gene in stem-like cells from each diseased tissue sample relative to stem-like cells in normal samples in each tissue plotted against the malignancy continuum. Samples are colored based on if they are from different disease stage. |
Top |
Malignant transformation related pathway analysis |
| Find out the enriched GO biological processes and KEGG pathways involved in transition from healthy to precancer to cancer |
| Tissue | Disease Stage | Enriched GO biological Processes |
| Colorectum | AD |  |
| Colorectum | SER |  |
| Colorectum | MSS |  |
| Colorectum | MSI-H |  |
| Colorectum | FAP |  |
| ∗Top 15 enriched GO BP terms are showed in the bar plot of each disease state in each tissue. Each row represents a significant GO biological process which is colored according to the -log10(p.adjust). |
| Page: 1 2 3 4 5 6 7 8 9 |
| GO ID | Tissue | Disease Stage | Description | Gene Ratio | Bg Ratio | pvalue | p.adjust | Count |
| GO:003450418 | Esophagus | ESCC | protein localization to nucleus | 211/8552 | 290/18723 | 4.06e-21 | 6.60e-19 | 211 |
| GO:0048732111 | Esophagus | ESCC | gland development | 269/8552 | 436/18723 | 7.81e-12 | 2.95e-10 | 269 |
| GO:0070997111 | Esophagus | ESCC | neuron death | 216/8552 | 361/18723 | 3.49e-08 | 6.45e-07 | 216 |
| GO:00163316 | Esophagus | ESCC | morphogenesis of embryonic epithelium | 98/8552 | 147/18723 | 2.12e-07 | 3.27e-06 | 98 |
| GO:0061458110 | Esophagus | ESCC | reproductive system development | 247/8552 | 427/18723 | 2.24e-07 | 3.42e-06 | 247 |
| GO:000183814 | Esophagus | ESCC | embryonic epithelial tube formation | 83/8552 | 121/18723 | 2.78e-07 | 4.08e-06 | 83 |
| GO:004860818 | Esophagus | ESCC | reproductive structure development | 245/8552 | 424/18723 | 2.82e-07 | 4.14e-06 | 245 |
| GO:003514815 | Esophagus | ESCC | tube formation | 96/8552 | 148/18723 | 1.86e-06 | 2.16e-05 | 96 |
| GO:0051402110 | Esophagus | ESCC | neuron apoptotic process | 148/8552 | 246/18723 | 3.08e-06 | 3.47e-05 | 148 |
| GO:1901214111 | Esophagus | ESCC | regulation of neuron death | 186/8552 | 319/18723 | 3.35e-06 | 3.73e-05 | 186 |
| GO:00721759 | Esophagus | ESCC | epithelial tube formation | 86/8552 | 132/18723 | 4.81e-06 | 5.10e-05 | 86 |
| GO:006056210 | Esophagus | ESCC | epithelial tube morphogenesis | 187/8552 | 325/18723 | 9.95e-06 | 9.44e-05 | 187 |
| GO:00605417 | Esophagus | ESCC | respiratory system development | 123/8552 | 203/18723 | 1.26e-05 | 1.15e-04 | 123 |
| GO:005067318 | Esophagus | ESCC | epithelial cell proliferation | 238/8552 | 437/18723 | 1.19e-04 | 8.20e-04 | 238 |
| GO:00485386 | Esophagus | ESCC | thymus development | 33/8552 | 45/18723 | 1.54e-04 | 1.02e-03 | 33 |
| GO:003432918 | Esophagus | ESCC | cell junction assembly | 227/8552 | 420/18723 | 3.06e-04 | 1.83e-03 | 227 |
| GO:004352317 | Esophagus | ESCC | regulation of neuron apoptotic process | 122/8552 | 212/18723 | 3.21e-04 | 1.90e-03 | 122 |
| GO:005067817 | Esophagus | ESCC | regulation of epithelial cell proliferation | 206/8552 | 381/18723 | 5.51e-04 | 3.02e-03 | 206 |
| GO:00485687 | Esophagus | ESCC | embryonic organ development | 228/8552 | 427/18723 | 7.28e-04 | 3.79e-03 | 228 |
| GO:006056010 | Esophagus | ESCC | developmental growth involved in morphogenesis | 131/8552 | 234/18723 | 9.28e-04 | 4.73e-03 | 131 |
| Page: 1 2 |
| Pathway ID | Tissue | Disease Stage | Description | Gene Ratio | Bg Ratio | pvalue | p.adjust | qvalue | Count |
| hsa052028 | Esophagus | ESCC | Transcriptional misregulation in cancer | 116/4205 | 193/8465 | 2.08e-03 | 5.95e-03 | 3.05e-03 | 116 |
| hsa0520213 | Esophagus | ESCC | Transcriptional misregulation in cancer | 116/4205 | 193/8465 | 2.08e-03 | 5.95e-03 | 3.05e-03 | 116 |
| Page: 1 |
Top |
Cell-cell communication analysis |
| Identification of potential cell-cell interactions between two cell types and their ligand-receptor pairs for different disease states |
| Ligand | Receptor | LRpair | Pathway | Tissue | Disease Stage |
| Page: 1 |
Top |
Single-cell gene regulatory network inference analysis |
| Find out the significant the regulons (TFs) and the target genes of each regulon across cell types for different disease states |
| TF | Cell Type | Tissue | Disease Stage | Target Gene | RSS | Regulon Activity |
| ∗The dot plots of a searched regulon are shown for all cell subpopulations in each disease state of each tissue based on the regulon specific score inferred using pySCENIC and by calculating the average expression. |
| Page: 1 |
Top |
Somatic mutation of malignant transformation related genes |
| Annotation of somatic variants for genes involved in malignant transformation |
| Hugo Symbol | Variant Class | Variant Classification | dbSNP RS | HGVSc | HGVSp | HGVSp Short | SWISSPROT | BIOTYPE | SIFT | PolyPhen | Tumor Sample Barcode | Tissue | Histology | Sex | Age | Stage | Therapy Types | Drugs | Outcome |
| SIX4 | SNV | Missense_Mutation | c.1364N>C | p.Arg455Thr | p.R455T | Q9UIU6 | protein_coding | tolerated(0.36) | benign(0.005) | TCGA-A1-A0SI-01 | Breast | breast invasive carcinoma | Female | <65 | I/II | Unknown | Unknown | SD | |
| SIX4 | SNV | Missense_Mutation | c.708N>G | p.Asn236Lys | p.N236K | Q9UIU6 | protein_coding | deleterious(0.03) | benign(0.122) | TCGA-A8-A08L-01 | Breast | breast invasive carcinoma | Female | >=65 | III/IV | Unknown | Unknown | SD | |
| SIX4 | SNV | Missense_Mutation | c.2300N>T | p.Ala767Val | p.A767V | Q9UIU6 | protein_coding | deleterious_low_confidence(0) | possibly_damaging(0.883) | TCGA-AC-A23C-01 | Breast | breast invasive carcinoma | Female | <65 | I/II | Chemotherapy | chemo | CR | |
| SIX4 | SNV | Missense_Mutation | novel | c.2167N>C | p.Glu723Gln | p.E723Q | Q9UIU6 | protein_coding | deleterious_low_confidence(0) | probably_damaging(0.915) | TCGA-BH-A42V-01 | Breast | breast invasive carcinoma | Female | <65 | I/II | Unknown | Unknown | SD |
| SIX4 | SNV | Missense_Mutation | novel | c.436N>C | p.Glu146Gln | p.E146Q | Q9UIU6 | protein_coding | deleterious(0) | possibly_damaging(0.794) | TCGA-C8-A8HQ-01 | Breast | breast invasive carcinoma | Female | <65 | I/II | Unknown | Unknown | SD |
| SIX4 | insertion | Nonsense_Mutation | novel | c.864_865insATCCATGACTGACATACTGGGGTCTACTTCCCAGGACGTGAAG | p.Glu289IlefsTer4 | p.E289Ifs*4 | Q9UIU6 | protein_coding | TCGA-A2-A0D1-01 | Breast | breast invasive carcinoma | Female | >=65 | I/II | Chemotherapy | taxotere | SD | ||
| SIX4 | SNV | Missense_Mutation | c.708C>G | p.Asn236Lys | p.N236K | Q9UIU6 | protein_coding | deleterious(0.03) | benign(0.122) | TCGA-JW-A5VJ-01 | Cervix | cervical & endocervical cancer | Female | <65 | I/II | Unknown | Unknown | PD | |
| SIX4 | SNV | Missense_Mutation | c.438N>C | p.Glu146Asp | p.E146D | Q9UIU6 | protein_coding | tolerated(0.07) | benign(0.417) | TCGA-JW-A5VL-01 | Cervix | cervical & endocervical cancer | Female | <65 | I/II | Unknown | Unknown | SD | |
| SIX4 | SNV | Missense_Mutation | c.1859N>C | p.Phe620Ser | p.F620S | Q9UIU6 | protein_coding | deleterious_low_confidence(0) | possibly_damaging(0.879) | TCGA-AA-3864-01 | Colorectum | colon adenocarcinoma | Male | >=65 | I/II | Unknown | Unknown | SD | |
| SIX4 | SNV | Missense_Mutation | rs778647376 | c.57G>T | p.Glu19Asp | p.E19D | Q9UIU6 | protein_coding | deleterious_low_confidence(0) | benign(0.003) | TCGA-AA-3977-01 | Colorectum | colon adenocarcinoma | Male | >=65 | I/II | Unknown | Unknown | SD |
| Page: 1 2 3 4 5 6 7 8 |
Top |
Related drugs of malignant transformation related genes |
| Identification of chemicals and drugs interact with genes involved in malignant transfromation |
| (DGIdb 4.0) |
| Entrez ID | Symbol | Category | Interaction Types | Drug Claim Name | Drug Name | PMIDs |
| Page: 1 |

Copyright 2023-Present -The University of Texas Health Science Center at Houston |