
|
|||||
|
 | |
| |
| |
| |
| |
| |
|
Gene: SIVA1 |
Gene summary for SIVA1 |
| Gene information | Species | Human | Gene symbol | SIVA1 | Gene ID | 10572 |
| Gene name | SIVA1 apoptosis inducing factor | |
| Gene Alias | CD27BP | |
| Cytomap | 14q32.33 | |
| Gene Type | protein-coding | GO ID | GO:0006915 | UniProtAcc | O15304 |
Top |
Malignant transformation analysis |
| Identification of the aberrant gene expression in precancerous and cancerous lesions by comparing the gene expression of stem-like cells in diseased tissues with normal stem cells |
| Entrez ID | Symbol | Replicates | Species | Organ | Tissue | Adj P-value | Log2FC | Malignancy |
| 10572 | SIVA1 | GSM4909281 | Human | Breast | IDC | 7.53e-16 | 5.42e-01 | 0.21 |
| 10572 | SIVA1 | GSM4909282 | Human | Breast | IDC | 4.39e-10 | 4.51e-01 | -0.0288 |
| 10572 | SIVA1 | GSM4909285 | Human | Breast | IDC | 8.52e-17 | 5.14e-01 | 0.21 |
| 10572 | SIVA1 | GSM4909286 | Human | Breast | IDC | 1.36e-15 | 4.26e-01 | 0.1081 |
| 10572 | SIVA1 | GSM4909290 | Human | Breast | IDC | 7.19e-17 | 5.23e-01 | 0.2096 |
| 10572 | SIVA1 | GSM4909296 | Human | Breast | IDC | 2.14e-13 | 3.04e-01 | 0.1524 |
| 10572 | SIVA1 | GSM4909297 | Human | Breast | IDC | 1.94e-09 | -1.18e-01 | 0.1517 |
| 10572 | SIVA1 | GSM4909301 | Human | Breast | IDC | 1.53e-11 | 3.83e-01 | 0.1577 |
| 10572 | SIVA1 | GSM4909304 | Human | Breast | IDC | 5.38e-27 | 6.19e-01 | 0.1636 |
| 10572 | SIVA1 | GSM4909306 | Human | Breast | IDC | 1.05e-08 | 3.99e-01 | 0.1564 |
| 10572 | SIVA1 | GSM4909307 | Human | Breast | IDC | 3.96e-10 | 4.32e-01 | 0.1569 |
| 10572 | SIVA1 | GSM4909308 | Human | Breast | IDC | 8.25e-12 | 4.03e-01 | 0.158 |
| 10572 | SIVA1 | GSM4909309 | Human | Breast | IDC | 2.51e-03 | 1.35e-01 | 0.0483 |
| 10572 | SIVA1 | GSM4909311 | Human | Breast | IDC | 1.07e-24 | -1.87e-01 | 0.1534 |
| 10572 | SIVA1 | GSM4909312 | Human | Breast | IDC | 5.02e-04 | 4.57e-02 | 0.1552 |
| 10572 | SIVA1 | GSM4909313 | Human | Breast | IDC | 2.40e-05 | 1.40e-01 | 0.0391 |
| 10572 | SIVA1 | GSM4909316 | Human | Breast | IDC | 1.45e-10 | 4.51e-01 | 0.21 |
| 10572 | SIVA1 | GSM4909317 | Human | Breast | IDC | 1.28e-12 | 4.18e-01 | 0.1355 |
| 10572 | SIVA1 | GSM4909318 | Human | Breast | IDC | 2.38e-12 | 6.90e-01 | 0.2031 |
| 10572 | SIVA1 | GSM4909319 | Human | Breast | IDC | 7.13e-28 | -1.48e-01 | 0.1563 |
| Page: 1 2 3 4 5 6 7 8 9 10 11 12 |
| Tissue | Expression Dynamics | Abbreviation |
| Breast |  | IDC: Invasive ductal carcinoma |
| DCIS: Ductal carcinoma in situ | ||
| Precancer(BRCA1-mut): Precancerous lesion from BRCA1 mutation carriers | ||
| Colorectum (GSE201348) |  | FAP: Familial adenomatous polyposis |
| CRC: Colorectal cancer | ||
| Colorectum (HTA11) |  | AD: Adenomas |
| SER: Sessile serrated lesions | ||
| MSI-H: Microsatellite-high colorectal cancer | ||
| MSS: Microsatellite stable colorectal cancer | ||
| Endometrium | 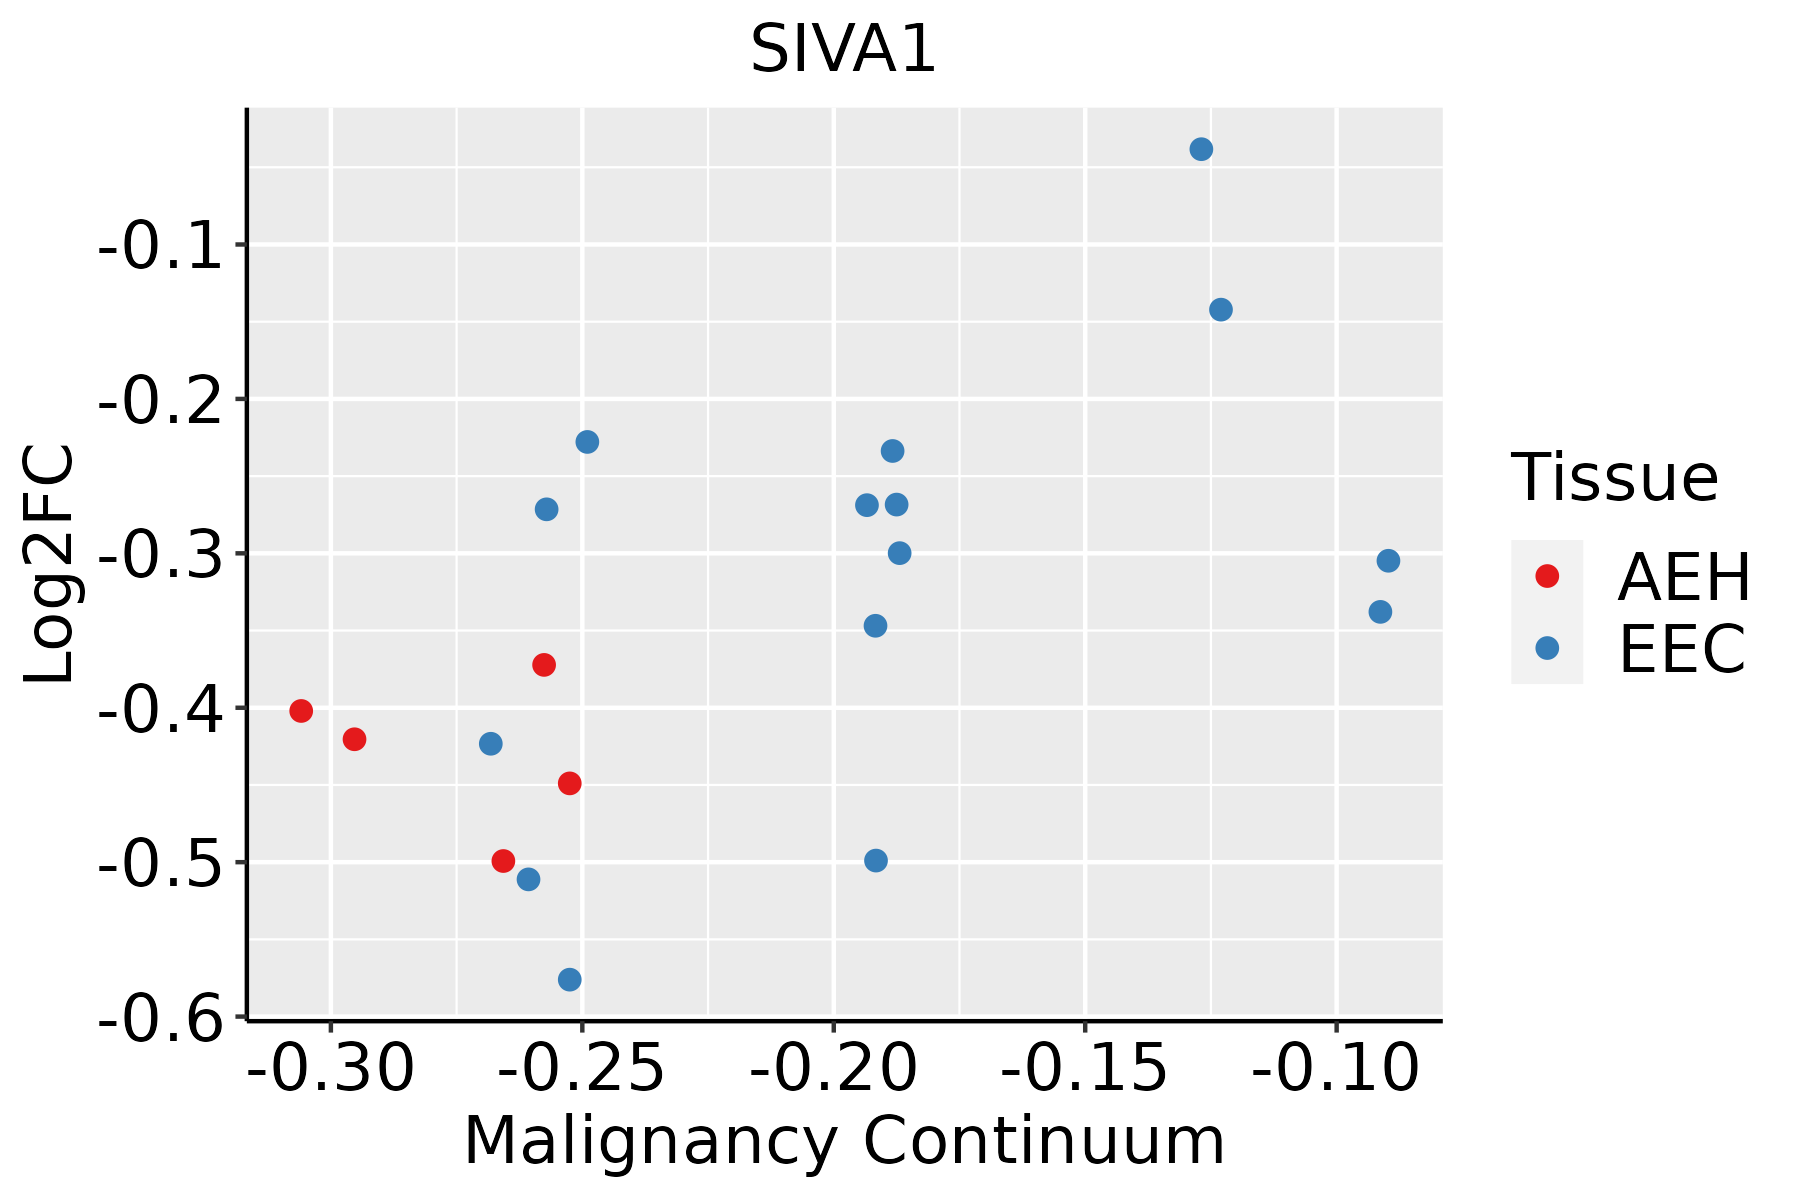 | AEH: Atypical endometrial hyperplasia |
| EEC: Endometrioid Cancer | ||
| Esophagus | 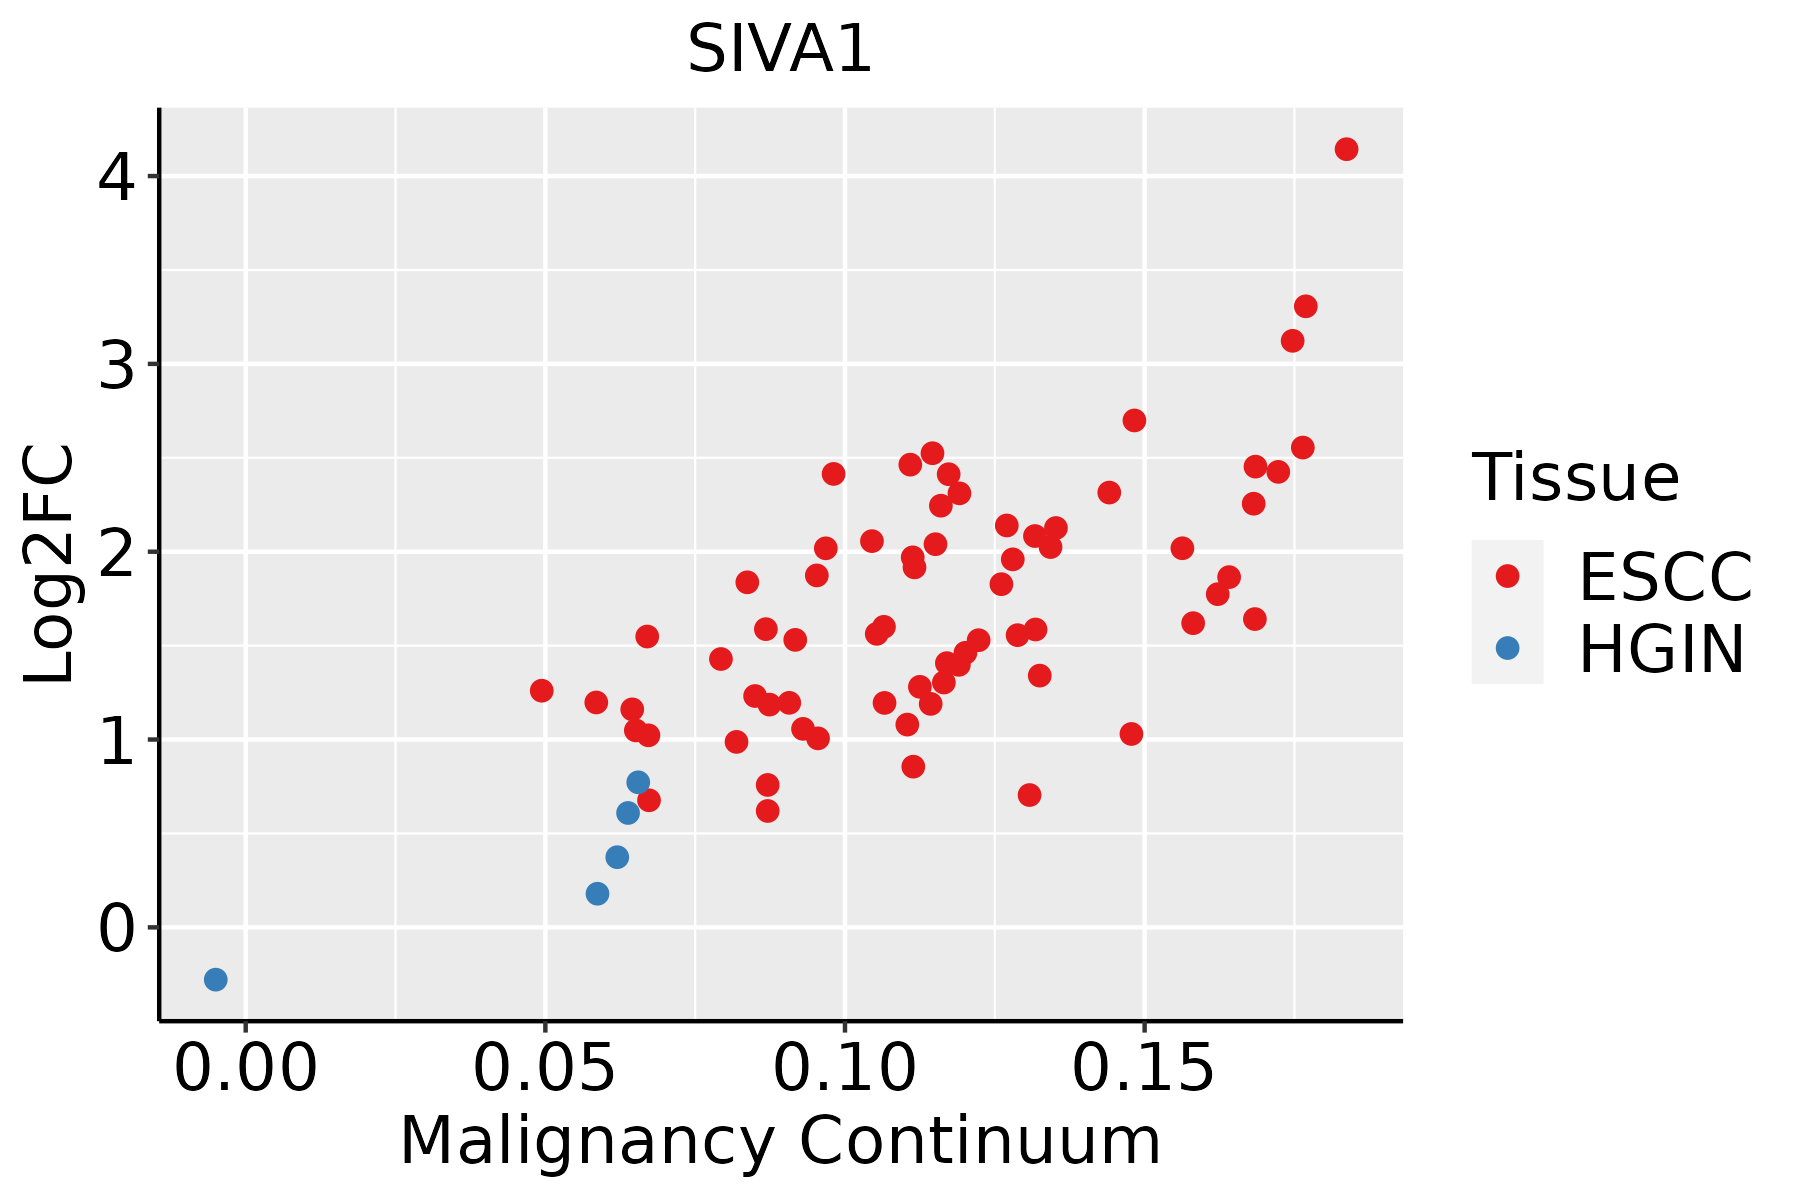 | ESCC: Esophageal squamous cell carcinoma |
| HGIN: High-grade intraepithelial neoplasias | ||
| LGIN: Low-grade intraepithelial neoplasias | ||
| GC | 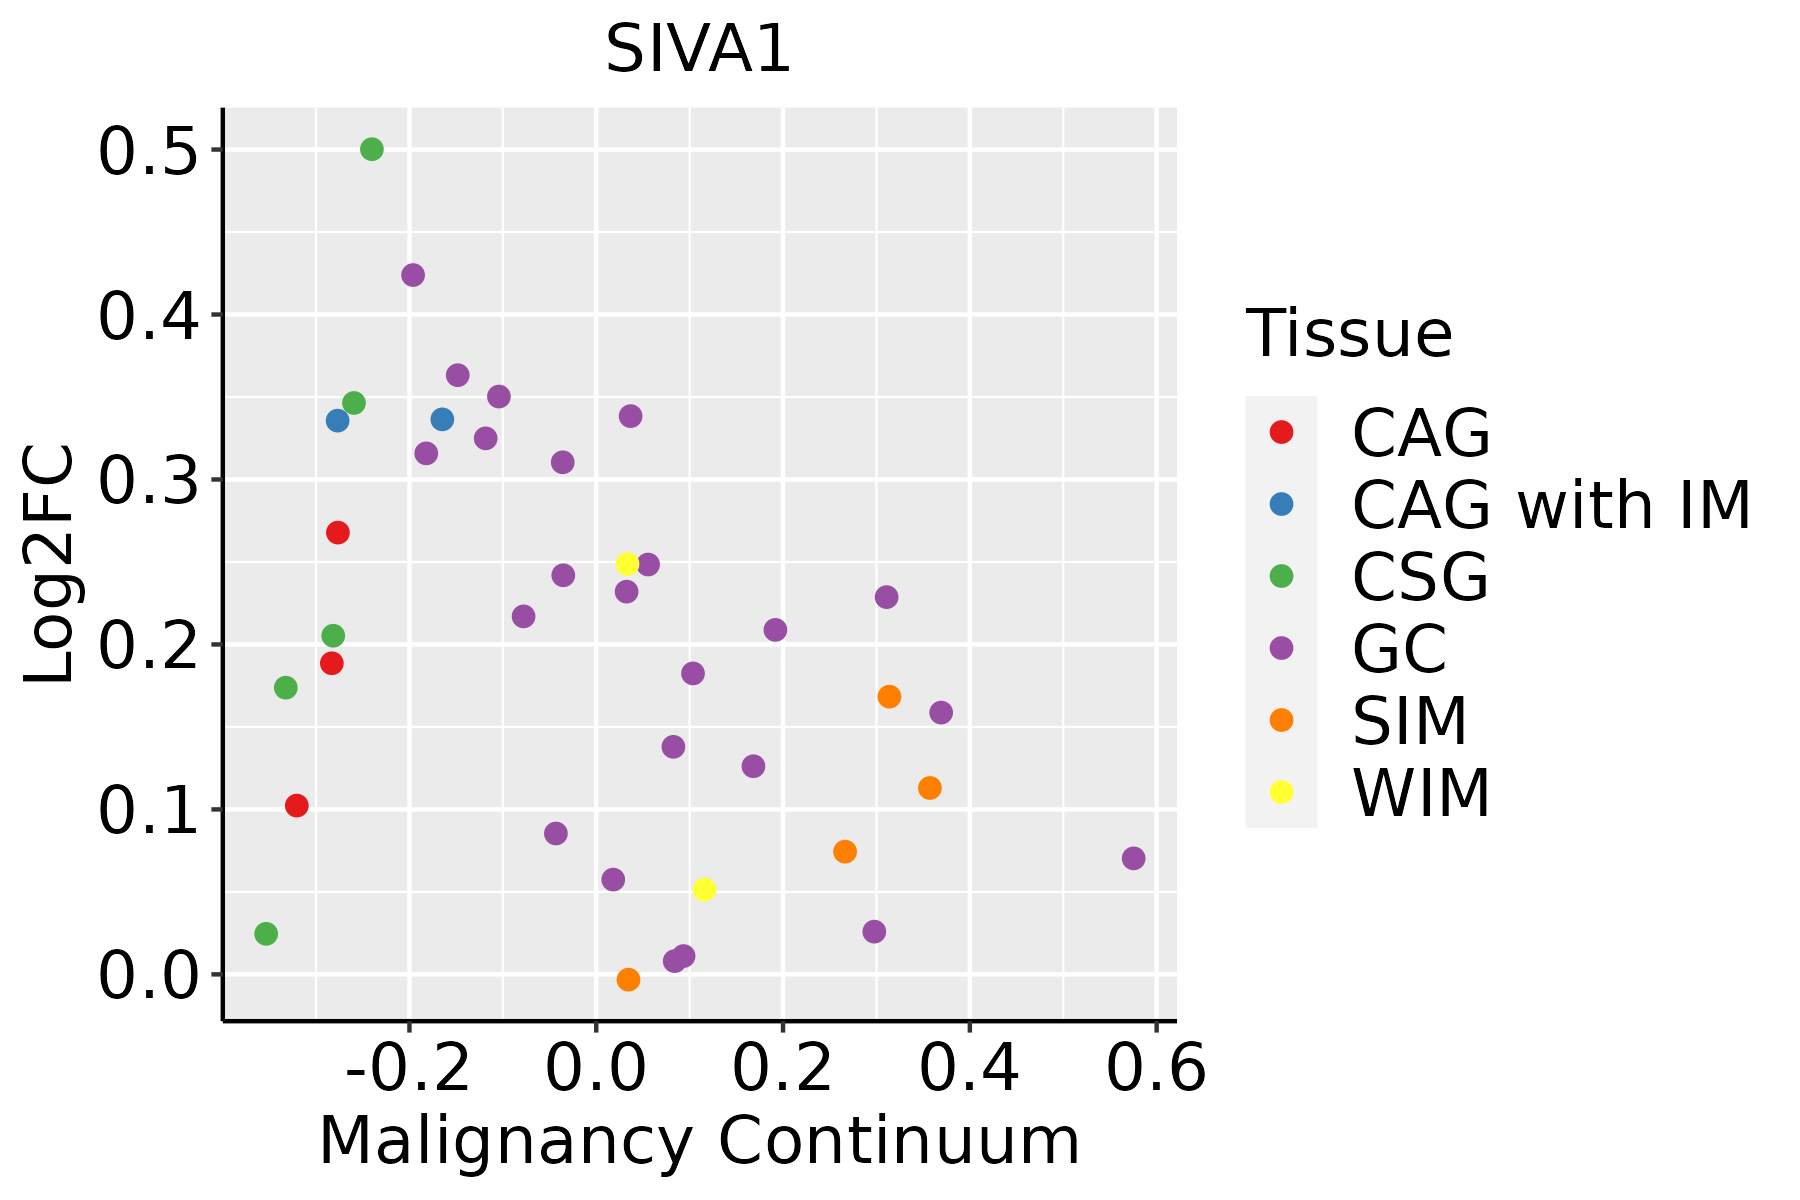 | CAG: Chronic atrophic gastritis |
| CAG with IM: Chronic atrophic gastritis with intestinal metaplasia | ||
| CSG: Chronic superficial gastritis | ||
| GC: Gastric cancer | ||
| SIM: Severe intestinal metaplasia | ||
| WIM: Wild intestinal metaplasia | ||
| Liver | 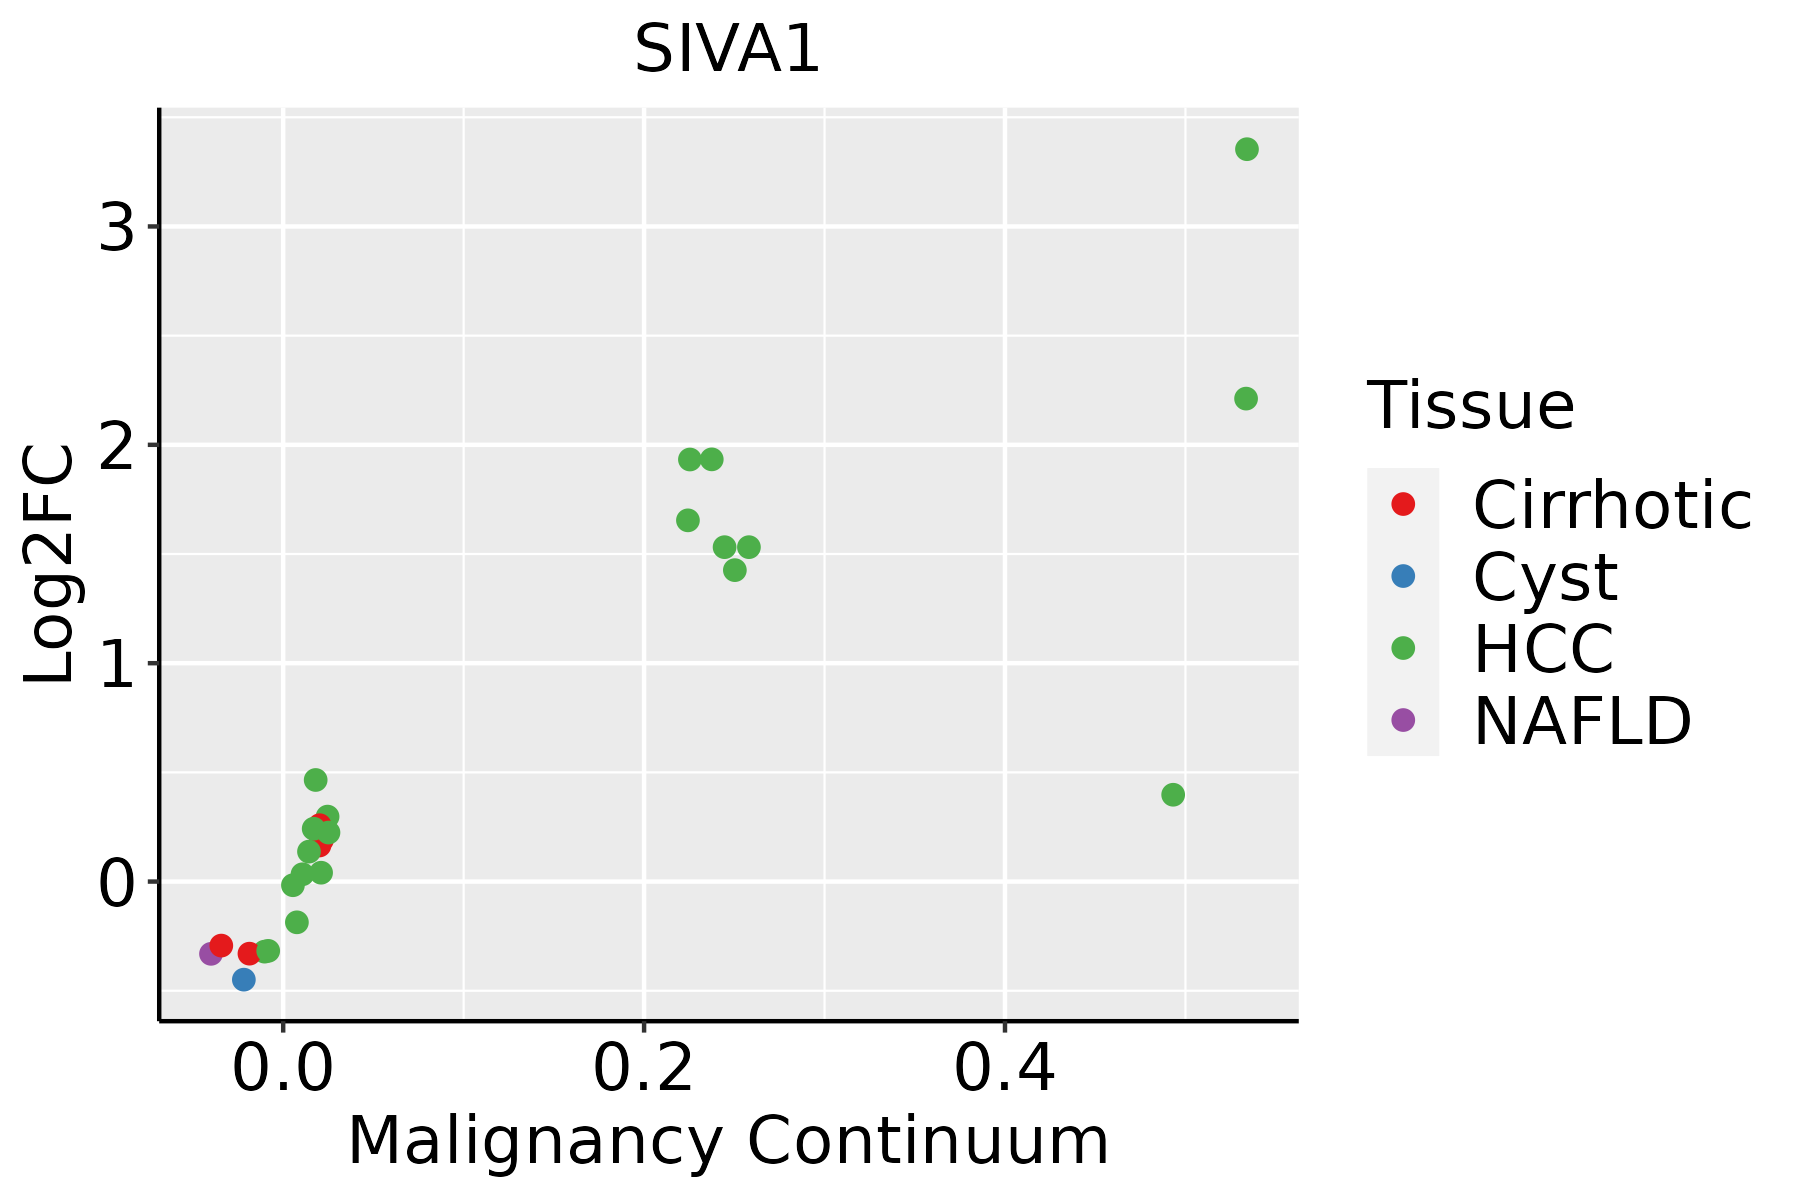 | HCC: Hepatocellular carcinoma |
| NAFLD: Non-alcoholic fatty liver disease | ||
| Oral Cavity |  | EOLP: Erosive Oral lichen planus |
| LP: leukoplakia | ||
| NEOLP: Non-erosive oral lichen planus | ||
| OSCC: Oral squamous cell carcinoma | ||
| Prostate |  | BPH: Benign Prostatic Hyperplasia |
| Skin |  | AK: Actinic keratosis |
| cSCC: Cutaneous squamous cell carcinoma | ||
| SCCIS:squamous cell carcinoma in situ | ||
| Thyroid | 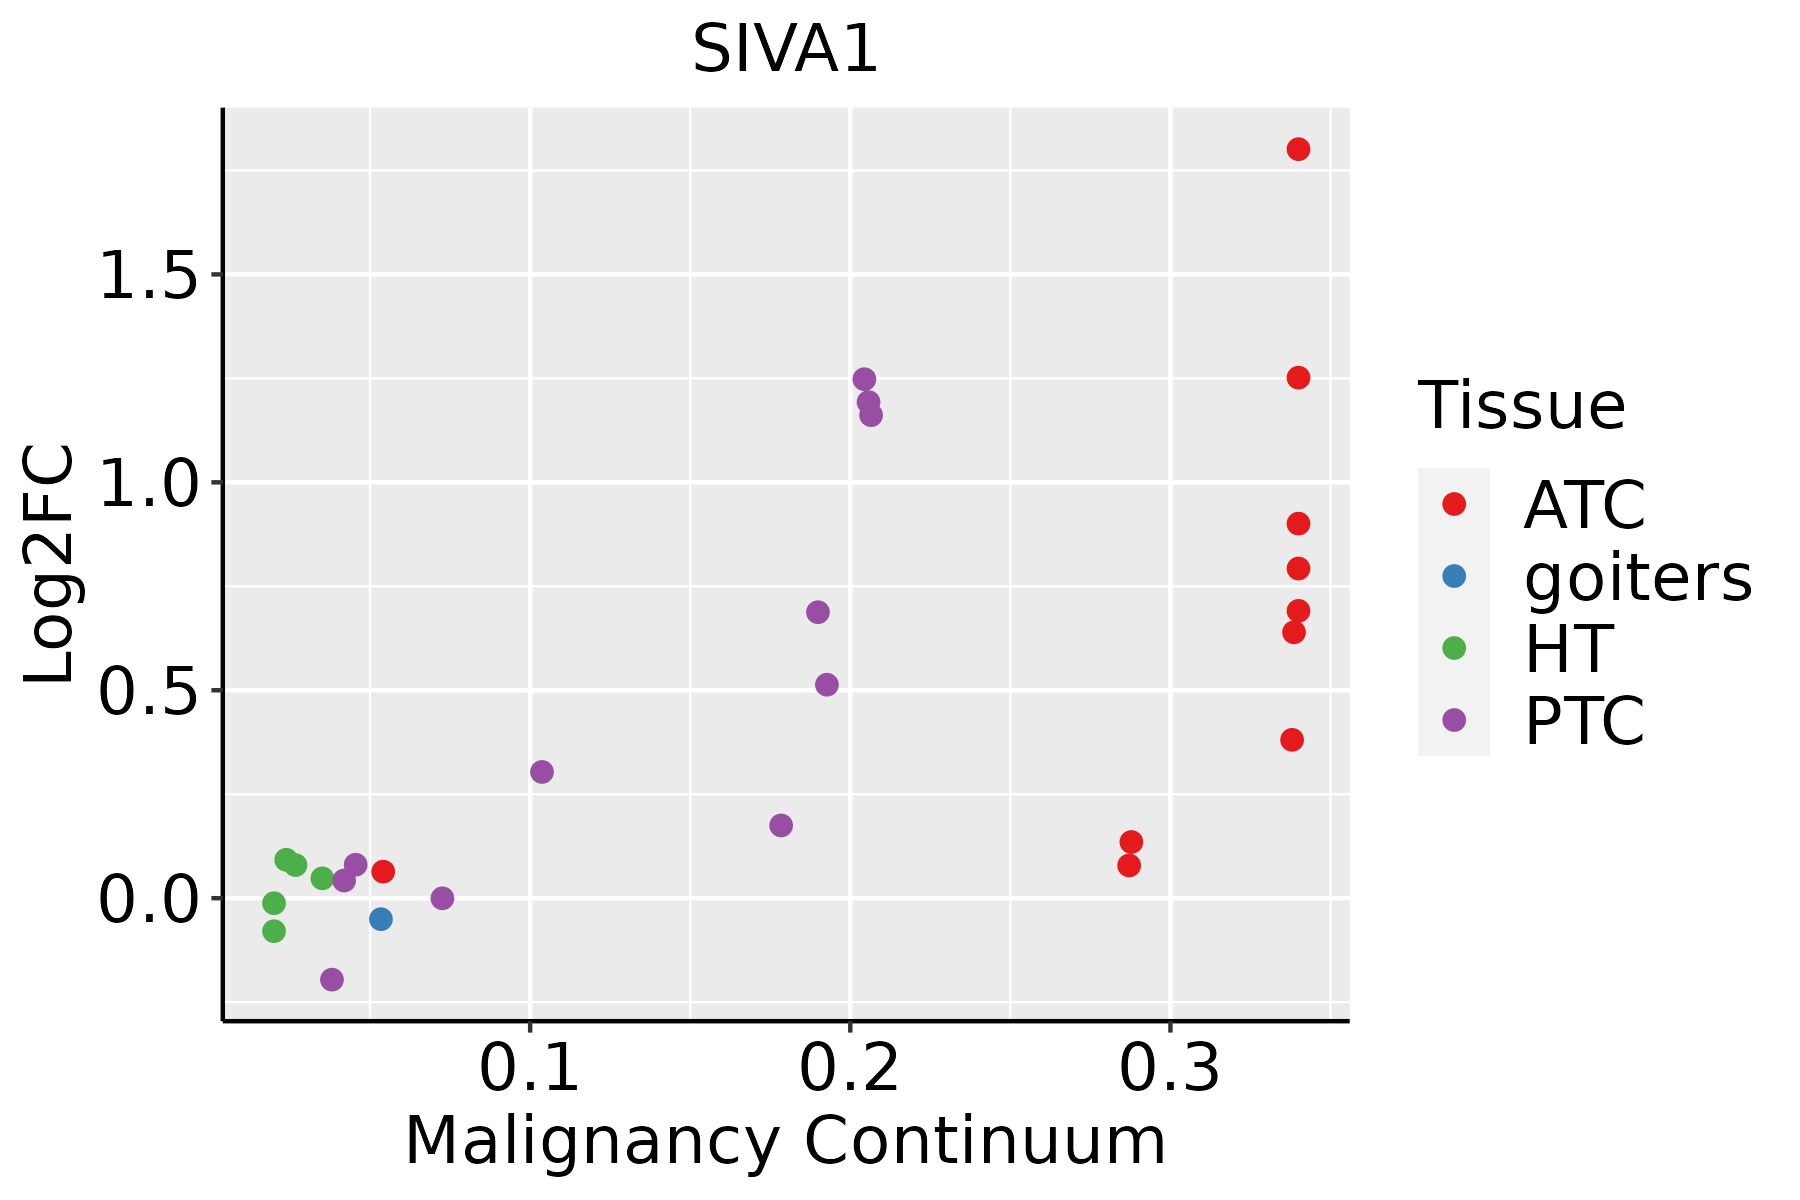 | ATC: Anaplastic thyroid cancer |
| HT: Hashimoto's thyroiditis | ||
| PTC: Papillary thyroid cancer |
| ∗log2FC in expression of this searched gene in stem-like cells from each diseased tissue sample relative to stem-like cells in normal samples in each tissue plotted against the malignancy continuum. Samples are colored based on if they are from different disease stage. |
Top |
Malignant transformation related pathway analysis |
| Find out the enriched GO biological processes and KEGG pathways involved in transition from healthy to precancer to cancer |
| Tissue | Disease Stage | Enriched GO biological Processes |
| Colorectum | AD |  |
| Colorectum | SER |  |
| Colorectum | MSS |  |
| Colorectum | MSI-H |  |
| Colorectum | FAP |  |
| ∗Top 15 enriched GO BP terms are showed in the bar plot of each disease state in each tissue. Each row represents a significant GO biological process which is colored according to the -log10(p.adjust). |
| Page: 1 2 3 4 5 6 7 8 9 |
| GO ID | Tissue | Disease Stage | Description | Gene Ratio | Bg Ratio | pvalue | p.adjust | Count |
| GO:001603214 | Breast | IDC | viral process | 75/1434 | 415/18723 | 1.98e-12 | 4.02e-10 | 75 |
| GO:001905814 | Breast | IDC | viral life cycle | 61/1434 | 317/18723 | 1.61e-11 | 2.77e-09 | 61 |
| GO:004440314 | Breast | IDC | biological process involved in symbiotic interaction | 52/1434 | 290/18723 | 6.55e-09 | 5.03e-07 | 52 |
| GO:009719114 | Breast | IDC | extrinsic apoptotic signaling pathway | 42/1434 | 219/18723 | 2.56e-08 | 1.73e-06 | 42 |
| GO:005212614 | Breast | IDC | movement in host environment | 32/1434 | 175/18723 | 3.33e-06 | 1.22e-04 | 32 |
| GO:005170114 | Breast | IDC | biological process involved in interaction with host | 35/1434 | 203/18723 | 4.72e-06 | 1.63e-04 | 35 |
| GO:004440914 | Breast | IDC | entry into host | 28/1434 | 151/18723 | 1.02e-05 | 2.82e-04 | 28 |
| GO:004671814 | Breast | IDC | viral entry into host cell | 27/1434 | 144/18723 | 1.18e-05 | 3.14e-04 | 27 |
| GO:001603224 | Breast | DCIS | viral process | 73/1390 | 415/18723 | 3.40e-12 | 6.88e-10 | 73 |
| GO:001905824 | Breast | DCIS | viral life cycle | 59/1390 | 317/18723 | 4.05e-11 | 5.74e-09 | 59 |
| GO:004440323 | Breast | DCIS | biological process involved in symbiotic interaction | 49/1390 | 290/18723 | 4.70e-08 | 2.89e-06 | 49 |
| GO:009719123 | Breast | DCIS | extrinsic apoptotic signaling pathway | 40/1390 | 219/18723 | 9.43e-08 | 5.28e-06 | 40 |
| GO:005212624 | Breast | DCIS | movement in host environment | 31/1390 | 175/18723 | 4.93e-06 | 1.45e-04 | 31 |
| GO:005170124 | Breast | DCIS | biological process involved in interaction with host | 34/1390 | 203/18723 | 6.30e-06 | 1.78e-04 | 34 |
| GO:004440924 | Breast | DCIS | entry into host | 27/1390 | 151/18723 | 1.65e-05 | 4.00e-04 | 27 |
| GO:004671824 | Breast | DCIS | viral entry into host cell | 26/1390 | 144/18723 | 1.97e-05 | 4.69e-04 | 26 |
| GO:0016032 | Colorectum | AD | viral process | 168/3918 | 415/18723 | 4.67e-20 | 3.66e-17 | 168 |
| GO:0019058 | Colorectum | AD | viral life cycle | 119/3918 | 317/18723 | 6.18e-12 | 8.23e-10 | 119 |
| GO:0044403 | Colorectum | AD | biological process involved in symbiotic interaction | 99/3918 | 290/18723 | 1.02e-07 | 4.93e-06 | 99 |
| GO:0051701 | Colorectum | AD | biological process involved in interaction with host | 73/3918 | 203/18723 | 5.08e-07 | 1.88e-05 | 73 |
| Page: 1 2 3 4 5 6 7 8 9 10 |
| Pathway ID | Tissue | Disease Stage | Description | Gene Ratio | Bg Ratio | pvalue | p.adjust | qvalue | Count |
| hsa041157 | Breast | IDC | p53 signaling pathway | 16/867 | 74/8465 | 2.86e-03 | 1.86e-02 | 1.39e-02 | 16 |
| hsa0411512 | Breast | IDC | p53 signaling pathway | 16/867 | 74/8465 | 2.86e-03 | 1.86e-02 | 1.39e-02 | 16 |
| hsa0411521 | Breast | DCIS | p53 signaling pathway | 16/846 | 74/8465 | 2.23e-03 | 1.47e-02 | 1.08e-02 | 16 |
| hsa0411531 | Breast | DCIS | p53 signaling pathway | 16/846 | 74/8465 | 2.23e-03 | 1.47e-02 | 1.08e-02 | 16 |
| hsa0411510 | Esophagus | HGIN | p53 signaling pathway | 21/1383 | 74/8465 | 6.25e-03 | 4.25e-02 | 3.37e-02 | 21 |
| hsa0411515 | Esophagus | HGIN | p53 signaling pathway | 21/1383 | 74/8465 | 6.25e-03 | 4.25e-02 | 3.37e-02 | 21 |
| hsa0411524 | Esophagus | ESCC | p53 signaling pathway | 65/4205 | 74/8465 | 3.88e-12 | 6.50e-11 | 3.33e-11 | 65 |
| hsa0411534 | Esophagus | ESCC | p53 signaling pathway | 65/4205 | 74/8465 | 3.88e-12 | 6.50e-11 | 3.33e-11 | 65 |
| hsa041156 | Liver | HCC | p53 signaling pathway | 46/4020 | 74/8465 | 7.64e-03 | 2.08e-02 | 1.16e-02 | 46 |
| hsa0411511 | Liver | HCC | p53 signaling pathway | 46/4020 | 74/8465 | 7.64e-03 | 2.08e-02 | 1.16e-02 | 46 |
| hsa041159 | Oral cavity | OSCC | p53 signaling pathway | 57/3704 | 74/8465 | 4.99e-09 | 5.07e-08 | 2.58e-08 | 57 |
| hsa0411514 | Oral cavity | OSCC | p53 signaling pathway | 57/3704 | 74/8465 | 4.99e-09 | 5.07e-08 | 2.58e-08 | 57 |
| hsa0411523 | Oral cavity | LP | p53 signaling pathway | 38/2418 | 74/8465 | 2.82e-05 | 1.92e-04 | 1.24e-04 | 38 |
| hsa0411533 | Oral cavity | LP | p53 signaling pathway | 38/2418 | 74/8465 | 2.82e-05 | 1.92e-04 | 1.24e-04 | 38 |
| hsa041158 | Prostate | BPH | p53 signaling pathway | 30/1718 | 74/8465 | 5.15e-05 | 3.40e-04 | 2.10e-04 | 30 |
| hsa0411513 | Prostate | BPH | p53 signaling pathway | 30/1718 | 74/8465 | 5.15e-05 | 3.40e-04 | 2.10e-04 | 30 |
| hsa0411522 | Prostate | Tumor | p53 signaling pathway | 29/1791 | 74/8465 | 2.99e-04 | 1.65e-03 | 1.02e-03 | 29 |
| hsa0411532 | Prostate | Tumor | p53 signaling pathway | 29/1791 | 74/8465 | 2.99e-04 | 1.65e-03 | 1.02e-03 | 29 |
| hsa04115 | Stomach | GC | p53 signaling pathway | 13/708 | 74/8465 | 7.76e-03 | 4.10e-02 | 2.88e-02 | 13 |
| hsa041151 | Stomach | GC | p53 signaling pathway | 13/708 | 74/8465 | 7.76e-03 | 4.10e-02 | 2.88e-02 | 13 |
| Page: 1 2 |
Top |
Cell-cell communication analysis |
| Identification of potential cell-cell interactions between two cell types and their ligand-receptor pairs for different disease states |
| Ligand | Receptor | LRpair | Pathway | Tissue | Disease Stage |
| Page: 1 |
Top |
Single-cell gene regulatory network inference analysis |
| Find out the significant the regulons (TFs) and the target genes of each regulon across cell types for different disease states |
| TF | Cell Type | Tissue | Disease Stage | Target Gene | RSS | Regulon Activity |
| ∗The dot plots of a searched regulon are shown for all cell subpopulations in each disease state of each tissue based on the regulon specific score inferred using pySCENIC and by calculating the average expression. |
| Page: 1 |
Top |
Somatic mutation of malignant transformation related genes |
| Annotation of somatic variants for genes involved in malignant transformation |
| Hugo Symbol | Variant Class | Variant Classification | dbSNP RS | HGVSc | HGVSp | HGVSp Short | SWISSPROT | BIOTYPE | SIFT | PolyPhen | Tumor Sample Barcode | Tissue | Histology | Sex | Age | Stage | Therapy Types | Drugs | Outcome |
| SIVA1 | SNV | Missense_Mutation | c.221N>A | p.Gly74Asp | p.G74D | O15304 | protein_coding | tolerated(0.08) | benign(0.053) | TCGA-AN-A0AK-01 | Breast | breast invasive carcinoma | Female | >=65 | I/II | Unknown | Unknown | SD | |
| SIVA1 | SNV | Missense_Mutation | rs753479469 | c.395N>A | p.Arg132Gln | p.R132Q | O15304 | protein_coding | tolerated(0.08) | probably_damaging(0.998) | TCGA-EA-A3HS-01 | Cervix | cervical & endocervical cancer | Female | <65 | I/II | Unknown | Unknown | SD |
| SIVA1 | insertion | Frame_Shift_Ins | novel | c.444_445insA | p.Ala149SerfsTer12 | p.A149Sfs*12 | O15304 | protein_coding | TCGA-DS-A1OA-01 | Cervix | cervical & endocervical cancer | Female | >=65 | I/II | Chemotherapy | carboplatin | PD | ||
| SIVA1 | SNV | Missense_Mutation | novel | c.92N>T | p.Ala31Val | p.A31V | O15304 | protein_coding | deleterious(0.01) | benign(0.355) | TCGA-AD-6964-01 | Colorectum | colon adenocarcinoma | Male | <65 | III/IV | Chemotherapy | folfox | PD |
| SIVA1 | SNV | Missense_Mutation | novel | c.255N>T | p.Gln85His | p.Q85H | O15304 | protein_coding | deleterious(0) | probably_damaging(0.998) | TCGA-AZ-4315-01 | Colorectum | colon adenocarcinoma | Male | <65 | I/II | Unknown | Unknown | SD |
| SIVA1 | SNV | Missense_Mutation | rs367890831 | c.329C>T | p.Ala110Val | p.A110V | O15304 | protein_coding | tolerated(0.31) | benign(0.011) | TCGA-AP-A051-01 | Endometrium | uterine corpus endometrioid carcinoma | Female | >=65 | I/II | Unknown | Unknown | SD |
| SIVA1 | SNV | Missense_Mutation | rs138681592 | c.169G>A | p.Val57Met | p.V57M | O15304 | protein_coding | tolerated(0.4) | benign(0.027) | TCGA-AP-A056-01 | Endometrium | uterine corpus endometrioid carcinoma | Female | <65 | I/II | Unknown | Unknown | SD |
| SIVA1 | SNV | Missense_Mutation | novel | c.211C>T | p.Pro71Ser | p.P71S | O15304 | protein_coding | tolerated(0.11) | benign(0.34) | TCGA-AX-A1CE-01 | Endometrium | uterine corpus endometrioid carcinoma | Female | <65 | I/II | Unspecific | Paclitaxel | SD |
| SIVA1 | SNV | Missense_Mutation | c.397G>A | p.Ala133Thr | p.A133T | O15304 | protein_coding | tolerated(0.39) | possibly_damaging(0.629) | TCGA-D1-A15X-01 | Endometrium | uterine corpus endometrioid carcinoma | Female | <65 | I/II | Unknown | Unknown | SD | |
| SIVA1 | SNV | Missense_Mutation | rs762902272 | c.247N>T | p.Arg83Cys | p.R83C | O15304 | protein_coding | deleterious(0) | possibly_damaging(0.894) | TCGA-FI-A2D0-01 | Endometrium | uterine corpus endometrioid carcinoma | Female | <65 | I/II | Unknown | Unknown | SD |
| Page: 1 2 |
Top |
Related drugs of malignant transformation related genes |
| Identification of chemicals and drugs interact with genes involved in malignant transfromation |
| (DGIdb 4.0) |
| Entrez ID | Symbol | Category | Interaction Types | Drug Claim Name | Drug Name | PMIDs |
| Page: 1 |

Copyright 2023-Present -The University of Texas Health Science Center at Houston |