
|
|||||
|
 | |
| |
| |
| |
| |
| |
|
Gene: SIRT3 |
Gene summary for SIRT3 |
| Gene information | Species | Human | Gene symbol | SIRT3 | Gene ID | 23410 |
| Gene name | sirtuin 3 | |
| Gene Alias | SIR2L3 | |
| Cytomap | 11p15.5 | |
| Gene Type | protein-coding | GO ID | GO:0000165 | UniProtAcc | Q9NTG7 |
Top |
Malignant transformation analysis |
| Identification of the aberrant gene expression in precancerous and cancerous lesions by comparing the gene expression of stem-like cells in diseased tissues with normal stem cells |
| Entrez ID | Symbol | Replicates | Species | Organ | Tissue | Adj P-value | Log2FC | Malignancy |
| 23410 | SIRT3 | LZE4T | Human | Esophagus | ESCC | 7.68e-07 | 1.32e-01 | 0.0811 |
| 23410 | SIRT3 | LZE8T | Human | Esophagus | ESCC | 1.23e-07 | 1.59e-01 | 0.067 |
| 23410 | SIRT3 | LZE20T | Human | Esophagus | ESCC | 1.58e-04 | 1.11e-01 | 0.0662 |
| 23410 | SIRT3 | LZE24T | Human | Esophagus | ESCC | 5.49e-20 | 3.42e-01 | 0.0596 |
| 23410 | SIRT3 | P1T-E | Human | Esophagus | ESCC | 4.62e-02 | 1.15e-01 | 0.0875 |
| 23410 | SIRT3 | P2T-E | Human | Esophagus | ESCC | 5.88e-16 | 2.92e-01 | 0.1177 |
| 23410 | SIRT3 | P4T-E | Human | Esophagus | ESCC | 1.29e-17 | 2.61e-01 | 0.1323 |
| 23410 | SIRT3 | P5T-E | Human | Esophagus | ESCC | 4.55e-04 | 3.57e-02 | 0.1327 |
| 23410 | SIRT3 | P8T-E | Human | Esophagus | ESCC | 5.70e-05 | 1.18e-01 | 0.0889 |
| 23410 | SIRT3 | P9T-E | Human | Esophagus | ESCC | 4.53e-06 | 1.78e-01 | 0.1131 |
| 23410 | SIRT3 | P10T-E | Human | Esophagus | ESCC | 1.86e-08 | 1.82e-01 | 0.116 |
| 23410 | SIRT3 | P11T-E | Human | Esophagus | ESCC | 3.06e-08 | 3.18e-01 | 0.1426 |
| 23410 | SIRT3 | P12T-E | Human | Esophagus | ESCC | 1.07e-17 | 3.03e-01 | 0.1122 |
| 23410 | SIRT3 | P15T-E | Human | Esophagus | ESCC | 1.03e-20 | 3.15e-01 | 0.1149 |
| 23410 | SIRT3 | P16T-E | Human | Esophagus | ESCC | 2.52e-10 | 2.17e-01 | 0.1153 |
| 23410 | SIRT3 | P17T-E | Human | Esophagus | ESCC | 4.04e-08 | 2.99e-01 | 0.1278 |
| 23410 | SIRT3 | P19T-E | Human | Esophagus | ESCC | 7.63e-04 | 2.83e-01 | 0.1662 |
| 23410 | SIRT3 | P20T-E | Human | Esophagus | ESCC | 6.74e-14 | 2.49e-01 | 0.1124 |
| 23410 | SIRT3 | P21T-E | Human | Esophagus | ESCC | 3.15e-14 | 2.82e-01 | 0.1617 |
| 23410 | SIRT3 | P22T-E | Human | Esophagus | ESCC | 4.36e-18 | 3.37e-01 | 0.1236 |
| Page: 1 2 3 4 |
| Tissue | Expression Dynamics | Abbreviation |
| Esophagus | 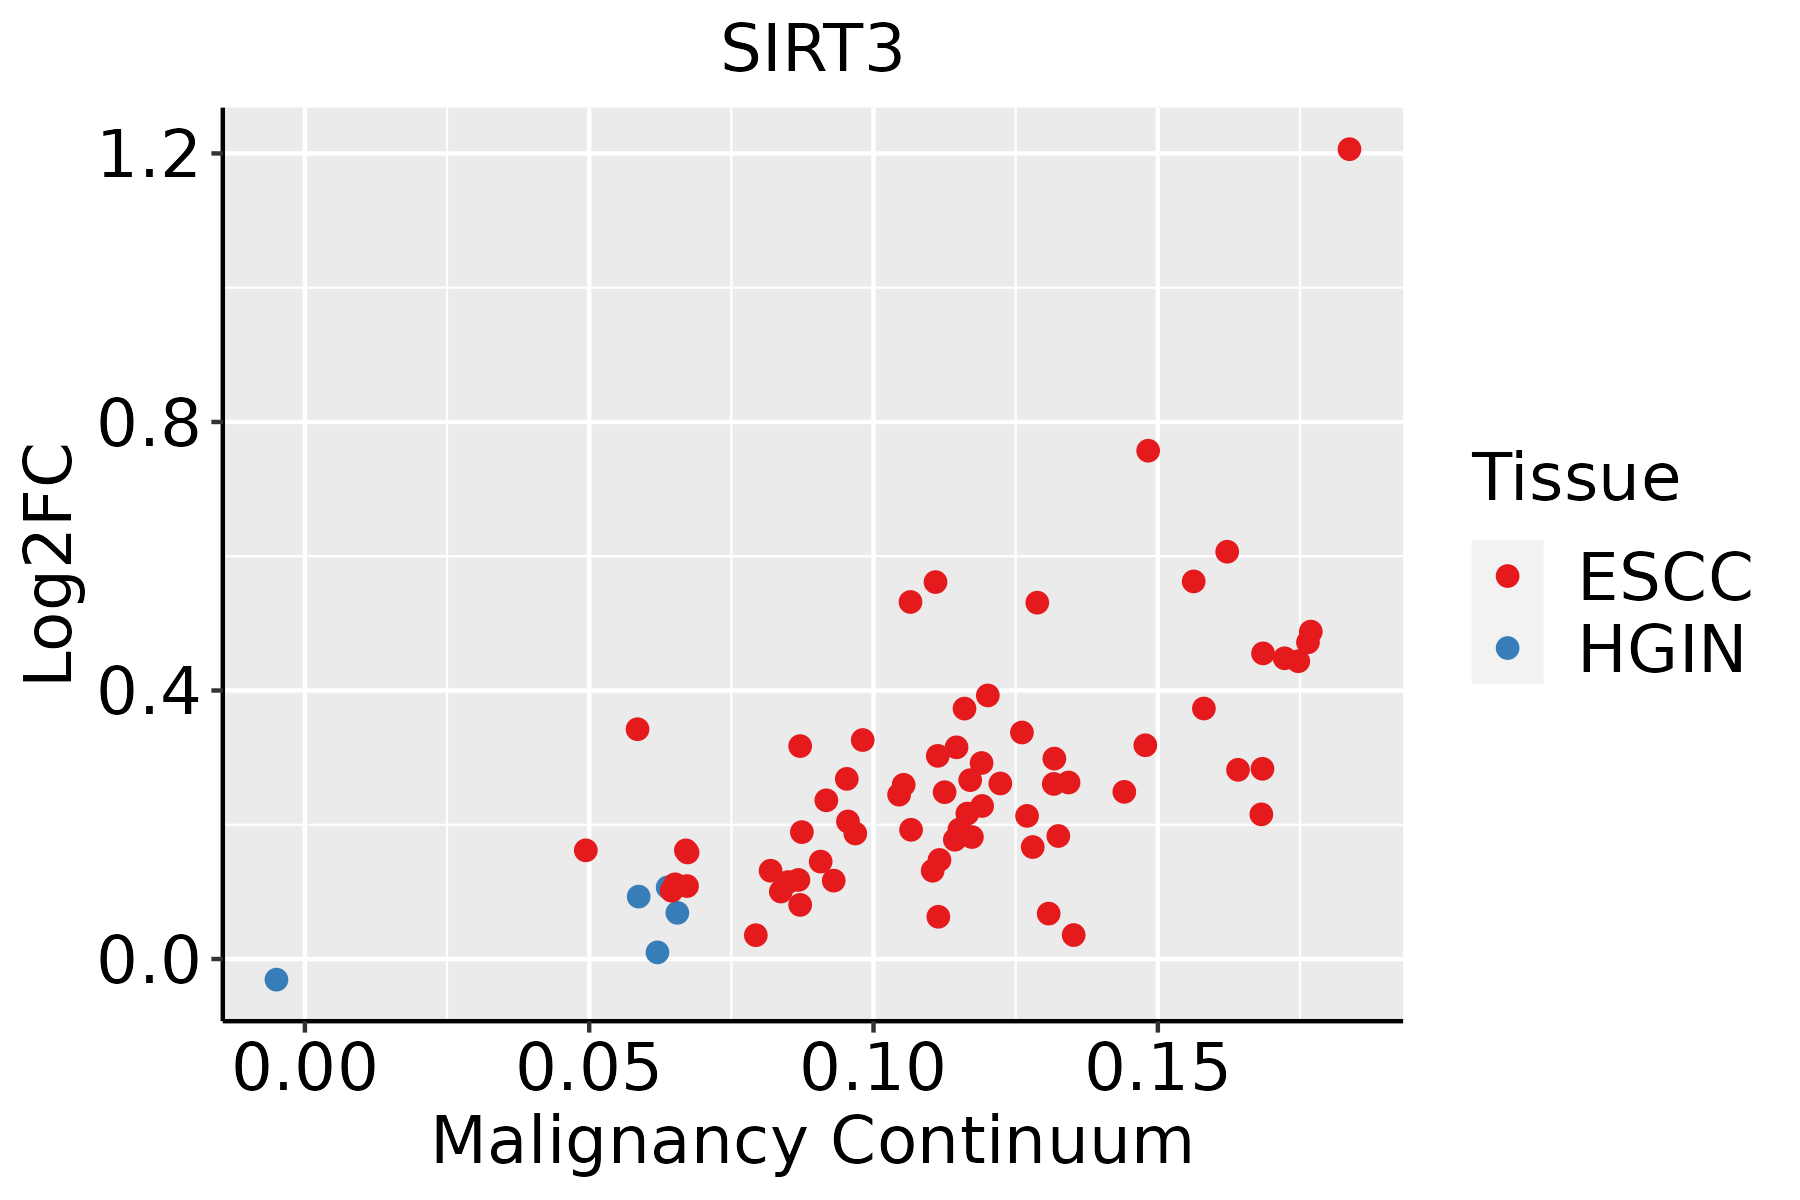 | ESCC: Esophageal squamous cell carcinoma |
| HGIN: High-grade intraepithelial neoplasias | ||
| LGIN: Low-grade intraepithelial neoplasias | ||
| Oral Cavity | 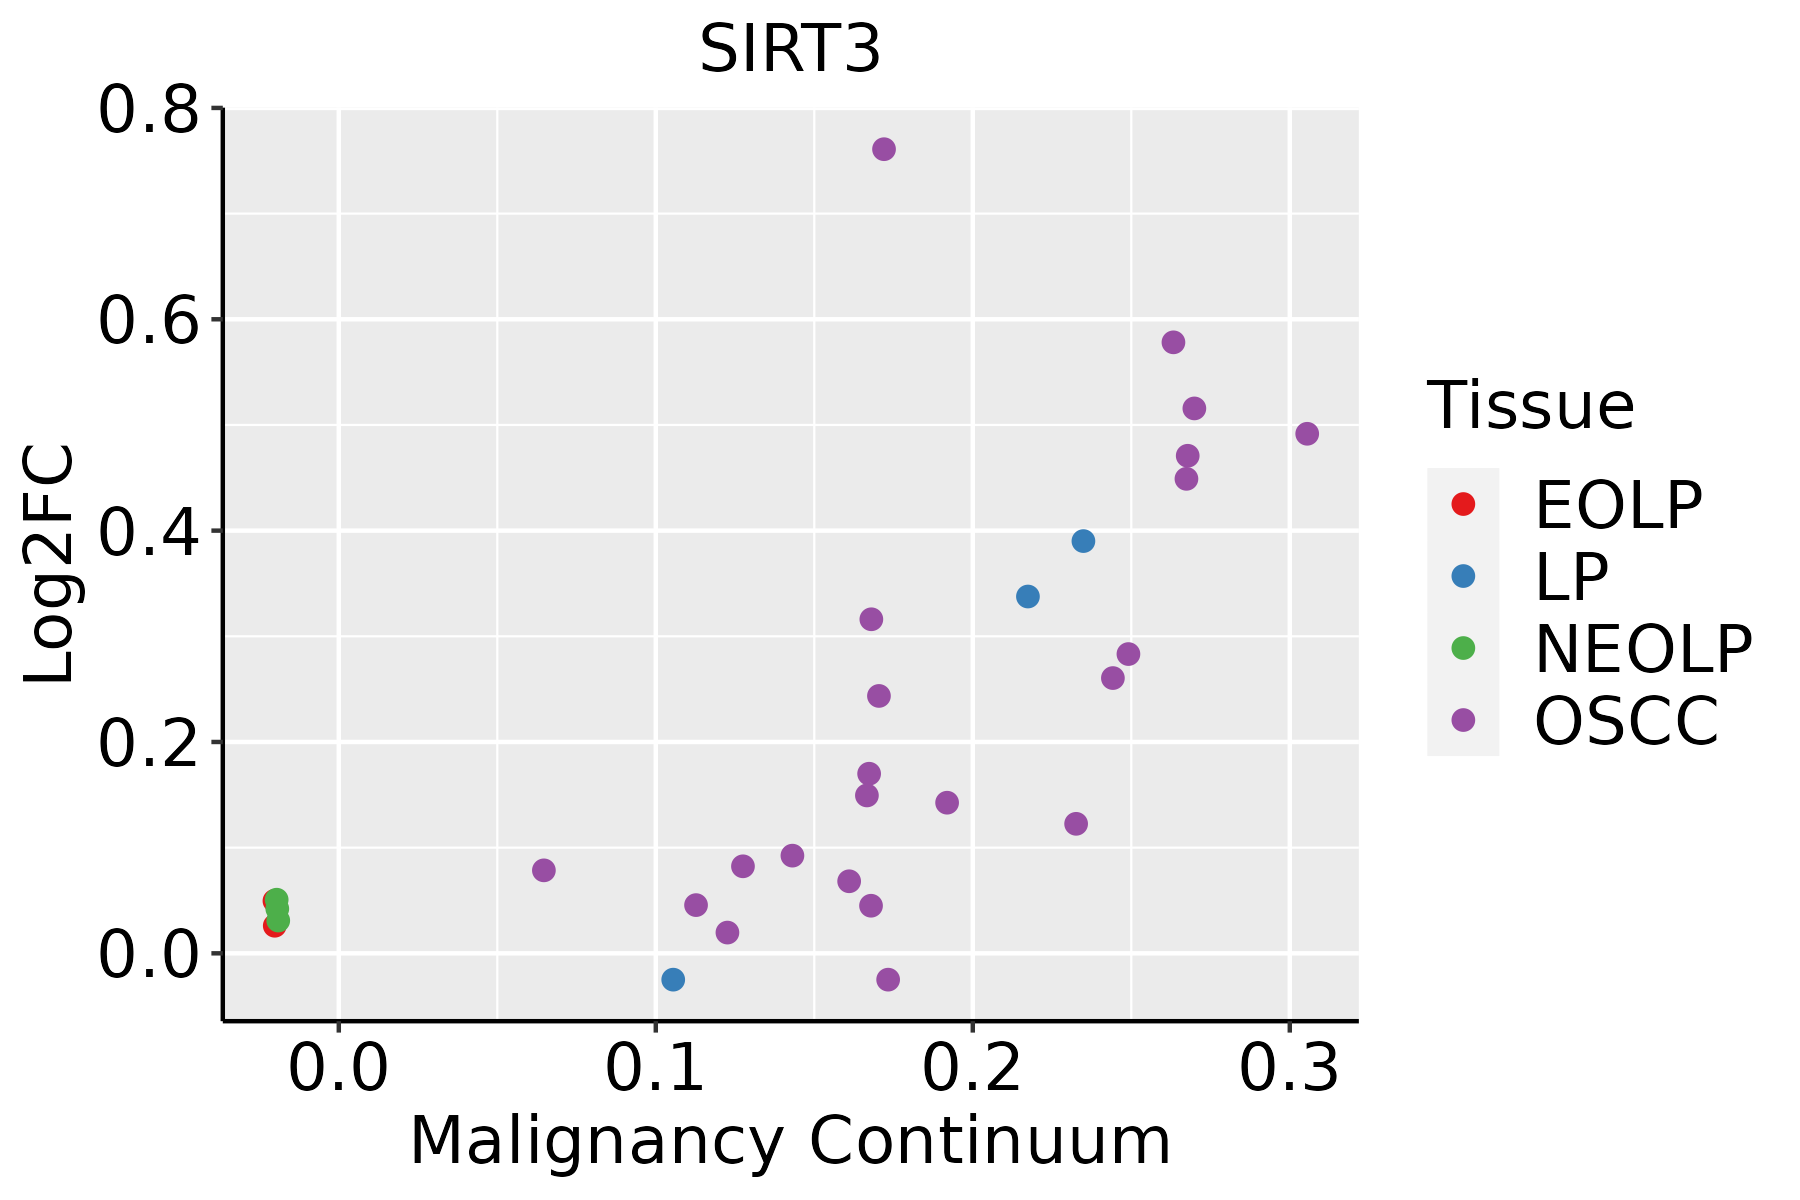 | EOLP: Erosive Oral lichen planus |
| LP: leukoplakia | ||
| NEOLP: Non-erosive oral lichen planus | ||
| OSCC: Oral squamous cell carcinoma |
| ∗log2FC in expression of this searched gene in stem-like cells from each diseased tissue sample relative to stem-like cells in normal samples in each tissue plotted against the malignancy continuum. Samples are colored based on if they are from different disease stage. |
Top |
Malignant transformation related pathway analysis |
| Find out the enriched GO biological processes and KEGG pathways involved in transition from healthy to precancer to cancer |
| Tissue | Disease Stage | Enriched GO biological Processes |
| Colorectum | AD |  |
| Colorectum | SER |  |
| Colorectum | MSS |  |
| Colorectum | MSI-H |  |
| Colorectum | FAP |  |
| ∗Top 15 enriched GO BP terms are showed in the bar plot of each disease state in each tissue. Each row represents a significant GO biological process which is colored according to the -log10(p.adjust). |
| Page: 1 2 3 4 5 6 7 8 9 |
| GO ID | Tissue | Disease Stage | Description | Gene Ratio | Bg Ratio | pvalue | p.adjust | Count |
| GO:001657015 | Esophagus | ESCC | histone modification | 323/8552 | 463/18723 | 2.61e-26 | 7.88e-24 | 323 |
| GO:0006091110 | Esophagus | ESCC | generation of precursor metabolites and energy | 331/8552 | 490/18723 | 3.86e-23 | 8.45e-21 | 331 |
| GO:001820514 | Esophagus | ESCC | peptidyl-lysine modification | 259/8552 | 376/18723 | 3.90e-20 | 5.26e-18 | 259 |
| GO:0045333110 | Esophagus | ESCC | cellular respiration | 173/8552 | 230/18723 | 4.53e-20 | 5.99e-18 | 173 |
| GO:0009060110 | Esophagus | ESCC | aerobic respiration | 145/8552 | 189/18723 | 2.16e-18 | 2.21e-16 | 145 |
| GO:0015980110 | Esophagus | ESCC | energy derivation by oxidation of organic compounds | 220/8552 | 318/18723 | 1.20e-17 | 1.09e-15 | 220 |
| GO:1904951111 | Esophagus | ESCC | positive regulation of establishment of protein localization | 216/8552 | 319/18723 | 1.01e-15 | 6.86e-14 | 216 |
| GO:0034250111 | Esophagus | ESCC | positive regulation of cellular amide metabolic process | 123/8552 | 162/18723 | 3.32e-15 | 1.93e-13 | 123 |
| GO:0051222111 | Esophagus | ESCC | positive regulation of protein transport | 204/8552 | 303/18723 | 1.56e-14 | 8.38e-13 | 204 |
| GO:00356015 | Esophagus | ESCC | protein deacylation | 79/8552 | 112/18723 | 8.30e-08 | 1.42e-06 | 79 |
| GO:00066433 | Esophagus | ESCC | membrane lipid metabolic process | 130/8552 | 203/18723 | 9.29e-08 | 1.54e-06 | 130 |
| GO:000756820 | Esophagus | ESCC | aging | 201/8552 | 339/18723 | 2.64e-07 | 3.94e-06 | 201 |
| GO:00987325 | Esophagus | ESCC | macromolecule deacylation | 80/8552 | 116/18723 | 3.19e-07 | 4.50e-06 | 80 |
| GO:00165754 | Esophagus | ESCC | histone deacetylation | 60/8552 | 82/18723 | 3.85e-07 | 5.32e-06 | 60 |
| GO:00064765 | Esophagus | ESCC | protein deacetylation | 70/8552 | 101/18723 | 1.29e-06 | 1.58e-05 | 70 |
| GO:200037718 | Esophagus | ESCC | regulation of reactive oxygen species metabolic process | 100/8552 | 157/18723 | 3.87e-06 | 4.17e-05 | 100 |
| GO:00464673 | Esophagus | ESCC | membrane lipid biosynthetic process | 91/8552 | 142/18723 | 7.19e-06 | 7.19e-05 | 91 |
| GO:00066652 | Esophagus | ESCC | sphingolipid metabolic process | 96/8552 | 155/18723 | 3.21e-05 | 2.66e-04 | 96 |
| GO:007259318 | Esophagus | ESCC | reactive oxygen species metabolic process | 137/8552 | 239/18723 | 1.82e-04 | 1.16e-03 | 137 |
| GO:0043409110 | Esophagus | ESCC | negative regulation of MAPK cascade | 105/8552 | 180/18723 | 4.13e-04 | 2.35e-03 | 105 |
| Page: 1 2 3 4 5 |
| Pathway ID | Tissue | Disease Stage | Description | Gene Ratio | Bg Ratio | pvalue | p.adjust | qvalue | Count |
| hsa0523018 | Esophagus | ESCC | Central carbon metabolism in cancer | 50/4205 | 70/8465 | 1.70e-04 | 6.62e-04 | 3.39e-04 | 50 |
| hsa0523019 | Esophagus | ESCC | Central carbon metabolism in cancer | 50/4205 | 70/8465 | 1.70e-04 | 6.62e-04 | 3.39e-04 | 50 |
| hsa0523016 | Oral cavity | OSCC | Central carbon metabolism in cancer | 49/3704 | 70/8465 | 7.57e-06 | 3.59e-05 | 1.83e-05 | 49 |
| hsa0523017 | Oral cavity | OSCC | Central carbon metabolism in cancer | 49/3704 | 70/8465 | 7.57e-06 | 3.59e-05 | 1.83e-05 | 49 |
| hsa0523023 | Oral cavity | LP | Central carbon metabolism in cancer | 31/2418 | 70/8465 | 3.50e-03 | 1.46e-02 | 9.40e-03 | 31 |
| hsa0523033 | Oral cavity | LP | Central carbon metabolism in cancer | 31/2418 | 70/8465 | 3.50e-03 | 1.46e-02 | 9.40e-03 | 31 |
| Page: 1 |
Top |
Cell-cell communication analysis |
| Identification of potential cell-cell interactions between two cell types and their ligand-receptor pairs for different disease states |
| Ligand | Receptor | LRpair | Pathway | Tissue | Disease Stage |
| Page: 1 |
Top |
Single-cell gene regulatory network inference analysis |
| Find out the significant the regulons (TFs) and the target genes of each regulon across cell types for different disease states |
| TF | Cell Type | Tissue | Disease Stage | Target Gene | RSS | Regulon Activity |
| ∗The dot plots of a searched regulon are shown for all cell subpopulations in each disease state of each tissue based on the regulon specific score inferred using pySCENIC and by calculating the average expression. |
| Page: 1 |
Top |
Somatic mutation of malignant transformation related genes |
| Annotation of somatic variants for genes involved in malignant transformation |
| Hugo Symbol | Variant Class | Variant Classification | dbSNP RS | HGVSc | HGVSp | HGVSp Short | SWISSPROT | BIOTYPE | SIFT | PolyPhen | Tumor Sample Barcode | Tissue | Histology | Sex | Age | Stage | Therapy Types | Drugs | Outcome |
| SIRT3 | SNV | Missense_Mutation | c.874N>T | p.Val292Leu | p.V292L | Q9NTG7 | protein_coding | deleterious(0) | possibly_damaging(0.71) | TCGA-BH-A0EI-01 | Breast | breast invasive carcinoma | Female | <65 | I/II | Unknown | Unknown | SD | |
| SIRT3 | SNV | Missense_Mutation | rs200203977 | c.1166N>A | p.Arg389Gln | p.R389Q | Q9NTG7 | protein_coding | tolerated(0.45) | benign(0.003) | TCGA-E9-A245-01 | Breast | breast invasive carcinoma | Female | <65 | I/II | Hormone Therapy | tamoxiphen | SD |
| SIRT3 | SNV | Missense_Mutation | c.490N>A | p.Leu164Met | p.L164M | Q9NTG7 | protein_coding | deleterious(0) | probably_damaging(0.996) | TCGA-EW-A1IZ-01 | Breast | breast invasive carcinoma | Female | <65 | III/IV | Chemotherapy | taxotere | SD | |
| SIRT3 | insertion | Frame_Shift_Ins | novel | c.501_502insTTCCACCTCCCGGGTTCAAGCGATT | p.Leu168PhefsTer22 | p.L168Ffs*22 | Q9NTG7 | protein_coding | TCGA-A8-A06X-01 | Breast | breast invasive carcinoma | Female | >=65 | I/II | Unknown | Unknown | SD | ||
| SIRT3 | SNV | Missense_Mutation | novel | c.956N>T | p.Gly319Val | p.G319V | Q9NTG7 | protein_coding | deleterious(0) | probably_damaging(1) | TCGA-2W-A8YY-01 | Cervix | cervical & endocervical cancer | Female | <65 | I/II | Chemotherapy | cisplatin | CR |
| SIRT3 | SNV | Missense_Mutation | c.455N>A | p.Ser152Asn | p.S152N | Q9NTG7 | protein_coding | deleterious(0) | probably_damaging(0.978) | TCGA-AD-6889-01 | Colorectum | colon adenocarcinoma | Male | >=65 | I/II | Chemotherapy | xeloda | PD | |
| SIRT3 | SNV | Missense_Mutation | c.872N>G | p.Ile291Ser | p.I291S | Q9NTG7 | protein_coding | deleterious(0.01) | probably_damaging(0.998) | TCGA-CM-4743-01 | Colorectum | colon adenocarcinoma | Male | >=65 | I/II | Chemotherapy | capecitabine | SD | |
| SIRT3 | SNV | Missense_Mutation | c.322N>A | p.Ala108Thr | p.A108T | Q9NTG7 | protein_coding | tolerated(0.19) | benign(0.005) | TCGA-D5-6928-01 | Colorectum | colon adenocarcinoma | Male | >=65 | I/II | Unknown | Unknown | SD | |
| SIRT3 | SNV | Missense_Mutation | c.490N>A | p.Leu164Met | p.L164M | Q9NTG7 | protein_coding | deleterious(0) | probably_damaging(0.996) | TCGA-NH-A5IV-01 | Colorectum | colon adenocarcinoma | Female | >=65 | I/II | Unknown | Unknown | SD | |
| SIRT3 | SNV | Missense_Mutation | novel | c.695N>T | p.Gly232Val | p.G232V | Q9NTG7 | protein_coding | deleterious(0.02) | probably_damaging(0.999) | TCGA-A5-A0G2-01 | Endometrium | uterine corpus endometrioid carcinoma | Female | <65 | III/IV | Unknown | Unknown | SD |
| Page: 1 2 3 |
Top |
Related drugs of malignant transformation related genes |
| Identification of chemicals and drugs interact with genes involved in malignant transfromation |
| (DGIdb 4.0) |
| Entrez ID | Symbol | Category | Interaction Types | Drug Claim Name | Drug Name | PMIDs |
| 23410 | SIRT3 | DRUGGABLE GENOME, TRANSCRIPTION FACTOR, ENZYME | SURAMIN | SURAMIN | 22835719 | |
| 23410 | SIRT3 | DRUGGABLE GENOME, TRANSCRIPTION FACTOR, ENZYME | 4-METHYLNICOTINAMIDE | CHEMBL1501622 | 22835719 | |
| 23410 | SIRT3 | DRUGGABLE GENOME, TRANSCRIPTION FACTOR, ENZYME | inhibitor | 252827436 | ||
| 23410 | SIRT3 | DRUGGABLE GENOME, TRANSCRIPTION FACTOR, ENZYME | NIACINAMIDE | NIACINAMIDE | 22835719 |
| Page: 1 |

Copyright 2023-Present -The University of Texas Health Science Center at Houston |