
|
|||||
|
 | |
| |
| |
| |
| |
| |
|
Gene: SIRPA |
Gene summary for SIRPA |
| Gene information | Species | Human | Gene symbol | SIRPA | Gene ID | 140885 |
| Gene name | signal regulatory protein alpha | |
| Gene Alias | BIT | |
| Cytomap | 20p13 | |
| Gene Type | protein-coding | GO ID | GO:0000165 | UniProtAcc | P78324 |
Top |
Malignant transformation analysis |
| Identification of the aberrant gene expression in precancerous and cancerous lesions by comparing the gene expression of stem-like cells in diseased tissues with normal stem cells |
| Entrez ID | Symbol | Replicates | Species | Organ | Tissue | Adj P-value | Log2FC | Malignancy |
| 140885 | SIRPA | P2T-E | Human | Esophagus | ESCC | 2.37e-18 | 2.60e-01 | 0.1177 |
| 140885 | SIRPA | P5T-E | Human | Esophagus | ESCC | 9.33e-06 | 4.02e-03 | 0.1327 |
| 140885 | SIRPA | P11T-E | Human | Esophagus | ESCC | 8.58e-07 | 3.89e-01 | 0.1426 |
| 140885 | SIRPA | P12T-E | Human | Esophagus | ESCC | 2.42e-04 | 2.30e-02 | 0.1122 |
| 140885 | SIRPA | P16T-E | Human | Esophagus | ESCC | 6.08e-10 | 1.08e-01 | 0.1153 |
| 140885 | SIRPA | P17T-E | Human | Esophagus | ESCC | 3.44e-04 | 1.49e-01 | 0.1278 |
| 140885 | SIRPA | P21T-E | Human | Esophagus | ESCC | 6.31e-33 | 6.78e-01 | 0.1617 |
| 140885 | SIRPA | P22T-E | Human | Esophagus | ESCC | 2.06e-07 | 5.92e-02 | 0.1236 |
| 140885 | SIRPA | P24T-E | Human | Esophagus | ESCC | 1.21e-03 | 1.12e-01 | 0.1287 |
| 140885 | SIRPA | P26T-E | Human | Esophagus | ESCC | 8.50e-15 | 9.53e-02 | 0.1276 |
| 140885 | SIRPA | P28T-E | Human | Esophagus | ESCC | 1.00e-04 | 3.85e-02 | 0.1149 |
| 140885 | SIRPA | P30T-E | Human | Esophagus | ESCC | 2.89e-03 | 4.37e-01 | 0.137 |
| 140885 | SIRPA | P31T-E | Human | Esophagus | ESCC | 3.29e-14 | 1.94e-01 | 0.1251 |
| 140885 | SIRPA | P32T-E | Human | Esophagus | ESCC | 9.33e-26 | 5.25e-01 | 0.1666 |
| 140885 | SIRPA | P36T-E | Human | Esophagus | ESCC | 1.69e-04 | 1.57e-01 | 0.1187 |
| 140885 | SIRPA | P37T-E | Human | Esophagus | ESCC | 3.62e-22 | 4.94e-01 | 0.1371 |
| 140885 | SIRPA | P40T-E | Human | Esophagus | ESCC | 9.70e-08 | 3.17e-01 | 0.109 |
| 140885 | SIRPA | P42T-E | Human | Esophagus | ESCC | 7.03e-04 | 2.31e-01 | 0.1175 |
| 140885 | SIRPA | P44T-E | Human | Esophagus | ESCC | 3.67e-07 | 1.09e-01 | 0.1096 |
| 140885 | SIRPA | P47T-E | Human | Esophagus | ESCC | 5.61e-14 | 2.51e-01 | 0.1067 |
| Page: 1 2 3 4 |
| Tissue | Expression Dynamics | Abbreviation |
| Esophagus |  | ESCC: Esophageal squamous cell carcinoma |
| HGIN: High-grade intraepithelial neoplasias | ||
| LGIN: Low-grade intraepithelial neoplasias | ||
| Liver |  | HCC: Hepatocellular carcinoma |
| NAFLD: Non-alcoholic fatty liver disease | ||
| Oral Cavity | 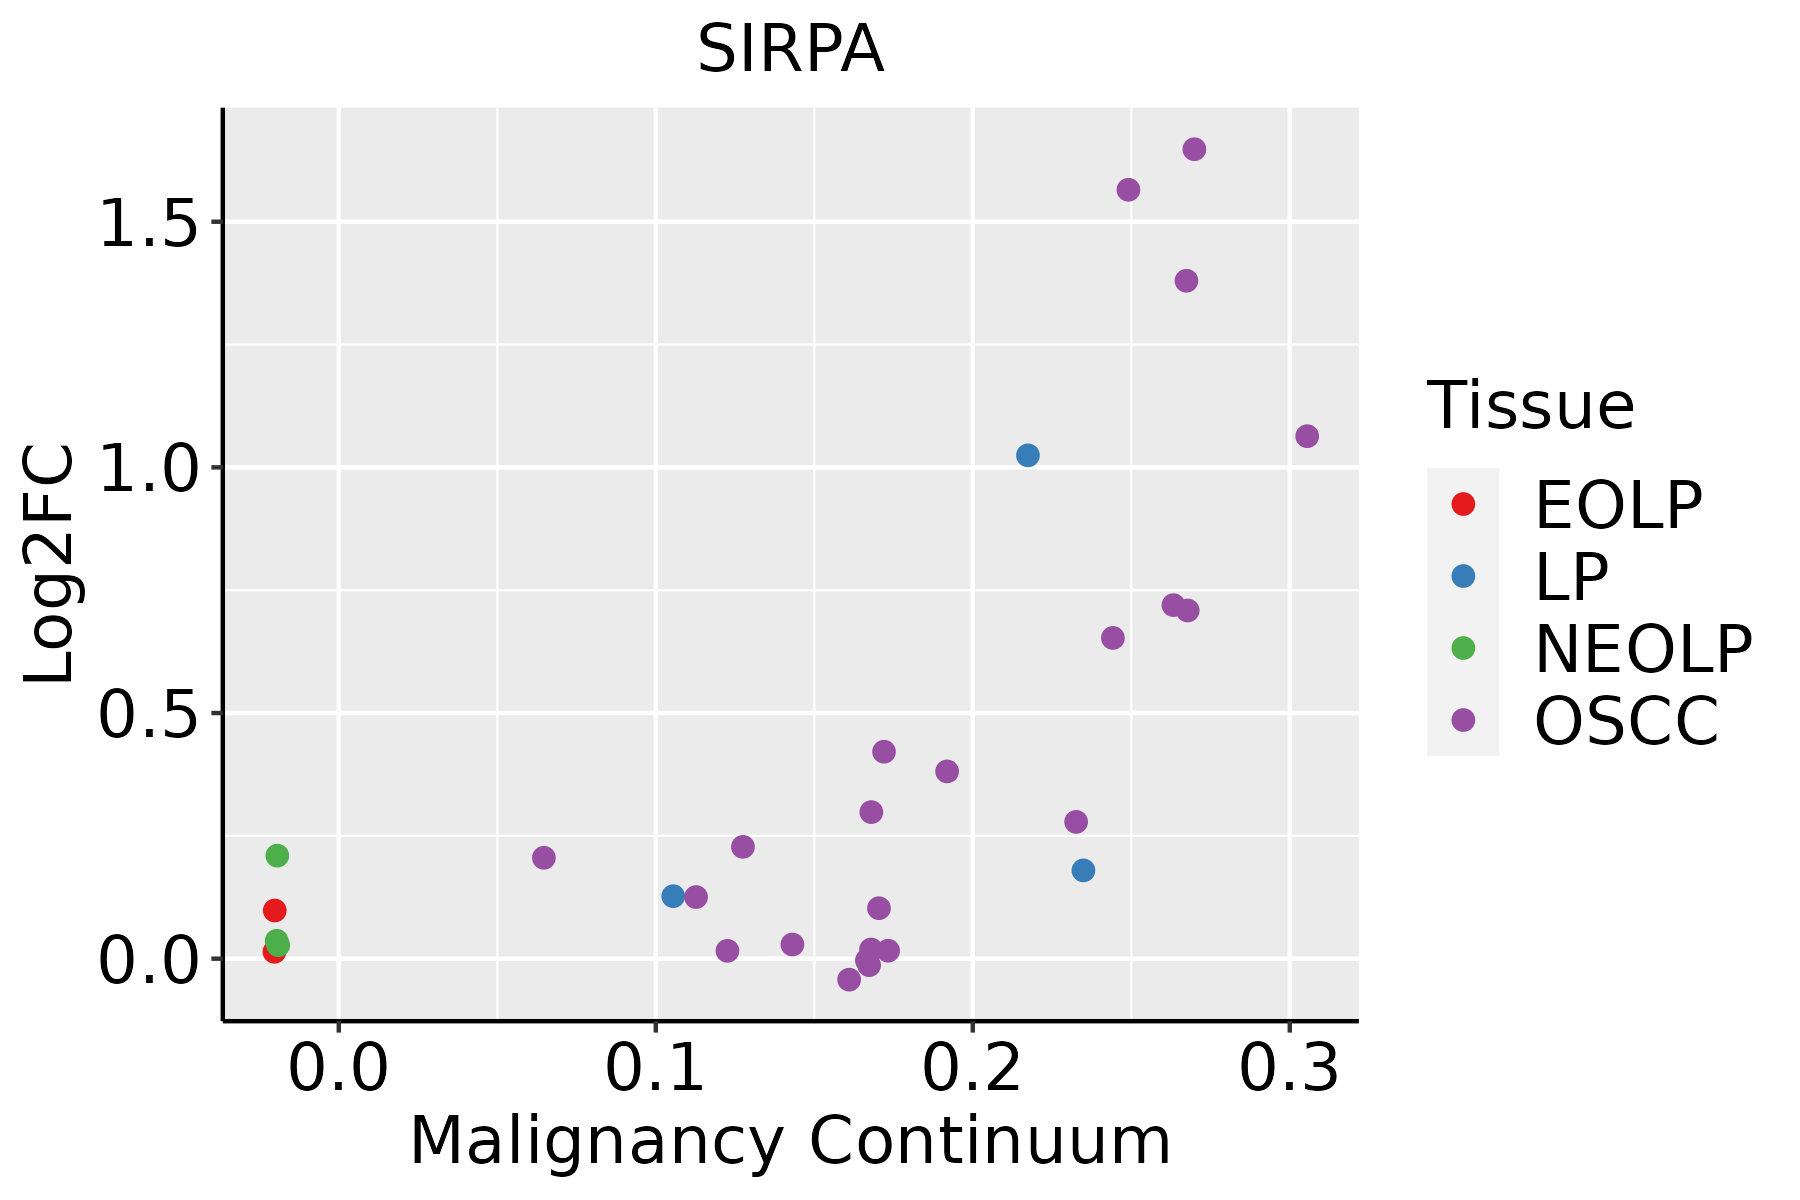 | EOLP: Erosive Oral lichen planus |
| LP: leukoplakia | ||
| NEOLP: Non-erosive oral lichen planus | ||
| OSCC: Oral squamous cell carcinoma | ||
| Skin |  | AK: Actinic keratosis |
| cSCC: Cutaneous squamous cell carcinoma | ||
| SCCIS:squamous cell carcinoma in situ |
| ∗log2FC in expression of this searched gene in stem-like cells from each diseased tissue sample relative to stem-like cells in normal samples in each tissue plotted against the malignancy continuum. Samples are colored based on if they are from different disease stage. |
Top |
Malignant transformation related pathway analysis |
| Find out the enriched GO biological processes and KEGG pathways involved in transition from healthy to precancer to cancer |
| Tissue | Disease Stage | Enriched GO biological Processes |
| Colorectum | AD |  |
| Colorectum | SER |  |
| Colorectum | MSS |  |
| Colorectum | MSI-H |  |
| Colorectum | FAP |  |
| ∗Top 15 enriched GO BP terms are showed in the bar plot of each disease state in each tissue. Each row represents a significant GO biological process which is colored according to the -log10(p.adjust). |
| Page: 1 2 3 4 5 6 7 8 9 |
| GO ID | Tissue | Disease Stage | Description | Gene Ratio | Bg Ratio | pvalue | p.adjust | Count |
| GO:0006979111 | Esophagus | ESCC | response to oxidative stress | 303/8552 | 446/18723 | 7.15e-22 | 1.30e-19 | 303 |
| GO:0062197111 | Esophagus | ESCC | cellular response to chemical stress | 234/8552 | 337/18723 | 5.37e-19 | 5.97e-17 | 234 |
| GO:0034599111 | Esophagus | ESCC | cellular response to oxidative stress | 197/8552 | 288/18723 | 3.76e-15 | 2.15e-13 | 197 |
| GO:0010563111 | Esophagus | ESCC | negative regulation of phosphorus metabolic process | 274/8552 | 442/18723 | 2.32e-12 | 9.41e-11 | 274 |
| GO:0045936111 | Esophagus | ESCC | negative regulation of phosphate metabolic process | 273/8552 | 441/18723 | 3.18e-12 | 1.25e-10 | 273 |
| GO:000724919 | Esophagus | ESCC | I-kappaB kinase/NF-kappaB signaling | 183/8552 | 281/18723 | 3.02e-11 | 1.01e-09 | 183 |
| GO:0000302111 | Esophagus | ESCC | response to reactive oxygen species | 150/8552 | 222/18723 | 3.06e-11 | 1.02e-09 | 150 |
| GO:0042326111 | Esophagus | ESCC | negative regulation of phosphorylation | 237/8552 | 385/18723 | 1.86e-10 | 5.33e-09 | 237 |
| GO:0001933111 | Esophagus | ESCC | negative regulation of protein phosphorylation | 213/8552 | 342/18723 | 3.54e-10 | 9.76e-09 | 213 |
| GO:0042542111 | Esophagus | ESCC | response to hydrogen peroxide | 102/8552 | 146/18723 | 2.64e-09 | 5.81e-08 | 102 |
| GO:004578527 | Esophagus | ESCC | positive regulation of cell adhesion | 255/8552 | 437/18723 | 5.07e-08 | 9.11e-07 | 255 |
| GO:003109818 | Esophagus | ESCC | stress-activated protein kinase signaling cascade | 154/8552 | 247/18723 | 8.53e-08 | 1.44e-06 | 154 |
| GO:003461420 | Esophagus | ESCC | cellular response to reactive oxygen species | 103/8552 | 155/18723 | 1.34e-07 | 2.17e-06 | 103 |
| GO:005140318 | Esophagus | ESCC | stress-activated MAPK cascade | 147/8552 | 239/18723 | 5.43e-07 | 7.18e-06 | 147 |
| GO:00703018 | Esophagus | ESCC | cellular response to hydrogen peroxide | 68/8552 | 98/18723 | 1.70e-06 | 2.03e-05 | 68 |
| GO:007030217 | Esophagus | ESCC | regulation of stress-activated protein kinase signaling cascade | 119/8552 | 195/18723 | 1.07e-05 | 1.01e-04 | 119 |
| GO:003287217 | Esophagus | ESCC | regulation of stress-activated MAPK cascade | 116/8552 | 192/18723 | 2.63e-05 | 2.21e-04 | 116 |
| GO:00072549 | Esophagus | ESCC | JNK cascade | 102/8552 | 167/18723 | 4.22e-05 | 3.39e-04 | 102 |
| GO:00326084 | Esophagus | ESCC | interferon-beta production | 40/8552 | 56/18723 | 8.36e-05 | 6.08e-04 | 40 |
| GO:00326484 | Esophagus | ESCC | regulation of interferon-beta production | 40/8552 | 56/18723 | 8.36e-05 | 6.08e-04 | 40 |
| Page: 1 2 3 4 5 6 7 8 9 10 11 |
| Pathway ID | Tissue | Disease Stage | Description | Gene Ratio | Bg Ratio | pvalue | p.adjust | qvalue | Count |
| hsa043806 | Oral cavity | OSCC | Osteoclast differentiation | 73/3704 | 128/8465 | 1.60e-03 | 4.44e-03 | 2.26e-03 | 73 |
| hsa0438011 | Oral cavity | OSCC | Osteoclast differentiation | 73/3704 | 128/8465 | 1.60e-03 | 4.44e-03 | 2.26e-03 | 73 |
| Page: 1 |
Top |
Cell-cell communication analysis |
| Identification of potential cell-cell interactions between two cell types and their ligand-receptor pairs for different disease states |
| Ligand | Receptor | LRpair | Pathway | Tissue | Disease Stage |
| Page: 1 |
Top |
Single-cell gene regulatory network inference analysis |
| Find out the significant the regulons (TFs) and the target genes of each regulon across cell types for different disease states |
| TF | Cell Type | Tissue | Disease Stage | Target Gene | RSS | Regulon Activity |
| ∗The dot plots of a searched regulon are shown for all cell subpopulations in each disease state of each tissue based on the regulon specific score inferred using pySCENIC and by calculating the average expression. |
| Page: 1 |
Top |
Somatic mutation of malignant transformation related genes |
| Annotation of somatic variants for genes involved in malignant transformation |
| Hugo Symbol | Variant Class | Variant Classification | dbSNP RS | HGVSc | HGVSp | HGVSp Short | SWISSPROT | BIOTYPE | SIFT | PolyPhen | Tumor Sample Barcode | Tissue | Histology | Sex | Age | Stage | Therapy Types | Drugs | Outcome |
| SIRPA | SNV | Missense_Mutation | novel | c.1169N>T | p.Ala390Val | p.A390V | P78324 | protein_coding | tolerated(0.69) | benign(0.067) | TCGA-A7-A4SE-01 | Breast | breast invasive carcinoma | Female | <65 | I/II | Chemotherapy | adriamycin | CR |
| SIRPA | SNV | Missense_Mutation | c.1376N>C | p.Ser459Thr | p.S459T | P78324 | protein_coding | tolerated(0.19) | probably_damaging(0.99) | TCGA-AR-A251-01 | Breast | breast invasive carcinoma | Female | <65 | III/IV | Chemotherapy | doxorubicin | SD | |
| SIRPA | SNV | Missense_Mutation | rs143385810 | c.664N>A | p.Val222Ile | p.V222I | P78324 | protein_coding | tolerated(0.16) | benign(0) | TCGA-BH-A0DS-01 | Breast | breast invasive carcinoma | Female | >=65 | III/IV | Chemotherapy | cyclophosphamide | SD |
| SIRPA | SNV | Missense_Mutation | rs779342446 | c.434G>A | p.Arg145His | p.R145H | P78324 | protein_coding | tolerated(0.6) | benign(0.328) | TCGA-D8-A1XQ-01 | Breast | breast invasive carcinoma | Female | >=65 | I/II | Unknown | Unknown | SD |
| SIRPA | SNV | Missense_Mutation | novel | c.838C>A | p.Pro280Thr | p.P280T | P78324 | protein_coding | deleterious(0) | probably_damaging(1) | TCGA-S3-AA11-01 | Breast | breast invasive carcinoma | Female | >=65 | I/II | Hormone Therapy | letrozole | CR |
| SIRPA | insertion | Frame_Shift_Ins | novel | c.1073_1074insCATAACGT | p.Asn359IlefsTer3 | p.N359Ifs*3 | P78324 | protein_coding | TCGA-A8-A096-01 | Breast | breast invasive carcinoma | Female | >=65 | I/II | Unknown | Unknown | SD | ||
| SIRPA | insertion | Frame_Shift_Ins | novel | c.1073_1074insCATAACGT | p.Asn359IlefsTer3 | p.N359Ifs*3 | P78324 | protein_coding | TCGA-AO-A03P-01 | Breast | breast invasive carcinoma | Female | <65 | I/II | Hormone Therapy | letrozole | PD | ||
| SIRPA | insertion | In_Frame_Ins | novel | c.1073_1074insCAT | p.Ser358_Asn359insIle | p.S358_N359insI | P78324 | protein_coding | TCGA-BH-A0BA-01 | Breast | breast invasive carcinoma | Female | <65 | III/IV | Chemotherapy | cytoxan | SD | ||
| SIRPA | SNV | Missense_Mutation | novel | c.533N>C | p.Arg178Thr | p.R178T | P78324 | protein_coding | deleterious(0) | benign(0.049) | TCGA-JW-A5VL-01 | Cervix | cervical & endocervical cancer | Female | <65 | I/II | Unknown | Unknown | SD |
| SIRPA | SNV | Missense_Mutation | c.478N>A | p.Ala160Thr | p.A160T | P78324 | protein_coding | tolerated(0.17) | benign(0.012) | TCGA-AA-3815-01 | Colorectum | colon adenocarcinoma | Female | >=65 | I/II | Unknown | Unknown | SD |
| Page: 1 2 3 4 5 6 7 |
Top |
Related drugs of malignant transformation related genes |
| Identification of chemicals and drugs interact with genes involved in malignant transfromation |
| (DGIdb 4.0) |
| Entrez ID | Symbol | Category | Interaction Types | Drug Claim Name | Drug Name | PMIDs |
| Page: 1 |

Copyright 2023-Present -The University of Texas Health Science Center at Houston |