
|
|||||
|
 | |
| |
| |
| |
| |
| |
|
Gene: SIPA1L3 |
Gene summary for SIPA1L3 |
| Gene information | Species | Human | Gene symbol | SIPA1L3 | Gene ID | 23094 |
| Gene name | signal induced proliferation associated 1 like 3 | |
| Gene Alias | CTRCT45 | |
| Cytomap | 19q13.13-q13.2 | |
| Gene Type | protein-coding | GO ID | GO:0000902 | UniProtAcc | B2RWP0 |
Top |
Malignant transformation analysis |
| Identification of the aberrant gene expression in precancerous and cancerous lesions by comparing the gene expression of stem-like cells in diseased tissues with normal stem cells |
| Entrez ID | Symbol | Replicates | Species | Organ | Tissue | Adj P-value | Log2FC | Malignancy |
| 23094 | SIPA1L3 | CCI_1 | Human | Cervix | CC | 6.72e-09 | 7.89e-01 | 0.528 |
| 23094 | SIPA1L3 | CCI_2 | Human | Cervix | CC | 1.24e-16 | 1.36e+00 | 0.5249 |
| 23094 | SIPA1L3 | CCI_3 | Human | Cervix | CC | 3.28e-26 | 1.40e+00 | 0.516 |
| 23094 | SIPA1L3 | CCII_1 | Human | Cervix | CC | 2.80e-06 | 3.68e-01 | 0.3249 |
| 23094 | SIPA1L3 | HTA11_2487_2000001011 | Human | Colorectum | SER | 3.01e-17 | 1.01e+00 | -0.1808 |
| 23094 | SIPA1L3 | HTA11_1938_2000001011 | Human | Colorectum | AD | 2.83e-03 | 5.06e-01 | -0.0811 |
| 23094 | SIPA1L3 | HTA11_347_2000001011 | Human | Colorectum | AD | 4.38e-35 | 1.21e+00 | -0.1954 |
| 23094 | SIPA1L3 | HTA11_411_2000001011 | Human | Colorectum | SER | 1.26e-17 | 1.51e+00 | -0.2602 |
| 23094 | SIPA1L3 | HTA11_2112_2000001011 | Human | Colorectum | SER | 1.34e-16 | 1.42e+00 | -0.2196 |
| 23094 | SIPA1L3 | HTA11_3361_2000001011 | Human | Colorectum | AD | 2.25e-10 | 8.41e-01 | -0.1207 |
| 23094 | SIPA1L3 | HTA11_83_2000001011 | Human | Colorectum | SER | 3.76e-17 | 1.01e+00 | -0.1526 |
| 23094 | SIPA1L3 | HTA11_696_2000001011 | Human | Colorectum | AD | 3.77e-31 | 1.40e+00 | -0.1464 |
| 23094 | SIPA1L3 | HTA11_866_2000001011 | Human | Colorectum | AD | 8.42e-26 | 9.64e-01 | -0.1001 |
| 23094 | SIPA1L3 | HTA11_1391_2000001011 | Human | Colorectum | AD | 5.68e-10 | 7.79e-01 | -0.059 |
| 23094 | SIPA1L3 | HTA11_2992_2000001011 | Human | Colorectum | SER | 8.07e-08 | 1.00e+00 | -0.1706 |
| 23094 | SIPA1L3 | HTA11_5212_2000001011 | Human | Colorectum | AD | 3.17e-04 | 6.73e-01 | -0.2061 |
| 23094 | SIPA1L3 | HTA11_5216_2000001011 | Human | Colorectum | SER | 2.14e-02 | 5.15e-01 | -0.1462 |
| 23094 | SIPA1L3 | HTA11_546_2000001011 | Human | Colorectum | AD | 2.37e-11 | 9.22e-01 | -0.0842 |
| 23094 | SIPA1L3 | HTA11_7663_2000001011 | Human | Colorectum | SER | 6.40e-03 | 6.26e-01 | 0.0131 |
| 23094 | SIPA1L3 | HTA11_7696_3000711011 | Human | Colorectum | AD | 1.37e-08 | 6.23e-01 | 0.0674 |
| Page: 1 2 3 4 5 6 7 |
| Tissue | Expression Dynamics | Abbreviation |
| Cervix |  | CC: Cervix cancer |
| HSIL_HPV: HPV-infected high-grade squamous intraepithelial lesions | ||
| N_HPV: HPV-infected normal cervix | ||
| Colorectum (GSE201348) |  | FAP: Familial adenomatous polyposis |
| CRC: Colorectal cancer | ||
| Colorectum (HTA11) |  | AD: Adenomas |
| SER: Sessile serrated lesions | ||
| MSI-H: Microsatellite-high colorectal cancer | ||
| MSS: Microsatellite stable colorectal cancer | ||
| Endometrium | 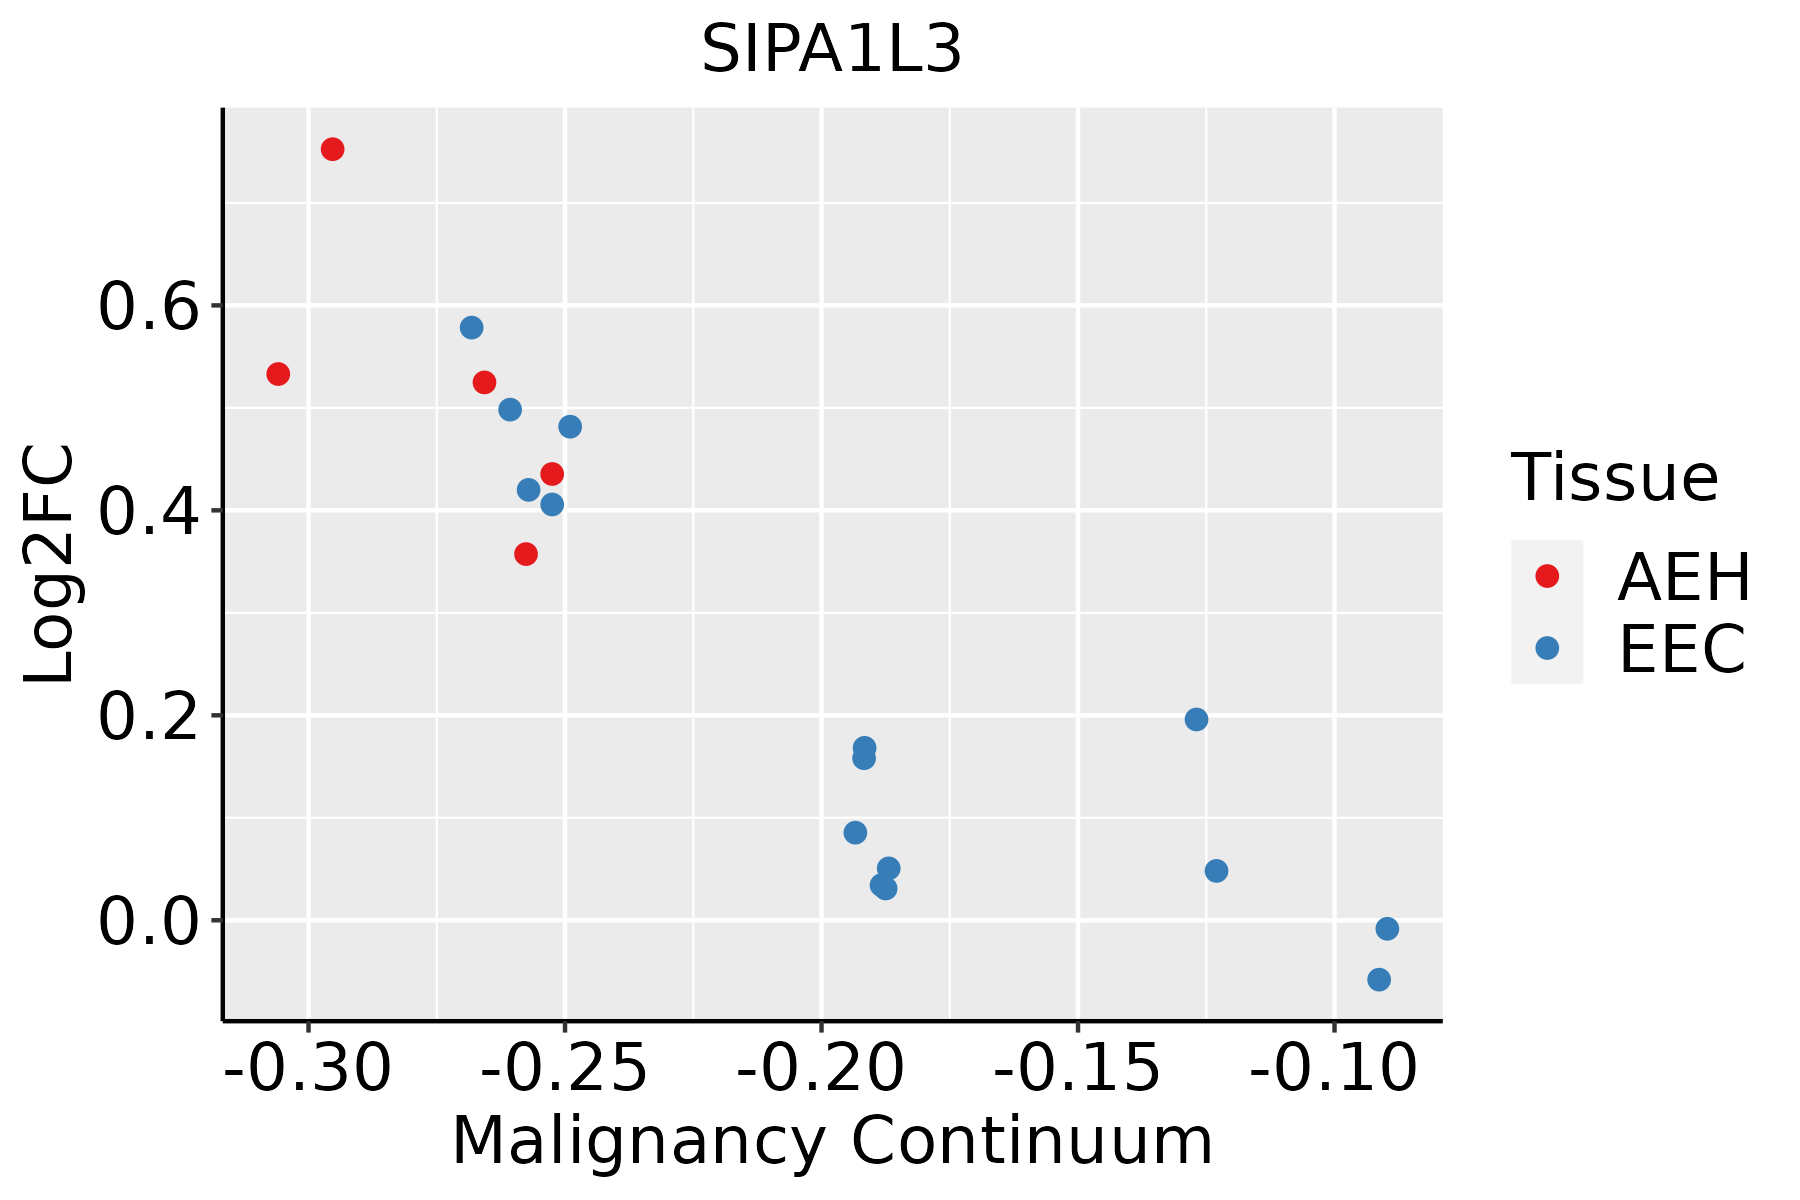 | AEH: Atypical endometrial hyperplasia |
| EEC: Endometrioid Cancer | ||
| GC | 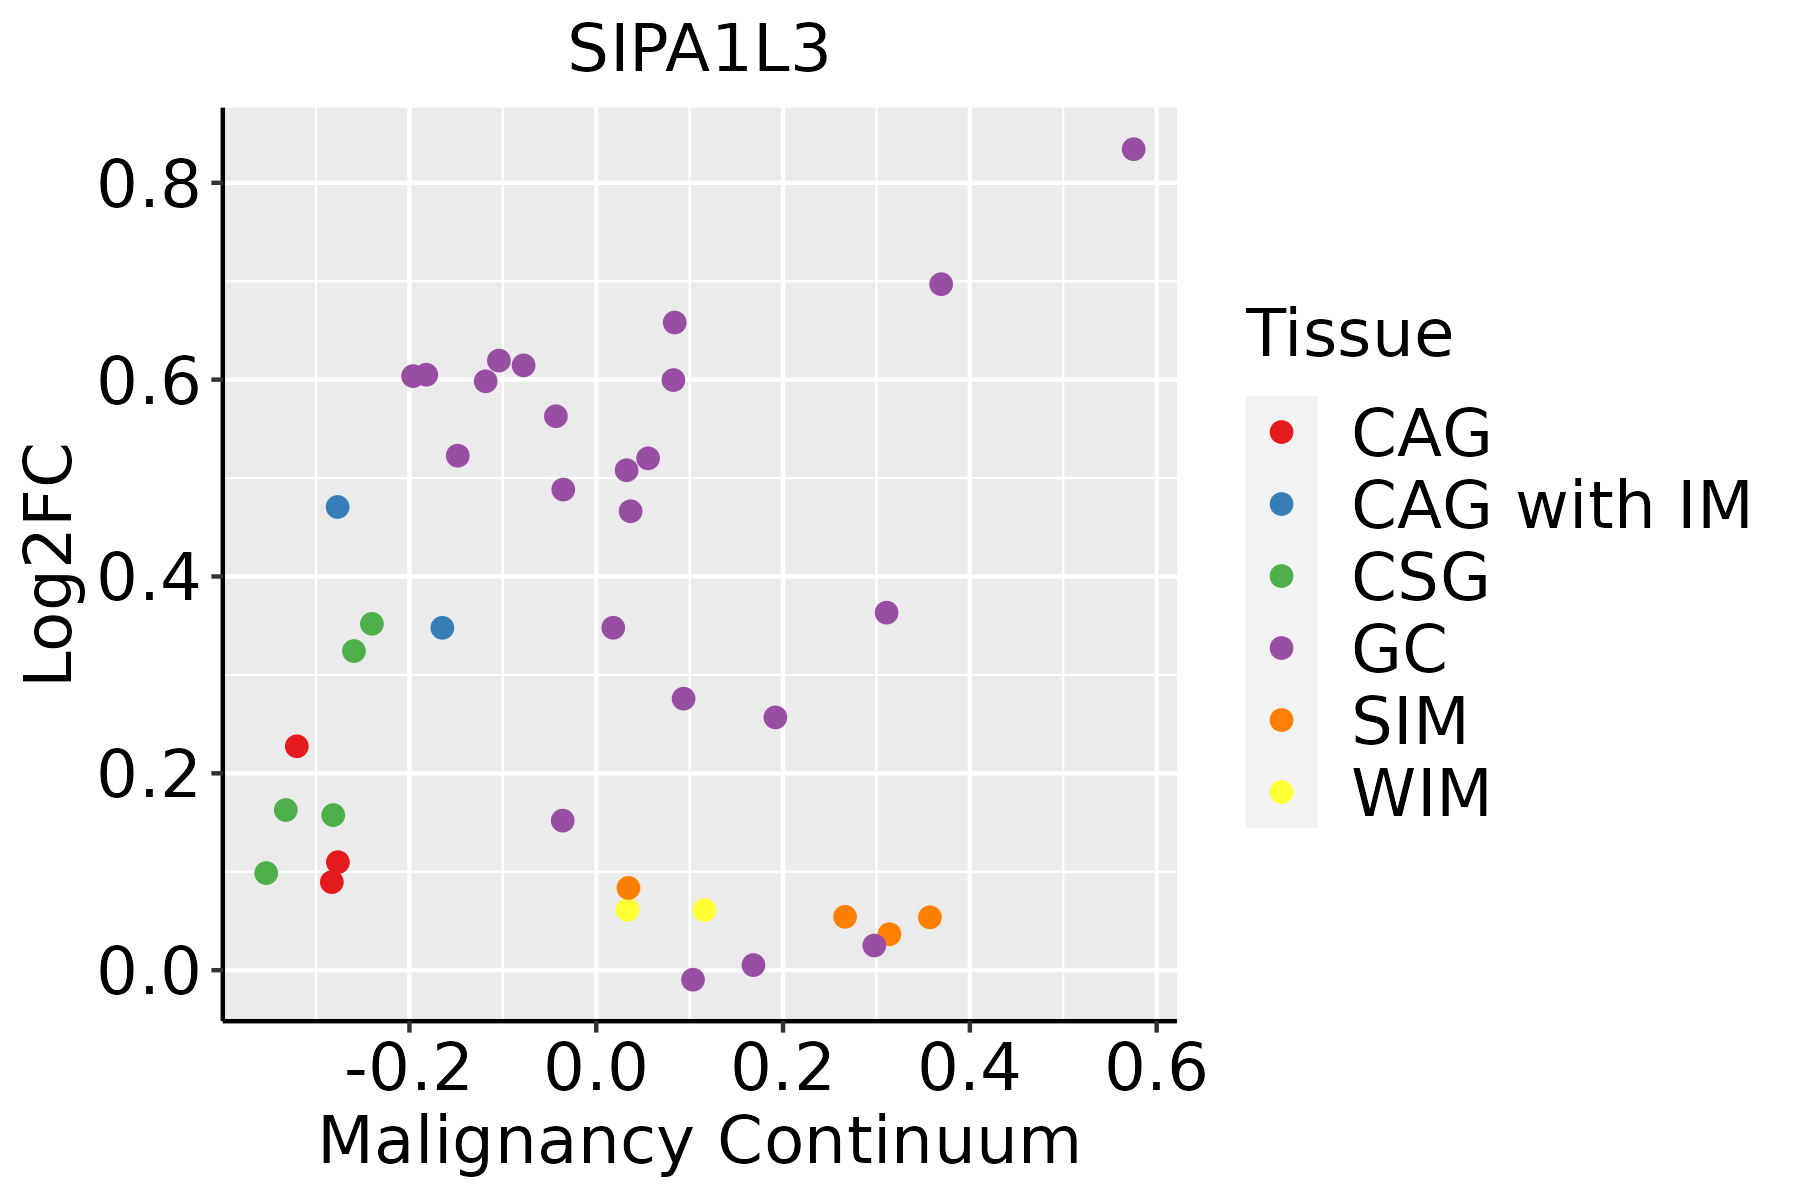 | CAG: Chronic atrophic gastritis |
| CAG with IM: Chronic atrophic gastritis with intestinal metaplasia | ||
| CSG: Chronic superficial gastritis | ||
| GC: Gastric cancer | ||
| SIM: Severe intestinal metaplasia | ||
| WIM: Wild intestinal metaplasia | ||
| Lung | 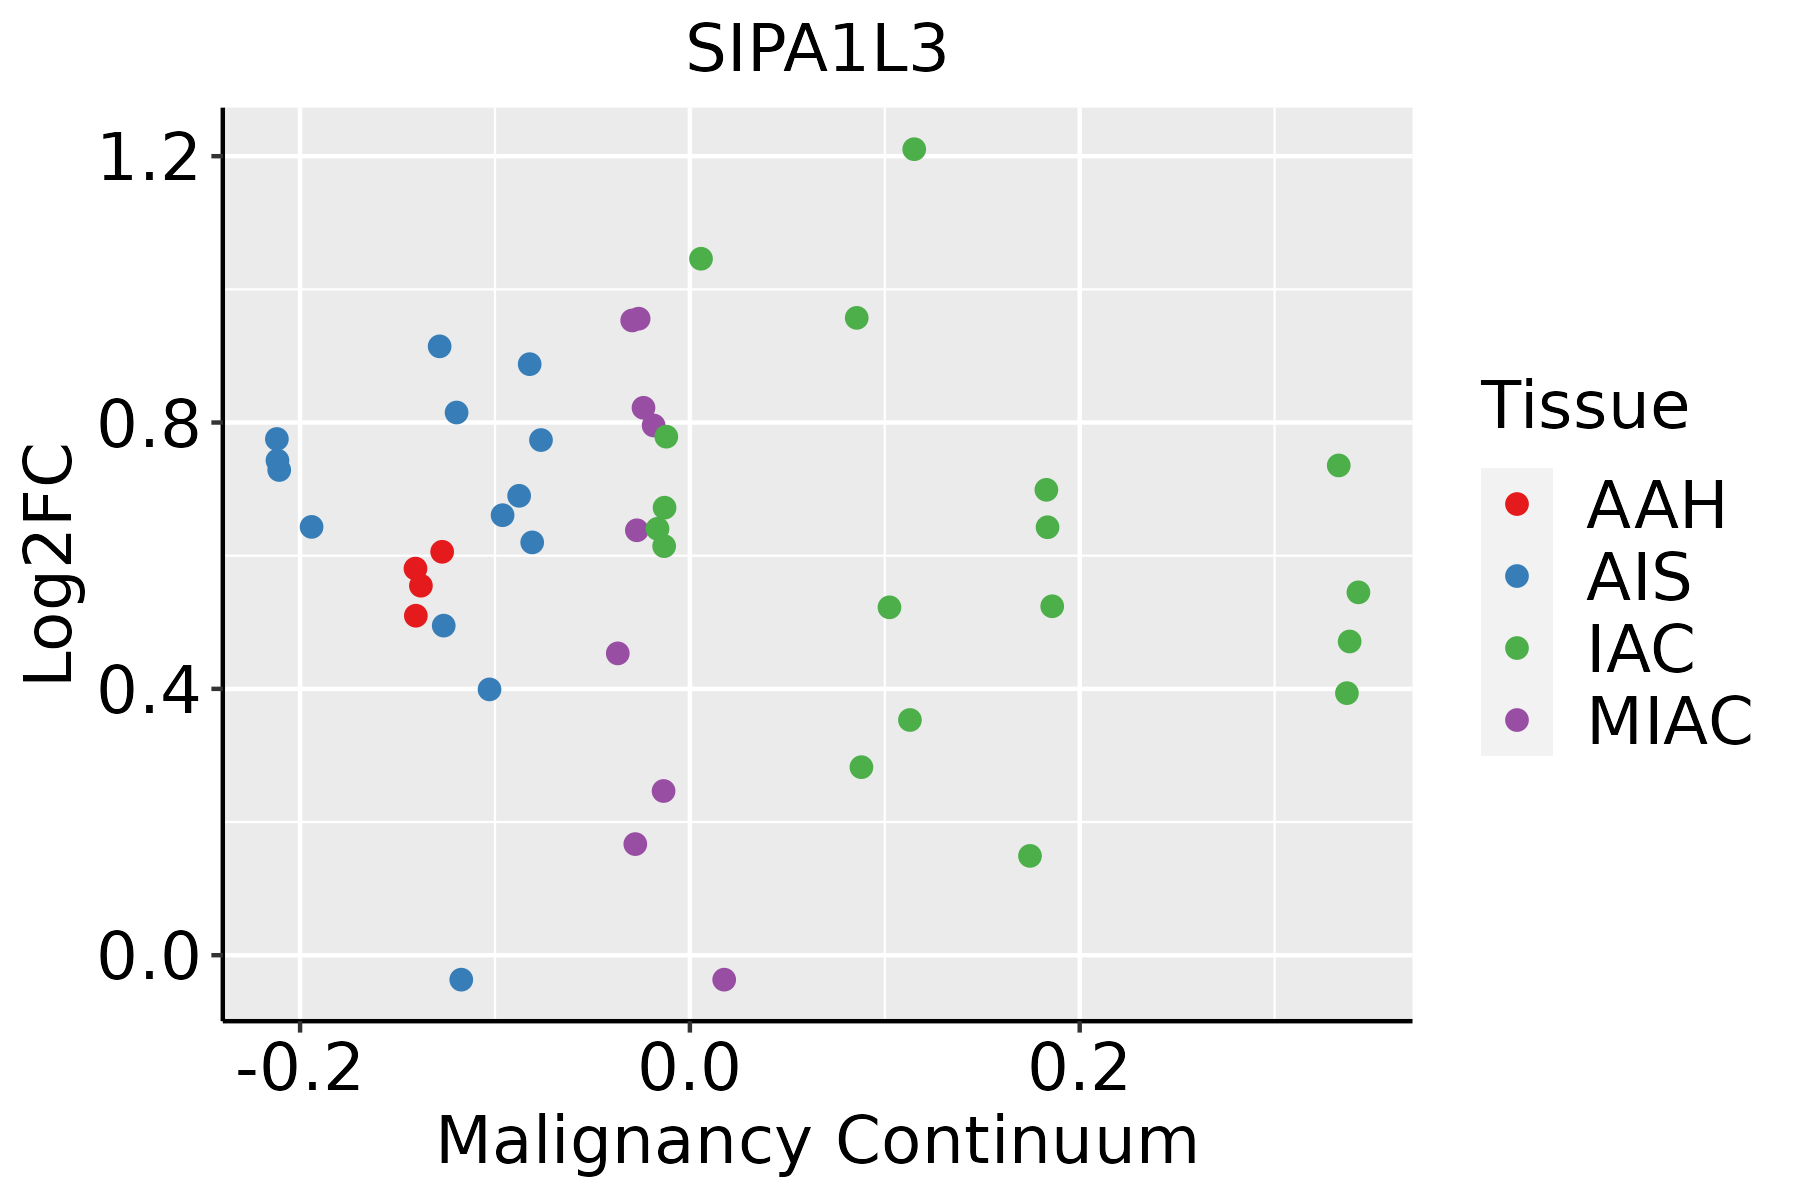 | AAH: Atypical adenomatous hyperplasia |
| AIS: Adenocarcinoma in situ | ||
| IAC: Invasive lung adenocarcinoma | ||
| MIA: Minimally invasive adenocarcinoma | ||
| Oral Cavity | 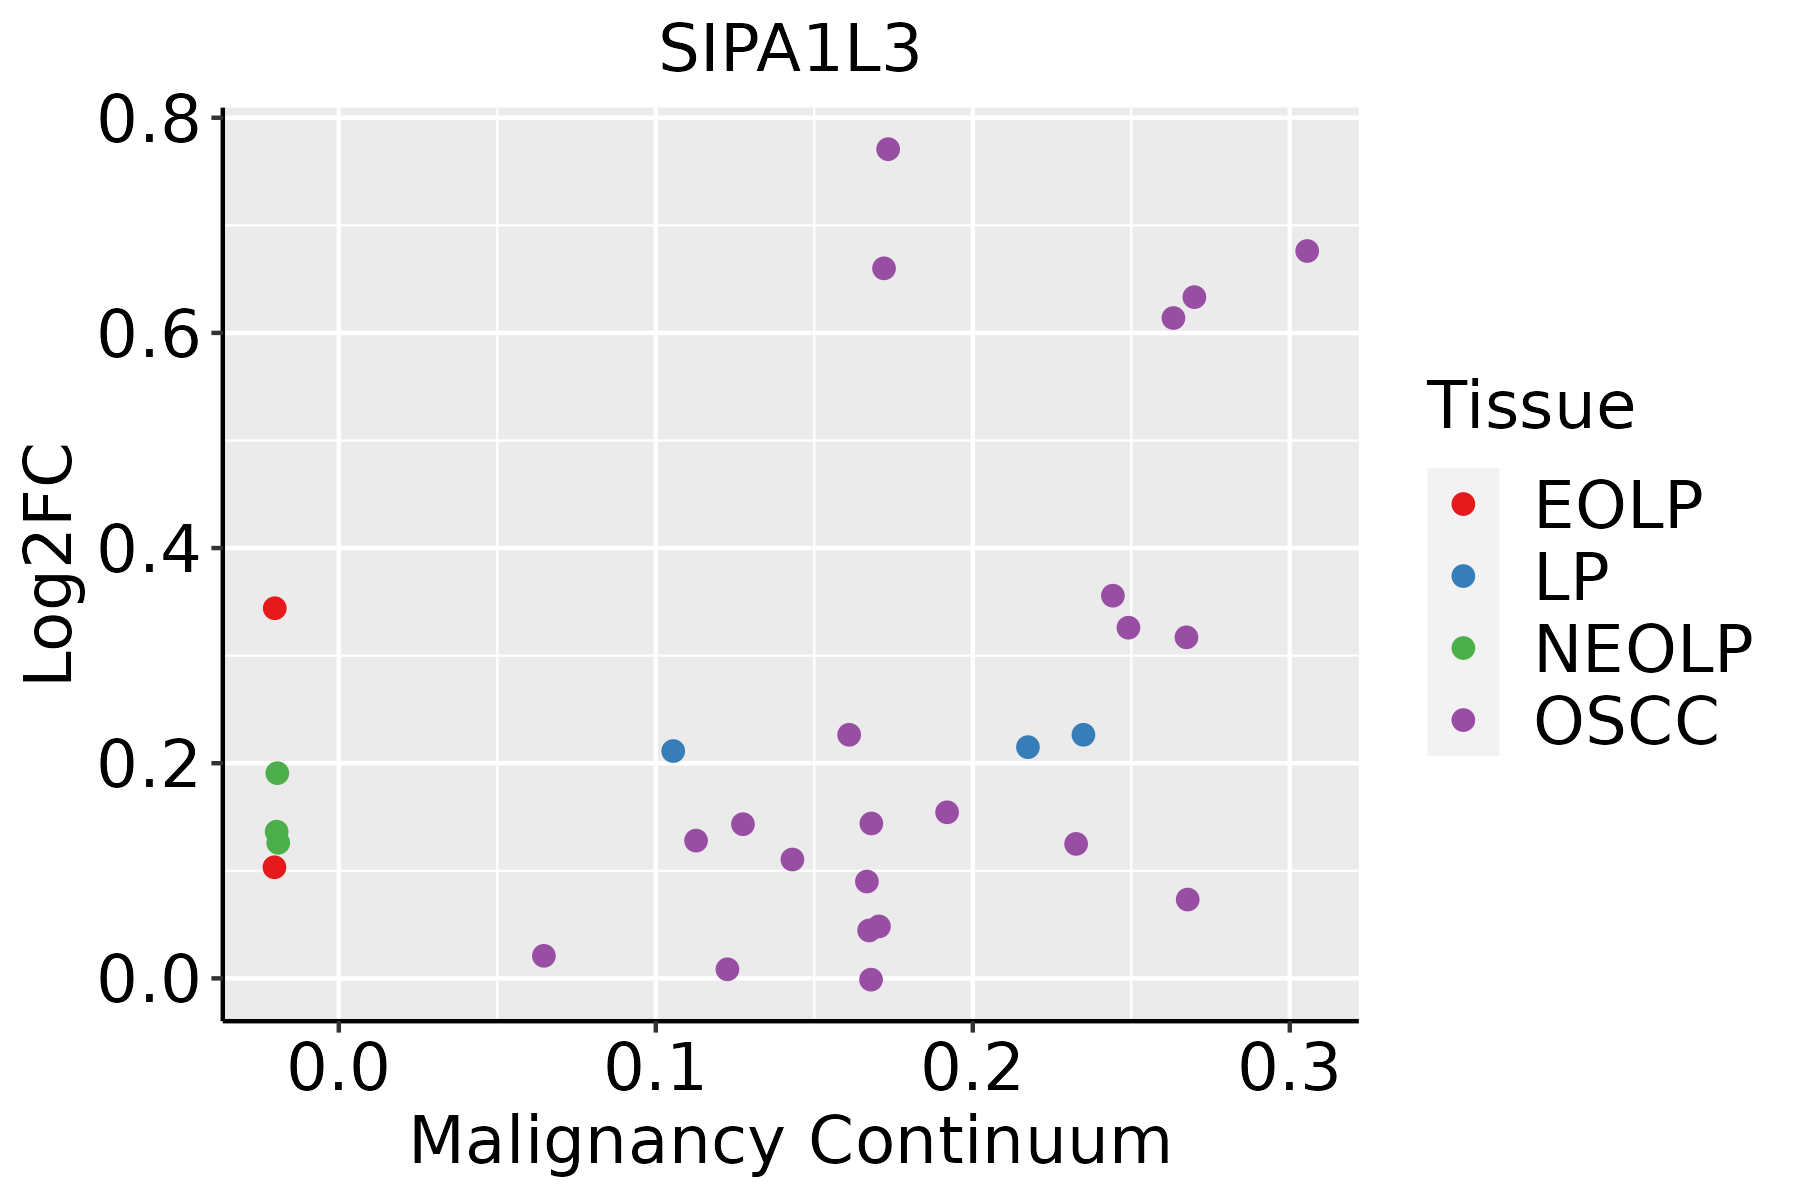 | EOLP: Erosive Oral lichen planus |
| LP: leukoplakia | ||
| NEOLP: Non-erosive oral lichen planus | ||
| OSCC: Oral squamous cell carcinoma | ||
| Prostate |  | BPH: Benign Prostatic Hyperplasia |
| ∗log2FC in expression of this searched gene in stem-like cells from each diseased tissue sample relative to stem-like cells in normal samples in each tissue plotted against the malignancy continuum. Samples are colored based on if they are from different disease stage. |
Top |
Malignant transformation related pathway analysis |
| Find out the enriched GO biological processes and KEGG pathways involved in transition from healthy to precancer to cancer |
| Tissue | Disease Stage | Enriched GO biological Processes |
| Colorectum | AD |  |
| Colorectum | SER |  |
| Colorectum | MSS |  |
| Colorectum | MSI-H |  |
| Colorectum | FAP |  |
| ∗Top 15 enriched GO BP terms are showed in the bar plot of each disease state in each tissue. Each row represents a significant GO biological process which is colored according to the -log10(p.adjust). |
| Page: 1 2 3 4 5 6 7 8 9 |
| GO ID | Tissue | Disease Stage | Description | Gene Ratio | Bg Ratio | pvalue | p.adjust | Count |
| GO:00071639 | Cervix | CC | establishment or maintenance of cell polarity | 63/2311 | 218/18723 | 4.25e-11 | 8.76e-09 | 63 |
| GO:00510566 | Cervix | CC | regulation of small GTPase mediated signal transduction | 75/2311 | 302/18723 | 1.54e-09 | 1.74e-07 | 75 |
| GO:00430877 | Cervix | CC | regulation of GTPase activity | 79/2311 | 348/18723 | 4.21e-08 | 2.60e-06 | 79 |
| GO:00300108 | Cervix | CC | establishment of cell polarity | 42/2311 | 143/18723 | 4.30e-08 | 2.62e-06 | 42 |
| GO:00435476 | Cervix | CC | positive regulation of GTPase activity | 53/2311 | 255/18723 | 8.72e-05 | 1.16e-03 | 53 |
| GO:000206410 | Cervix | CC | epithelial cell development | 45/2311 | 220/18723 | 4.14e-04 | 4.21e-03 | 45 |
| GO:00901627 | Cervix | CC | establishment of epithelial cell polarity | 11/2311 | 31/18723 | 7.87e-04 | 6.96e-03 | 11 |
| GO:00022443 | Cervix | CC | hematopoietic progenitor cell differentiation | 26/2311 | 114/18723 | 1.30e-03 | 1.03e-02 | 26 |
| GO:0150063 | Cervix | CC | visual system development | 63/2311 | 375/18723 | 6.58e-03 | 3.65e-02 | 63 |
| GO:0001654 | Cervix | CC | eye development | 62/2311 | 371/18723 | 7.83e-03 | 4.13e-02 | 62 |
| GO:0048880 | Cervix | CC | sensory system development | 63/2311 | 381/18723 | 9.29e-03 | 4.66e-02 | 63 |
| GO:0002064 | Colorectum | AD | epithelial cell development | 89/3918 | 220/18723 | 2.98e-11 | 3.52e-09 | 89 |
| GO:0007163 | Colorectum | AD | establishment or maintenance of cell polarity | 77/3918 | 218/18723 | 5.72e-07 | 2.08e-05 | 77 |
| GO:0043087 | Colorectum | AD | regulation of GTPase activity | 110/3918 | 348/18723 | 1.64e-06 | 5.03e-05 | 110 |
| GO:0051056 | Colorectum | AD | regulation of small GTPase mediated signal transduction | 94/3918 | 302/18723 | 1.81e-05 | 3.76e-04 | 94 |
| GO:0030010 | Colorectum | AD | establishment of cell polarity | 50/3918 | 143/18723 | 6.90e-05 | 1.11e-03 | 50 |
| GO:0043547 | Colorectum | AD | positive regulation of GTPase activity | 75/3918 | 255/18723 | 7.95e-04 | 7.91e-03 | 75 |
| GO:0090162 | Colorectum | AD | establishment of epithelial cell polarity | 13/3918 | 31/18723 | 6.53e-03 | 4.06e-02 | 13 |
| GO:00020641 | Colorectum | SER | epithelial cell development | 64/2897 | 220/18723 | 1.96e-07 | 1.10e-05 | 64 |
| GO:00071631 | Colorectum | SER | establishment or maintenance of cell polarity | 60/2897 | 218/18723 | 3.45e-06 | 1.33e-04 | 60 |
| Page: 1 2 3 4 5 6 7 8 |
| Pathway ID | Tissue | Disease Stage | Description | Gene Ratio | Bg Ratio | pvalue | p.adjust | qvalue | Count |
| hsa0401512 | Cervix | CC | Rap1 signaling pathway | 56/1267 | 210/8465 | 6.23e-06 | 5.61e-05 | 3.32e-05 | 56 |
| hsa0401513 | Cervix | CC | Rap1 signaling pathway | 56/1267 | 210/8465 | 6.23e-06 | 5.61e-05 | 3.32e-05 | 56 |
| hsa04015 | Colorectum | AD | Rap1 signaling pathway | 71/2092 | 210/8465 | 1.72e-03 | 9.68e-03 | 6.18e-03 | 71 |
| hsa040151 | Colorectum | AD | Rap1 signaling pathway | 71/2092 | 210/8465 | 1.72e-03 | 9.68e-03 | 6.18e-03 | 71 |
| hsa040152 | Colorectum | SER | Rap1 signaling pathway | 54/1580 | 210/8465 | 6.55e-03 | 3.68e-02 | 2.67e-02 | 54 |
| hsa040153 | Colorectum | SER | Rap1 signaling pathway | 54/1580 | 210/8465 | 6.55e-03 | 3.68e-02 | 2.67e-02 | 54 |
| hsa040154 | Colorectum | MSS | Rap1 signaling pathway | 66/1875 | 210/8465 | 1.03e-03 | 5.94e-03 | 3.64e-03 | 66 |
| hsa040155 | Colorectum | MSS | Rap1 signaling pathway | 66/1875 | 210/8465 | 1.03e-03 | 5.94e-03 | 3.64e-03 | 66 |
| hsa040156 | Colorectum | FAP | Rap1 signaling pathway | 53/1404 | 210/8465 | 7.93e-04 | 5.14e-03 | 3.13e-03 | 53 |
| hsa040157 | Colorectum | FAP | Rap1 signaling pathway | 53/1404 | 210/8465 | 7.93e-04 | 5.14e-03 | 3.13e-03 | 53 |
| hsa040158 | Colorectum | CRC | Rap1 signaling pathway | 48/1091 | 210/8465 | 4.00e-05 | 8.70e-04 | 5.90e-04 | 48 |
| hsa040159 | Colorectum | CRC | Rap1 signaling pathway | 48/1091 | 210/8465 | 4.00e-05 | 8.70e-04 | 5.90e-04 | 48 |
| hsa0401514 | Endometrium | AEH | Rap1 signaling pathway | 49/1197 | 210/8465 | 2.03e-04 | 1.78e-03 | 1.30e-03 | 49 |
| hsa0401515 | Endometrium | AEH | Rap1 signaling pathway | 49/1197 | 210/8465 | 2.03e-04 | 1.78e-03 | 1.30e-03 | 49 |
| hsa0401522 | Endometrium | EEC | Rap1 signaling pathway | 49/1237 | 210/8465 | 4.45e-04 | 3.47e-03 | 2.59e-03 | 49 |
| hsa0401532 | Endometrium | EEC | Rap1 signaling pathway | 49/1237 | 210/8465 | 4.45e-04 | 3.47e-03 | 2.59e-03 | 49 |
| hsa0401510 | Lung | IAC | Rap1 signaling pathway | 41/1053 | 210/8465 | 2.01e-03 | 1.07e-02 | 7.10e-03 | 41 |
| hsa0401511 | Lung | IAC | Rap1 signaling pathway | 41/1053 | 210/8465 | 2.01e-03 | 1.07e-02 | 7.10e-03 | 41 |
| hsa0401521 | Lung | AIS | Rap1 signaling pathway | 41/961 | 210/8465 | 3.23e-04 | 3.38e-03 | 2.16e-03 | 41 |
| hsa0401531 | Lung | AIS | Rap1 signaling pathway | 41/961 | 210/8465 | 3.23e-04 | 3.38e-03 | 2.16e-03 | 41 |
| Page: 1 2 |
Top |
Cell-cell communication analysis |
| Identification of potential cell-cell interactions between two cell types and their ligand-receptor pairs for different disease states |
| Ligand | Receptor | LRpair | Pathway | Tissue | Disease Stage |
| Page: 1 |
Top |
Single-cell gene regulatory network inference analysis |
| Find out the significant the regulons (TFs) and the target genes of each regulon across cell types for different disease states |
| TF | Cell Type | Tissue | Disease Stage | Target Gene | RSS | Regulon Activity |
| ∗The dot plots of a searched regulon are shown for all cell subpopulations in each disease state of each tissue based on the regulon specific score inferred using pySCENIC and by calculating the average expression. |
| Page: 1 |
Top |
Somatic mutation of malignant transformation related genes |
| Annotation of somatic variants for genes involved in malignant transformation |
| Hugo Symbol | Variant Class | Variant Classification | dbSNP RS | HGVSc | HGVSp | HGVSp Short | SWISSPROT | BIOTYPE | SIFT | PolyPhen | Tumor Sample Barcode | Tissue | Histology | Sex | Age | Stage | Therapy Types | Drugs | Outcome |
| SIPA1L3 | SNV | Missense_Mutation | c.3043G>A | p.Val1015Met | p.V1015M | O60292 | protein_coding | deleterious(0) | probably_damaging(0.991) | TCGA-A1-A0SO-01 | Breast | breast invasive carcinoma | Female | >=65 | I/II | Chemotherapy | SD | ||
| SIPA1L3 | SNV | Missense_Mutation | c.3985N>T | p.Pro1329Ser | p.P1329S | O60292 | protein_coding | tolerated(0.12) | benign(0.007) | TCGA-A2-A0YI-01 | Breast | breast invasive carcinoma | Female | <65 | I/II | Unspecific | Femara | SD | |
| SIPA1L3 | SNV | Missense_Mutation | c.3824C>G | p.Ser1275Cys | p.S1275C | O60292 | protein_coding | tolerated(0.05) | probably_damaging(0.992) | TCGA-A8-A06Q-01 | Breast | breast invasive carcinoma | Female | <65 | III/IV | Unknown | Unknown | SD | |
| SIPA1L3 | SNV | Missense_Mutation | novel | c.1038G>T | p.Gln346His | p.Q346H | O60292 | protein_coding | deleterious(0) | probably_damaging(0.991) | TCGA-A8-A08S-01 | Breast | breast invasive carcinoma | Female | >=65 | I/II | Hormone Therapy | anastrozole | SD |
| SIPA1L3 | SNV | Missense_Mutation | c.2468N>C | p.Glu823Ala | p.E823A | O60292 | protein_coding | deleterious(0) | benign(0.18) | TCGA-A8-A09Z-01 | Breast | breast invasive carcinoma | Female | >=65 | I/II | Unknown | Unknown | SD | |
| SIPA1L3 | SNV | Missense_Mutation | rs773374316 | c.1774N>A | p.Glu592Lys | p.E592K | O60292 | protein_coding | deleterious(0) | benign(0.124) | TCGA-AN-A046-01 | Breast | breast invasive carcinoma | Female | >=65 | I/II | Unknown | Unknown | SD |
| SIPA1L3 | SNV | Missense_Mutation | c.3357N>G | p.Ile1119Met | p.I1119M | O60292 | protein_coding | tolerated(0.16) | benign(0) | TCGA-AN-A0AK-01 | Breast | breast invasive carcinoma | Female | >=65 | I/II | Unknown | Unknown | SD | |
| SIPA1L3 | SNV | Missense_Mutation | novel | c.3040N>T | p.Ala1014Ser | p.A1014S | O60292 | protein_coding | tolerated(0.09) | possibly_damaging(0.573) | TCGA-AR-A1AX-01 | Breast | breast invasive carcinoma | Female | <65 | I/II | Chemotherapy | cytoxan | SD |
| SIPA1L3 | SNV | Missense_Mutation | c.2510N>G | p.Pro837Arg | p.P837R | O60292 | protein_coding | deleterious(0) | benign(0.179) | TCGA-D8-A1JP-01 | Breast | breast invasive carcinoma | Female | >=65 | I/II | Hormone Therapy | tamoxiphen | SD | |
| SIPA1L3 | SNV | Missense_Mutation | novel | c.2473C>T | p.Leu825Phe | p.L825F | O60292 | protein_coding | deleterious(0) | probably_damaging(0.936) | TCGA-E9-A22E-01 | Breast | breast invasive carcinoma | Female | <65 | III/IV | Chemotherapy | cyclophosphane | SD |
| Page: 1 2 3 4 5 6 7 8 9 10 11 12 13 14 15 16 17 |
Top |
Related drugs of malignant transformation related genes |
| Identification of chemicals and drugs interact with genes involved in malignant transfromation |
| (DGIdb 4.0) |
| Entrez ID | Symbol | Category | Interaction Types | Drug Claim Name | Drug Name | PMIDs |
| Page: 1 |

Copyright 2023-Present -The University of Texas Health Science Center at Houston |