
|
|||||
|
 | |
| |
| |
| |
| |
| |
|
Gene: SIPA1L2 |
Gene summary for SIPA1L2 |
| Gene information | Species | Human | Gene symbol | SIPA1L2 | Gene ID | 57568 |
| Gene name | signal induced proliferation associated 1 like 2 | |
| Gene Alias | SPAL2 | |
| Cytomap | 1q42.2 | |
| Gene Type | protein-coding | GO ID | GO:0007154 | UniProtAcc | Q9P2F8 |
Top |
Malignant transformation analysis |
| Identification of the aberrant gene expression in precancerous and cancerous lesions by comparing the gene expression of stem-like cells in diseased tissues with normal stem cells |
| Entrez ID | Symbol | Replicates | Species | Organ | Tissue | Adj P-value | Log2FC | Malignancy |
| 57568 | SIPA1L2 | CCI_1 | Human | Cervix | CC | 4.03e-07 | 1.55e+00 | 0.528 |
| 57568 | SIPA1L2 | CCI_3 | Human | Cervix | CC | 7.80e-04 | 3.33e-01 | 0.516 |
| 57568 | SIPA1L2 | HTA11_3410_2000001011 | Human | Colorectum | AD | 1.46e-41 | -1.03e+00 | 0.0155 |
| 57568 | SIPA1L2 | HTA11_2487_2000001011 | Human | Colorectum | SER | 1.47e-03 | -5.01e-01 | -0.1808 |
| 57568 | SIPA1L2 | HTA11_2951_2000001011 | Human | Colorectum | AD | 9.93e-05 | -9.15e-01 | 0.0216 |
| 57568 | SIPA1L2 | HTA11_1938_2000001011 | Human | Colorectum | AD | 8.05e-04 | -5.82e-01 | -0.0811 |
| 57568 | SIPA1L2 | HTA11_2112_2000001011 | Human | Colorectum | SER | 4.42e-05 | -8.57e-01 | -0.2196 |
| 57568 | SIPA1L2 | HTA11_3361_2000001011 | Human | Colorectum | AD | 6.06e-15 | -8.34e-01 | -0.1207 |
| 57568 | SIPA1L2 | HTA11_696_2000001011 | Human | Colorectum | AD | 1.88e-07 | -4.87e-01 | -0.1464 |
| 57568 | SIPA1L2 | HTA11_866_2000001011 | Human | Colorectum | AD | 2.22e-08 | -5.03e-01 | -0.1001 |
| 57568 | SIPA1L2 | HTA11_1391_2000001011 | Human | Colorectum | AD | 8.67e-03 | -4.95e-01 | -0.059 |
| 57568 | SIPA1L2 | HTA11_5212_2000001011 | Human | Colorectum | AD | 2.36e-06 | -6.05e-01 | -0.2061 |
| 57568 | SIPA1L2 | HTA11_5216_2000001011 | Human | Colorectum | SER | 3.15e-02 | -7.58e-01 | -0.1462 |
| 57568 | SIPA1L2 | HTA11_7862_2000001011 | Human | Colorectum | AD | 3.15e-04 | -4.16e-01 | -0.0179 |
| 57568 | SIPA1L2 | HTA11_866_3004761011 | Human | Colorectum | AD | 3.21e-31 | -9.68e-01 | 0.096 |
| 57568 | SIPA1L2 | HTA11_9408_2000001011 | Human | Colorectum | AD | 6.42e-04 | -9.89e-01 | 0.0451 |
| 57568 | SIPA1L2 | HTA11_8622_2000001021 | Human | Colorectum | SER | 1.26e-06 | -8.77e-01 | 0.0528 |
| 57568 | SIPA1L2 | HTA11_10711_2000001011 | Human | Colorectum | AD | 2.06e-17 | -9.21e-01 | 0.0338 |
| 57568 | SIPA1L2 | HTA11_7696_3000711011 | Human | Colorectum | AD | 4.30e-15 | -6.22e-01 | 0.0674 |
| 57568 | SIPA1L2 | HTA11_6818_2000001011 | Human | Colorectum | AD | 7.26e-07 | -7.51e-01 | 0.0112 |
| Page: 1 2 3 4 5 6 7 8 |
| Tissue | Expression Dynamics | Abbreviation |
| Cervix |  | CC: Cervix cancer |
| HSIL_HPV: HPV-infected high-grade squamous intraepithelial lesions | ||
| N_HPV: HPV-infected normal cervix | ||
| Colorectum (GSE201348) |  | FAP: Familial adenomatous polyposis |
| CRC: Colorectal cancer | ||
| Colorectum (HTA11) |  | AD: Adenomas |
| SER: Sessile serrated lesions | ||
| MSI-H: Microsatellite-high colorectal cancer | ||
| MSS: Microsatellite stable colorectal cancer | ||
| Endometrium | 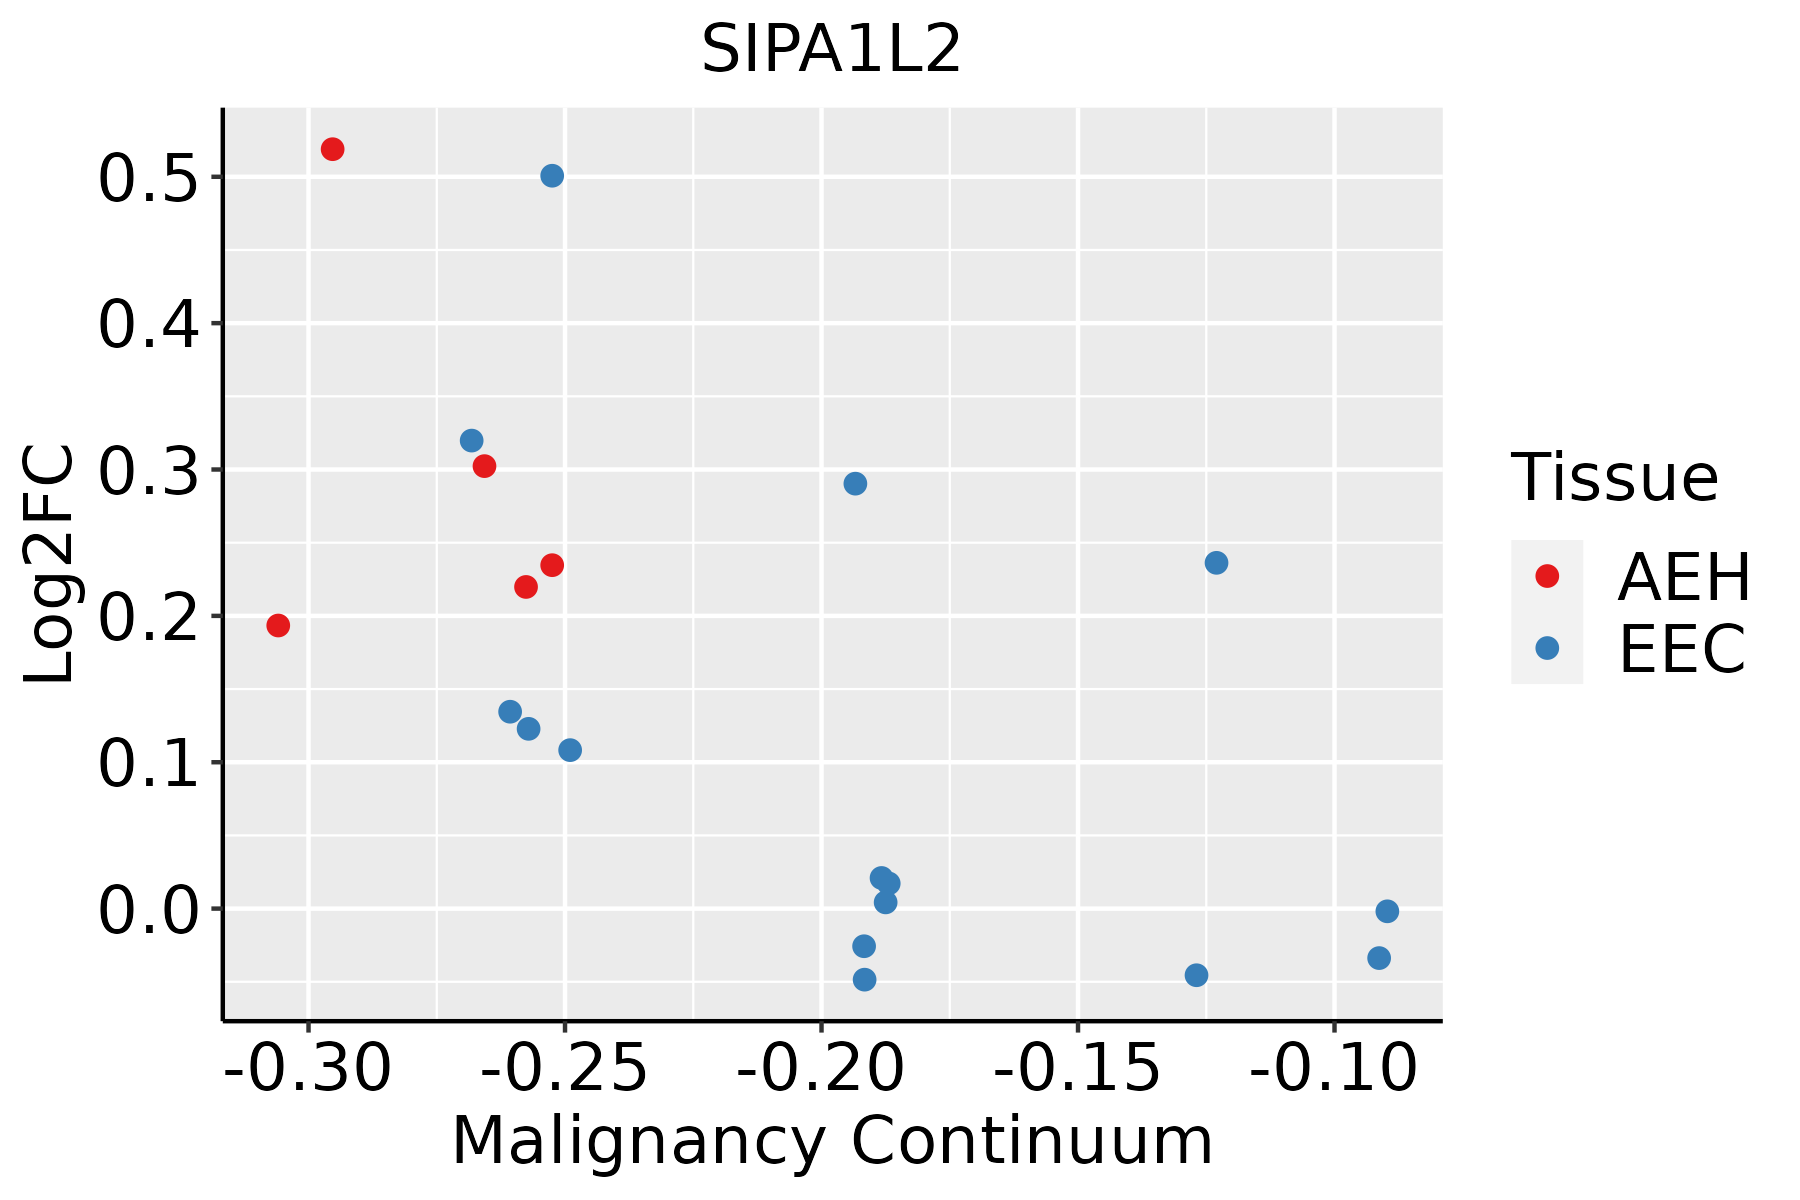 | AEH: Atypical endometrial hyperplasia |
| EEC: Endometrioid Cancer | ||
| Esophagus |  | ESCC: Esophageal squamous cell carcinoma |
| HGIN: High-grade intraepithelial neoplasias | ||
| LGIN: Low-grade intraepithelial neoplasias | ||
| Liver | 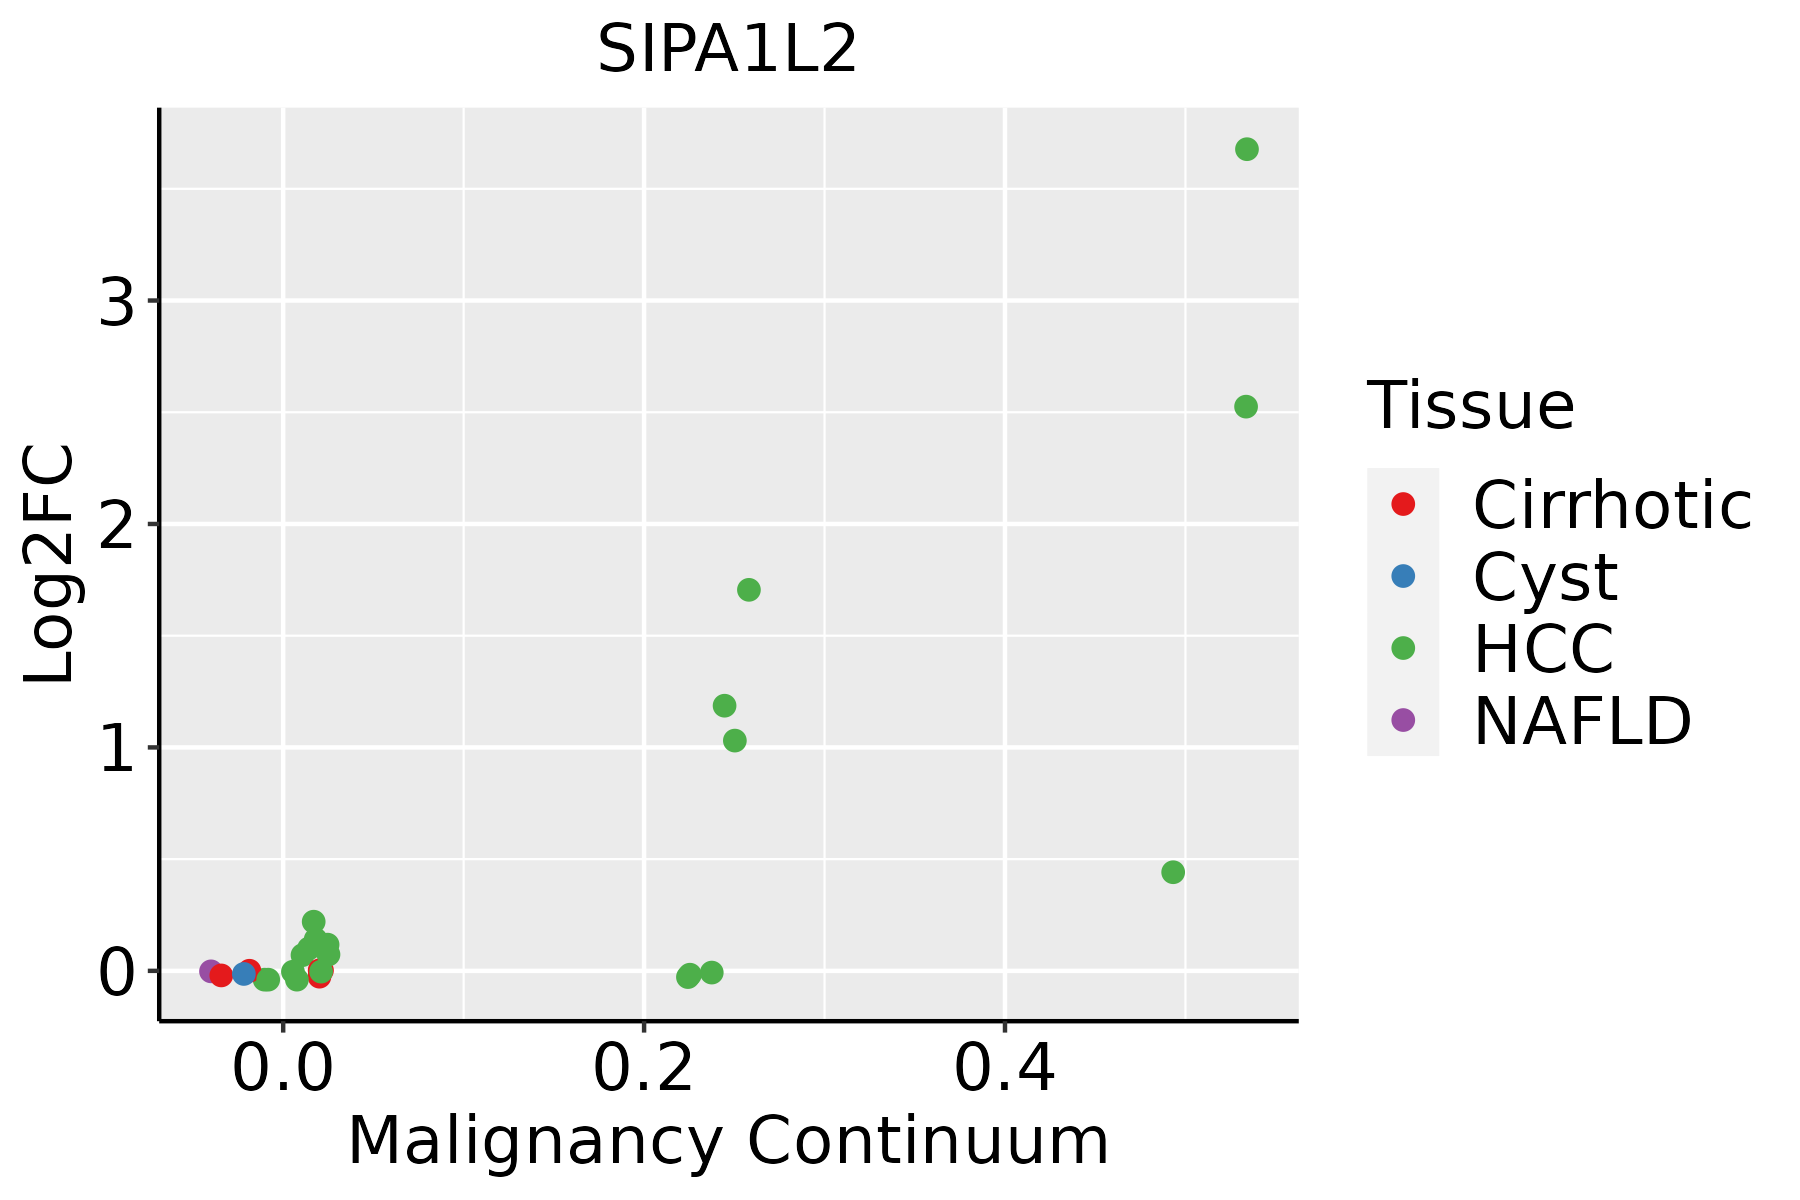 | HCC: Hepatocellular carcinoma |
| NAFLD: Non-alcoholic fatty liver disease | ||
| Thyroid | 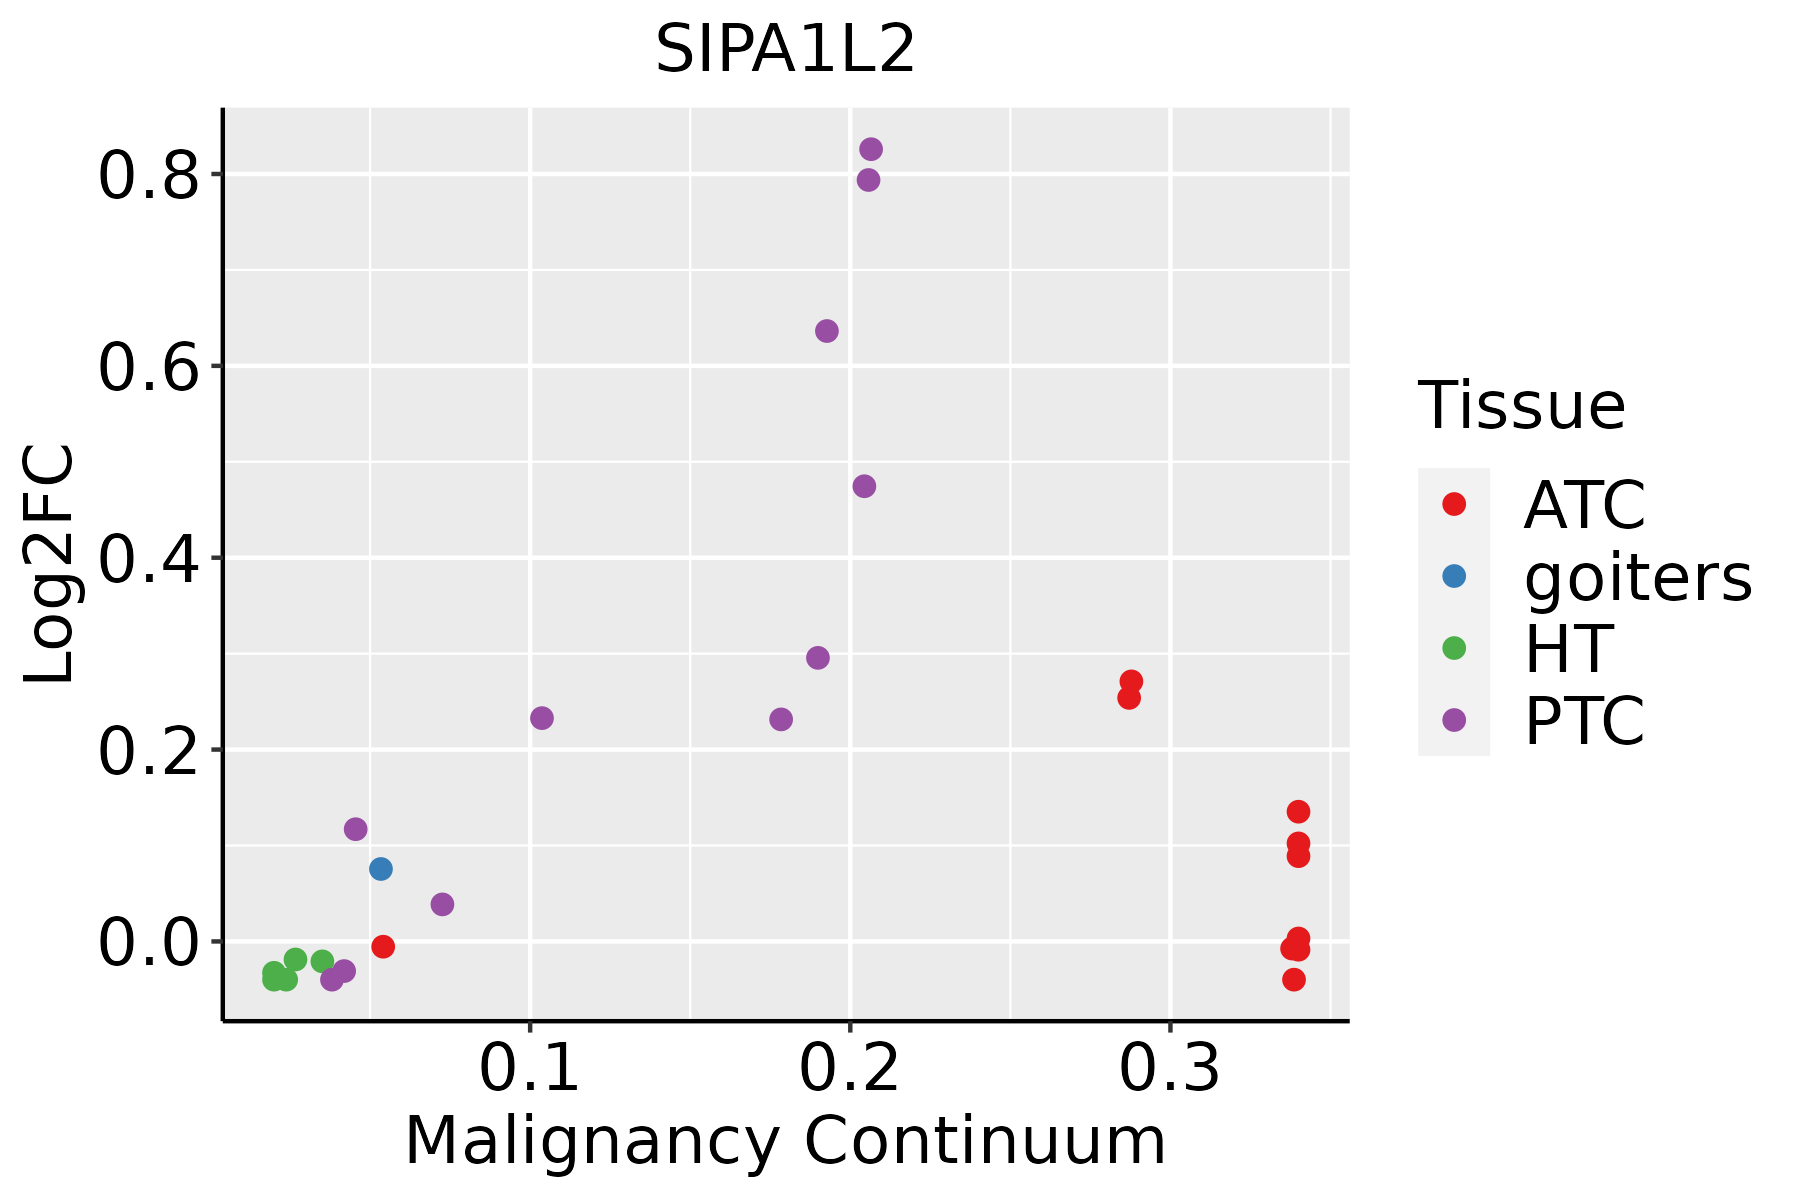 | ATC: Anaplastic thyroid cancer |
| HT: Hashimoto's thyroiditis | ||
| PTC: Papillary thyroid cancer |
| ∗log2FC in expression of this searched gene in stem-like cells from each diseased tissue sample relative to stem-like cells in normal samples in each tissue plotted against the malignancy continuum. Samples are colored based on if they are from different disease stage. |
Top |
Malignant transformation related pathway analysis |
| Find out the enriched GO biological processes and KEGG pathways involved in transition from healthy to precancer to cancer |
| Tissue | Disease Stage | Enriched GO biological Processes |
| Colorectum | AD |  |
| Colorectum | SER |  |
| Colorectum | MSS |  |
| Colorectum | MSI-H |  |
| Colorectum | FAP |  |
| ∗Top 15 enriched GO BP terms are showed in the bar plot of each disease state in each tissue. Each row represents a significant GO biological process which is colored according to the -log10(p.adjust). |
| Page: 1 2 3 4 5 6 7 8 9 |
| GO ID | Tissue | Disease Stage | Description | Gene Ratio | Bg Ratio | pvalue | p.adjust | Count |
| GO:00510566 | Cervix | CC | regulation of small GTPase mediated signal transduction | 75/2311 | 302/18723 | 1.54e-09 | 1.74e-07 | 75 |
| GO:00430877 | Cervix | CC | regulation of GTPase activity | 79/2311 | 348/18723 | 4.21e-08 | 2.60e-06 | 79 |
| GO:00435476 | Cervix | CC | positive regulation of GTPase activity | 53/2311 | 255/18723 | 8.72e-05 | 1.16e-03 | 53 |
| GO:0043087 | Colorectum | AD | regulation of GTPase activity | 110/3918 | 348/18723 | 1.64e-06 | 5.03e-05 | 110 |
| GO:0051056 | Colorectum | AD | regulation of small GTPase mediated signal transduction | 94/3918 | 302/18723 | 1.81e-05 | 3.76e-04 | 94 |
| GO:0043547 | Colorectum | AD | positive regulation of GTPase activity | 75/3918 | 255/18723 | 7.95e-04 | 7.91e-03 | 75 |
| GO:00430871 | Colorectum | SER | regulation of GTPase activity | 77/2897 | 348/18723 | 5.90e-04 | 8.07e-03 | 77 |
| GO:00430872 | Colorectum | MSS | regulation of GTPase activity | 101/3467 | 348/18723 | 1.00e-06 | 3.46e-05 | 101 |
| GO:00510561 | Colorectum | MSS | regulation of small GTPase mediated signal transduction | 82/3467 | 302/18723 | 1.31e-04 | 1.99e-03 | 82 |
| GO:00435471 | Colorectum | MSS | positive regulation of GTPase activity | 68/3467 | 255/18723 | 7.97e-04 | 8.38e-03 | 68 |
| GO:00510562 | Colorectum | FAP | regulation of small GTPase mediated signal transduction | 78/2622 | 302/18723 | 3.25e-08 | 2.85e-06 | 78 |
| GO:00430873 | Colorectum | FAP | regulation of GTPase activity | 85/2622 | 348/18723 | 1.20e-07 | 7.68e-06 | 85 |
| GO:00435472 | Colorectum | FAP | positive regulation of GTPase activity | 61/2622 | 255/18723 | 1.39e-05 | 3.73e-04 | 61 |
| GO:0090630 | Colorectum | FAP | activation of GTPase activity | 27/2622 | 115/18723 | 4.23e-03 | 2.90e-02 | 27 |
| GO:00510563 | Colorectum | CRC | regulation of small GTPase mediated signal transduction | 69/2078 | 302/18723 | 3.34e-09 | 9.08e-07 | 69 |
| GO:00430874 | Colorectum | CRC | regulation of GTPase activity | 69/2078 | 348/18723 | 1.11e-06 | 6.69e-05 | 69 |
| GO:00435473 | Colorectum | CRC | positive regulation of GTPase activity | 49/2078 | 255/18723 | 8.67e-05 | 1.77e-03 | 49 |
| GO:00430878 | Endometrium | AEH | regulation of GTPase activity | 66/2100 | 348/18723 | 1.26e-05 | 2.77e-04 | 66 |
| GO:00510567 | Endometrium | AEH | regulation of small GTPase mediated signal transduction | 59/2100 | 302/18723 | 1.43e-05 | 3.03e-04 | 59 |
| GO:00435477 | Endometrium | AEH | positive regulation of GTPase activity | 48/2100 | 255/18723 | 2.18e-04 | 2.67e-03 | 48 |
| Page: 1 2 |
| Pathway ID | Tissue | Disease Stage | Description | Gene Ratio | Bg Ratio | pvalue | p.adjust | qvalue | Count |
| hsa0401512 | Cervix | CC | Rap1 signaling pathway | 56/1267 | 210/8465 | 6.23e-06 | 5.61e-05 | 3.32e-05 | 56 |
| hsa0401513 | Cervix | CC | Rap1 signaling pathway | 56/1267 | 210/8465 | 6.23e-06 | 5.61e-05 | 3.32e-05 | 56 |
| hsa04015 | Colorectum | AD | Rap1 signaling pathway | 71/2092 | 210/8465 | 1.72e-03 | 9.68e-03 | 6.18e-03 | 71 |
| hsa040151 | Colorectum | AD | Rap1 signaling pathway | 71/2092 | 210/8465 | 1.72e-03 | 9.68e-03 | 6.18e-03 | 71 |
| hsa040152 | Colorectum | SER | Rap1 signaling pathway | 54/1580 | 210/8465 | 6.55e-03 | 3.68e-02 | 2.67e-02 | 54 |
| hsa040153 | Colorectum | SER | Rap1 signaling pathway | 54/1580 | 210/8465 | 6.55e-03 | 3.68e-02 | 2.67e-02 | 54 |
| hsa040154 | Colorectum | MSS | Rap1 signaling pathway | 66/1875 | 210/8465 | 1.03e-03 | 5.94e-03 | 3.64e-03 | 66 |
| hsa040155 | Colorectum | MSS | Rap1 signaling pathway | 66/1875 | 210/8465 | 1.03e-03 | 5.94e-03 | 3.64e-03 | 66 |
| hsa040156 | Colorectum | FAP | Rap1 signaling pathway | 53/1404 | 210/8465 | 7.93e-04 | 5.14e-03 | 3.13e-03 | 53 |
| hsa040157 | Colorectum | FAP | Rap1 signaling pathway | 53/1404 | 210/8465 | 7.93e-04 | 5.14e-03 | 3.13e-03 | 53 |
| hsa040158 | Colorectum | CRC | Rap1 signaling pathway | 48/1091 | 210/8465 | 4.00e-05 | 8.70e-04 | 5.90e-04 | 48 |
| hsa040159 | Colorectum | CRC | Rap1 signaling pathway | 48/1091 | 210/8465 | 4.00e-05 | 8.70e-04 | 5.90e-04 | 48 |
| hsa0401514 | Endometrium | AEH | Rap1 signaling pathway | 49/1197 | 210/8465 | 2.03e-04 | 1.78e-03 | 1.30e-03 | 49 |
| hsa0401515 | Endometrium | AEH | Rap1 signaling pathway | 49/1197 | 210/8465 | 2.03e-04 | 1.78e-03 | 1.30e-03 | 49 |
| hsa0401522 | Endometrium | EEC | Rap1 signaling pathway | 49/1237 | 210/8465 | 4.45e-04 | 3.47e-03 | 2.59e-03 | 49 |
| hsa0401532 | Endometrium | EEC | Rap1 signaling pathway | 49/1237 | 210/8465 | 4.45e-04 | 3.47e-03 | 2.59e-03 | 49 |
| Page: 1 |
Top |
Cell-cell communication analysis |
| Identification of potential cell-cell interactions between two cell types and their ligand-receptor pairs for different disease states |
| Ligand | Receptor | LRpair | Pathway | Tissue | Disease Stage |
| Page: 1 |
Top |
Single-cell gene regulatory network inference analysis |
| Find out the significant the regulons (TFs) and the target genes of each regulon across cell types for different disease states |
| TF | Cell Type | Tissue | Disease Stage | Target Gene | RSS | Regulon Activity |
| ∗The dot plots of a searched regulon are shown for all cell subpopulations in each disease state of each tissue based on the regulon specific score inferred using pySCENIC and by calculating the average expression. |
| Page: 1 |
Top |
Somatic mutation of malignant transformation related genes |
| Annotation of somatic variants for genes involved in malignant transformation |
| Hugo Symbol | Variant Class | Variant Classification | dbSNP RS | HGVSc | HGVSp | HGVSp Short | SWISSPROT | BIOTYPE | SIFT | PolyPhen | Tumor Sample Barcode | Tissue | Histology | Sex | Age | Stage | Therapy Types | Drugs | Outcome |
| SIPA1L2 | SNV | Missense_Mutation | c.4617N>A | p.Met1539Ile | p.M1539I | Q9P2F8 | protein_coding | tolerated(0.34) | benign(0) | TCGA-A2-A0CT-01 | Breast | breast invasive carcinoma | Female | >=65 | I/II | Chemotherapy | cytoxan | SD | |
| SIPA1L2 | SNV | Missense_Mutation | rs766060322 | c.1696N>G | p.Leu566Val | p.L566V | Q9P2F8 | protein_coding | tolerated(0.09) | benign(0.299) | TCGA-A2-A0YK-01 | Breast | breast invasive carcinoma | Female | <65 | I/II | Chemotherapy | cytoxan | SD |
| SIPA1L2 | SNV | Missense_Mutation | c.3671C>A | p.Ser1224Tyr | p.S1224Y | Q9P2F8 | protein_coding | deleterious(0) | probably_damaging(0.915) | TCGA-A2-A25A-01 | Breast | breast invasive carcinoma | Female | <65 | I/II | Unspecific | Cytoxan | SD | |
| SIPA1L2 | SNV | Missense_Mutation | c.3074N>T | p.His1025Leu | p.H1025L | Q9P2F8 | protein_coding | deleterious(0.01) | benign(0.109) | TCGA-A8-A06T-01 | Breast | breast invasive carcinoma | Female | >=65 | III/IV | Hormone Therapy | anastrozole | SD | |
| SIPA1L2 | SNV | Missense_Mutation | c.27N>C | p.Glu9Asp | p.E9D | Q9P2F8 | protein_coding | tolerated_low_confidence(0.31) | benign(0.001) | TCGA-A8-A096-01 | Breast | breast invasive carcinoma | Female | >=65 | I/II | Unknown | Unknown | SD | |
| SIPA1L2 | SNV | Missense_Mutation | rs370086049 | c.3125N>C | p.Met1042Thr | p.M1042T | Q9P2F8 | protein_coding | tolerated(1) | benign(0.001) | TCGA-A8-A0A4-01 | Breast | breast invasive carcinoma | Female | >=65 | I/II | Hormone Therapy | tamoxiphen | CR |
| SIPA1L2 | SNV | Missense_Mutation | novel | c.3638C>A | p.Ser1213Tyr | p.S1213Y | Q9P2F8 | protein_coding | deleterious(0) | possibly_damaging(0.687) | TCGA-AN-A046-01 | Breast | breast invasive carcinoma | Female | >=65 | I/II | Unknown | Unknown | SD |
| SIPA1L2 | SNV | Missense_Mutation | novel | c.3425T>C | p.Val1142Ala | p.V1142A | Q9P2F8 | protein_coding | tolerated(0.53) | benign(0) | TCGA-AN-A046-01 | Breast | breast invasive carcinoma | Female | >=65 | I/II | Unknown | Unknown | SD |
| SIPA1L2 | SNV | Missense_Mutation | novel | c.1018A>T | p.Asn340Tyr | p.N340Y | Q9P2F8 | protein_coding | deleterious(0) | probably_damaging(0.921) | TCGA-AN-A046-01 | Breast | breast invasive carcinoma | Female | >=65 | I/II | Unknown | Unknown | SD |
| SIPA1L2 | SNV | Missense_Mutation | c.1894N>T | p.Pro632Ser | p.P632S | Q9P2F8 | protein_coding | tolerated(0.06) | probably_damaging(0.99) | TCGA-AN-A0AK-01 | Breast | breast invasive carcinoma | Female | >=65 | I/II | Unknown | Unknown | SD |
| Page: 1 2 3 4 5 6 7 8 9 10 11 12 13 14 15 16 17 18 19 20 21 22 23 24 25 26 27 28 |
Top |
Related drugs of malignant transformation related genes |
| Identification of chemicals and drugs interact with genes involved in malignant transfromation |
| (DGIdb 4.0) |
| Entrez ID | Symbol | Category | Interaction Types | Drug Claim Name | Drug Name | PMIDs |
| Page: 1 |

Copyright 2023-Present -The University of Texas Health Science Center at Houston |