
|
|||||
|
 | |
| |
| |
| |
| |
| |
|
Gene: SIPA1 |
Gene summary for SIPA1 |
| Gene information | Species | Human | Gene symbol | SIPA1 | Gene ID | 6494 |
| Gene name | signal-induced proliferation-associated 1 | |
| Gene Alias | SPA1 | |
| Cytomap | 11q13.1 | |
| Gene Type | protein-coding | GO ID | GO:0001101 | UniProtAcc | Q96FS4 |
Top |
Malignant transformation analysis |
| Identification of the aberrant gene expression in precancerous and cancerous lesions by comparing the gene expression of stem-like cells in diseased tissues with normal stem cells |
| Entrez ID | Symbol | Replicates | Species | Organ | Tissue | Adj P-value | Log2FC | Malignancy |
| 6494 | SIPA1 | LZE5T | Human | Esophagus | ESCC | 1.02e-05 | 3.65e-01 | 0.0514 |
| 6494 | SIPA1 | LZE20T | Human | Esophagus | ESCC | 1.94e-21 | 7.57e-01 | 0.0662 |
| 6494 | SIPA1 | LZE22T | Human | Esophagus | ESCC | 3.76e-04 | 4.15e-01 | 0.068 |
| 6494 | SIPA1 | LZE24T | Human | Esophagus | ESCC | 3.32e-33 | 7.78e-01 | 0.0596 |
| 6494 | SIPA1 | P1T-E | Human | Esophagus | ESCC | 8.04e-17 | 6.33e-01 | 0.0875 |
| 6494 | SIPA1 | P2T-E | Human | Esophagus | ESCC | 8.98e-11 | 1.34e-01 | 0.1177 |
| 6494 | SIPA1 | P4T-E | Human | Esophagus | ESCC | 3.70e-17 | 4.04e-01 | 0.1323 |
| 6494 | SIPA1 | P5T-E | Human | Esophagus | ESCC | 5.61e-14 | 2.49e-01 | 0.1327 |
| 6494 | SIPA1 | P8T-E | Human | Esophagus | ESCC | 3.34e-50 | 1.04e+00 | 0.0889 |
| 6494 | SIPA1 | P9T-E | Human | Esophagus | ESCC | 5.26e-04 | 1.25e-01 | 0.1131 |
| 6494 | SIPA1 | P10T-E | Human | Esophagus | ESCC | 6.95e-03 | 6.97e-02 | 0.116 |
| 6494 | SIPA1 | P11T-E | Human | Esophagus | ESCC | 3.49e-06 | 2.16e-01 | 0.1426 |
| 6494 | SIPA1 | P12T-E | Human | Esophagus | ESCC | 1.74e-03 | 1.25e-01 | 0.1122 |
| 6494 | SIPA1 | P15T-E | Human | Esophagus | ESCC | 4.50e-21 | 4.31e-01 | 0.1149 |
| 6494 | SIPA1 | P16T-E | Human | Esophagus | ESCC | 8.64e-19 | 3.91e-01 | 0.1153 |
| 6494 | SIPA1 | P17T-E | Human | Esophagus | ESCC | 4.36e-13 | 5.10e-01 | 0.1278 |
| 6494 | SIPA1 | P19T-E | Human | Esophagus | ESCC | 3.01e-06 | 4.41e-01 | 0.1662 |
| 6494 | SIPA1 | P20T-E | Human | Esophagus | ESCC | 6.05e-24 | 4.92e-01 | 0.1124 |
| 6494 | SIPA1 | P21T-E | Human | Esophagus | ESCC | 2.67e-07 | 2.29e-01 | 0.1617 |
| 6494 | SIPA1 | P23T-E | Human | Esophagus | ESCC | 4.43e-31 | 7.70e-01 | 0.108 |
| Page: 1 2 3 4 5 |
| Tissue | Expression Dynamics | Abbreviation |
| Esophagus | 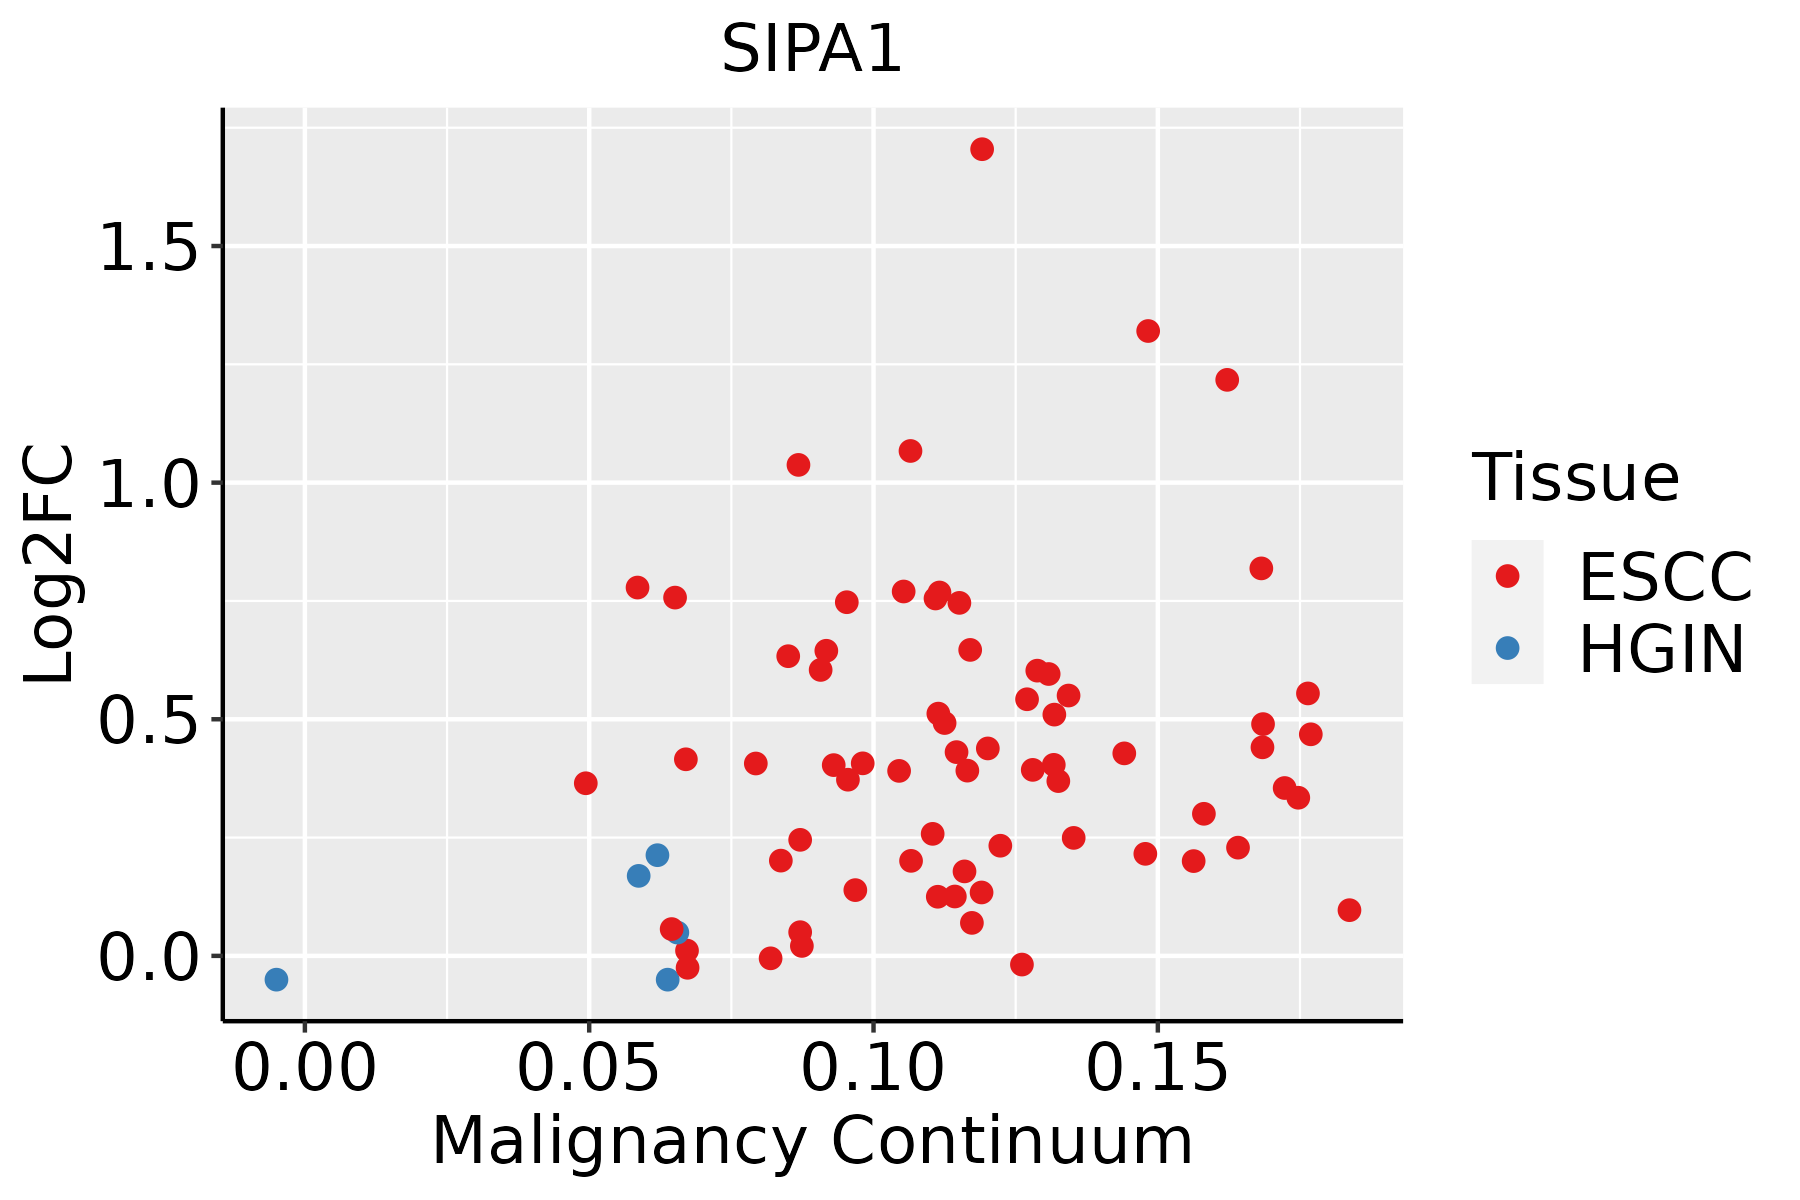 | ESCC: Esophageal squamous cell carcinoma |
| HGIN: High-grade intraepithelial neoplasias | ||
| LGIN: Low-grade intraepithelial neoplasias | ||
| Liver |  | HCC: Hepatocellular carcinoma |
| NAFLD: Non-alcoholic fatty liver disease | ||
| Oral Cavity |  | EOLP: Erosive Oral lichen planus |
| LP: leukoplakia | ||
| NEOLP: Non-erosive oral lichen planus | ||
| OSCC: Oral squamous cell carcinoma |
| ∗log2FC in expression of this searched gene in stem-like cells from each diseased tissue sample relative to stem-like cells in normal samples in each tissue plotted against the malignancy continuum. Samples are colored based on if they are from different disease stage. |
Top |
Malignant transformation related pathway analysis |
| Find out the enriched GO biological processes and KEGG pathways involved in transition from healthy to precancer to cancer |
| Tissue | Disease Stage | Enriched GO biological Processes |
| Colorectum | AD |  |
| Colorectum | SER |  |
| Colorectum | MSS |  |
| Colorectum | MSI-H |  |
| Colorectum | FAP |  |
| ∗Top 15 enriched GO BP terms are showed in the bar plot of each disease state in each tissue. Each row represents a significant GO biological process which is colored according to the -log10(p.adjust). |
| Page: 1 2 3 4 5 6 7 8 9 |
| GO ID | Tissue | Disease Stage | Description | Gene Ratio | Bg Ratio | pvalue | p.adjust | Count |
| GO:00071639 | Cervix | CC | establishment or maintenance of cell polarity | 63/2311 | 218/18723 | 4.25e-11 | 8.76e-09 | 63 |
| GO:00510566 | Cervix | CC | regulation of small GTPase mediated signal transduction | 75/2311 | 302/18723 | 1.54e-09 | 1.74e-07 | 75 |
| GO:00430877 | Cervix | CC | regulation of GTPase activity | 79/2311 | 348/18723 | 4.21e-08 | 2.60e-06 | 79 |
| GO:00300108 | Cervix | CC | establishment of cell polarity | 42/2311 | 143/18723 | 4.30e-08 | 2.62e-06 | 42 |
| GO:00163587 | Cervix | CC | dendrite development | 58/2311 | 243/18723 | 4.52e-07 | 1.76e-05 | 58 |
| GO:00315328 | Cervix | CC | actin cytoskeleton reorganization | 31/2311 | 107/18723 | 3.34e-06 | 8.99e-05 | 31 |
| GO:00109757 | Cervix | CC | regulation of neuron projection development | 88/2311 | 445/18723 | 4.26e-06 | 1.09e-04 | 88 |
| GO:00609965 | Cervix | CC | dendritic spine development | 28/2311 | 99/18723 | 1.61e-05 | 3.15e-04 | 28 |
| GO:00615647 | Cervix | CC | axon development | 89/2311 | 467/18723 | 1.71e-05 | 3.27e-04 | 89 |
| GO:00435476 | Cervix | CC | positive regulation of GTPase activity | 53/2311 | 255/18723 | 8.72e-05 | 1.16e-03 | 53 |
| GO:00074097 | Cervix | CC | axonogenesis | 78/2311 | 418/18723 | 1.14e-04 | 1.43e-03 | 78 |
| GO:000206410 | Cervix | CC | epithelial cell development | 45/2311 | 220/18723 | 4.14e-04 | 4.21e-03 | 45 |
| GO:00507705 | Cervix | CC | regulation of axonogenesis | 34/2311 | 154/18723 | 4.87e-04 | 4.76e-03 | 34 |
| GO:00901627 | Cervix | CC | establishment of epithelial cell polarity | 11/2311 | 31/18723 | 7.87e-04 | 6.96e-03 | 11 |
| GO:00022443 | Cervix | CC | hematopoietic progenitor cell differentiation | 26/2311 | 114/18723 | 1.30e-03 | 1.03e-02 | 26 |
| GO:00480131 | Cervix | CC | ephrin receptor signaling pathway | 14/2311 | 51/18723 | 2.78e-03 | 1.87e-02 | 14 |
| GO:00488135 | Cervix | CC | dendrite morphogenesis | 30/2311 | 146/18723 | 3.27e-03 | 2.13e-02 | 30 |
| GO:01060277 | Cervix | CC | neuron projection organization | 21/2311 | 93/18723 | 4.10e-03 | 2.54e-02 | 21 |
| GO:0150063 | Cervix | CC | visual system development | 63/2311 | 375/18723 | 6.58e-03 | 3.65e-02 | 63 |
| GO:00507733 | Cervix | CC | regulation of dendrite development | 22/2311 | 103/18723 | 6.75e-03 | 3.71e-02 | 22 |
| Page: 1 2 3 4 5 6 7 8 9 10 11 12 13 14 15 16 17 18 19 20 21 22 23 24 |
| Pathway ID | Tissue | Disease Stage | Description | Gene Ratio | Bg Ratio | pvalue | p.adjust | qvalue | Count |
| hsa0467042 | Liver | HCC | Leukocyte transendothelial migration | 68/4020 | 114/8465 | 5.79e-03 | 1.64e-02 | 9.15e-03 | 68 |
| hsa0467052 | Liver | HCC | Leukocyte transendothelial migration | 68/4020 | 114/8465 | 5.79e-03 | 1.64e-02 | 9.15e-03 | 68 |
| hsa0467030 | Oral cavity | OSCC | Leukocyte transendothelial migration | 63/3704 | 114/8465 | 8.46e-03 | 1.96e-02 | 9.95e-03 | 63 |
| hsa0401518 | Oral cavity | OSCC | Rap1 signaling pathway | 107/3704 | 210/8465 | 2.01e-02 | 4.34e-02 | 2.21e-02 | 107 |
| hsa04670113 | Oral cavity | OSCC | Leukocyte transendothelial migration | 63/3704 | 114/8465 | 8.46e-03 | 1.96e-02 | 9.95e-03 | 63 |
| hsa0401519 | Oral cavity | OSCC | Rap1 signaling pathway | 107/3704 | 210/8465 | 2.01e-02 | 4.34e-02 | 2.21e-02 | 107 |
| Page: 1 |
Top |
Cell-cell communication analysis |
| Identification of potential cell-cell interactions between two cell types and their ligand-receptor pairs for different disease states |
| Ligand | Receptor | LRpair | Pathway | Tissue | Disease Stage |
| Page: 1 |
Top |
Single-cell gene regulatory network inference analysis |
| Find out the significant the regulons (TFs) and the target genes of each regulon across cell types for different disease states |
| TF | Cell Type | Tissue | Disease Stage | Target Gene | RSS | Regulon Activity |
| ∗The dot plots of a searched regulon are shown for all cell subpopulations in each disease state of each tissue based on the regulon specific score inferred using pySCENIC and by calculating the average expression. |
| Page: 1 |
Top |
Somatic mutation of malignant transformation related genes |
| Annotation of somatic variants for genes involved in malignant transformation |
| Hugo Symbol | Variant Class | Variant Classification | dbSNP RS | HGVSc | HGVSp | HGVSp Short | SWISSPROT | BIOTYPE | SIFT | PolyPhen | Tumor Sample Barcode | Tissue | Histology | Sex | Age | Stage | Therapy Types | Drugs | Outcome |
| SIPA1 | SNV | Missense_Mutation | rs747257834 | c.2644N>A | p.Pro882Thr | p.P882T | Q96FS4 | protein_coding | tolerated(0.07) | benign(0.025) | TCGA-AC-A5XU-01 | Breast | breast invasive carcinoma | Female | >=65 | I/II | Hormone Therapy | letrozole | SD |
| SIPA1 | SNV | Missense_Mutation | c.724N>A | p.Ala242Thr | p.A242T | Q96FS4 | protein_coding | deleterious(0) | possibly_damaging(0.679) | TCGA-AN-A046-01 | Breast | breast invasive carcinoma | Female | >=65 | I/II | Unknown | Unknown | SD | |
| SIPA1 | SNV | Missense_Mutation | c.3118N>C | p.Asp1040His | p.D1040H | Q96FS4 | protein_coding | deleterious_low_confidence(0.04) | probably_damaging(0.995) | TCGA-AO-A0J5-01 | Breast | breast invasive carcinoma | Female | <65 | III/IV | Other, specify in notesBisphosphonate | zoledronic | PD | |
| SIPA1 | SNV | Missense_Mutation | c.3120N>A | p.Asp1040Glu | p.D1040E | Q96FS4 | protein_coding | deleterious_low_confidence(0.02) | probably_damaging(0.935) | TCGA-AO-A0J5-01 | Breast | breast invasive carcinoma | Female | <65 | III/IV | Other, specify in notesBisphosphonate | zoledronic | PD | |
| SIPA1 | SNV | Missense_Mutation | novel | c.1247N>G | p.Pro416Arg | p.P416R | Q96FS4 | protein_coding | deleterious(0) | probably_damaging(0.951) | TCGA-OL-A5RW-01 | Breast | breast invasive carcinoma | Female | <65 | I/II | Chemotherapy | adriamycin | CR |
| SIPA1 | insertion | In_Frame_Ins | novel | c.726_727insCCC | p.Ala242_Val243insPro | p.A242_V243insP | Q96FS4 | protein_coding | TCGA-AN-A046-01 | Breast | breast invasive carcinoma | Female | >=65 | I/II | Unknown | Unknown | SD | ||
| SIPA1 | SNV | Missense_Mutation | c.2530N>G | p.Leu844Val | p.L844V | Q96FS4 | protein_coding | tolerated(0.15) | benign(0.025) | TCGA-DR-A0ZM-01 | Cervix | cervical & endocervical cancer | Female | <65 | III/IV | Unspecific | Cisplatin | SD | |
| SIPA1 | SNV | Missense_Mutation | c.803C>T | p.Thr268Met | p.T268M | Q96FS4 | protein_coding | deleterious(0) | possibly_damaging(0.799) | TCGA-EA-A3HQ-01 | Cervix | cervical & endocervical cancer | Female | <65 | I/II | Unknown | Unknown | SD | |
| SIPA1 | SNV | Missense_Mutation | c.778N>G | p.Ser260Gly | p.S260G | Q96FS4 | protein_coding | deleterious(0.02) | benign(0.281) | TCGA-AA-3492-01 | Colorectum | colon adenocarcinoma | Female | >=65 | I/II | Unknown | Unknown | SD | |
| SIPA1 | SNV | Missense_Mutation | novel | c.2713N>T | p.Arg905Cys | p.R905C | Q96FS4 | protein_coding | deleterious(0) | possibly_damaging(0.799) | TCGA-AA-3663-01 | Colorectum | colon adenocarcinoma | Male | <65 | I/II | Unknown | Unknown | SD |
| Page: 1 2 3 4 5 6 |
Top |
Related drugs of malignant transformation related genes |
| Identification of chemicals and drugs interact with genes involved in malignant transfromation |
| (DGIdb 4.0) |
| Entrez ID | Symbol | Category | Interaction Types | Drug Claim Name | Drug Name | PMIDs |
| Page: 1 |

Copyright 2023-Present -The University of Texas Health Science Center at Houston |