
|
|||||
|
 | |
| |
| |
| |
| |
| |
|
Gene: SIN3B |
Gene summary for SIN3B |
| Gene information | Species | Human | Gene symbol | SIN3B | Gene ID | 23309 |
| Gene name | SIN3 transcription regulator family member B | |
| Gene Alias | SIN3B | |
| Cytomap | 19p13.11 | |
| Gene Type | protein-coding | GO ID | GO:0000122 | UniProtAcc | O75182 |
Top |
Malignant transformation analysis |
| Identification of the aberrant gene expression in precancerous and cancerous lesions by comparing the gene expression of stem-like cells in diseased tissues with normal stem cells |
| Entrez ID | Symbol | Replicates | Species | Organ | Tissue | Adj P-value | Log2FC | Malignancy |
| 23309 | SIN3B | LZE4T | Human | Esophagus | ESCC | 1.24e-04 | 1.55e-01 | 0.0811 |
| 23309 | SIN3B | LZE5T | Human | Esophagus | ESCC | 3.77e-03 | 1.94e-01 | 0.0514 |
| 23309 | SIN3B | LZE7T | Human | Esophagus | ESCC | 1.43e-04 | 1.56e-01 | 0.0667 |
| 23309 | SIN3B | LZE20T | Human | Esophagus | ESCC | 9.17e-03 | 1.18e-01 | 0.0662 |
| 23309 | SIN3B | LZE24T | Human | Esophagus | ESCC | 3.51e-09 | 2.79e-01 | 0.0596 |
| 23309 | SIN3B | P1T-E | Human | Esophagus | ESCC | 5.31e-11 | 3.41e-01 | 0.0875 |
| 23309 | SIN3B | P2T-E | Human | Esophagus | ESCC | 2.38e-15 | 2.55e-01 | 0.1177 |
| 23309 | SIN3B | P4T-E | Human | Esophagus | ESCC | 2.72e-20 | 2.82e-01 | 0.1323 |
| 23309 | SIN3B | P5T-E | Human | Esophagus | ESCC | 1.80e-34 | 5.55e-01 | 0.1327 |
| 23309 | SIN3B | P8T-E | Human | Esophagus | ESCC | 1.54e-15 | 2.98e-01 | 0.0889 |
| 23309 | SIN3B | P9T-E | Human | Esophagus | ESCC | 4.41e-12 | 3.04e-01 | 0.1131 |
| 23309 | SIN3B | P10T-E | Human | Esophagus | ESCC | 1.81e-25 | 4.55e-01 | 0.116 |
| 23309 | SIN3B | P11T-E | Human | Esophagus | ESCC | 2.46e-14 | 5.73e-01 | 0.1426 |
| 23309 | SIN3B | P12T-E | Human | Esophagus | ESCC | 4.57e-15 | 3.08e-01 | 0.1122 |
| 23309 | SIN3B | P15T-E | Human | Esophagus | ESCC | 1.98e-20 | 3.86e-01 | 0.1149 |
| 23309 | SIN3B | P16T-E | Human | Esophagus | ESCC | 7.32e-13 | 2.15e-01 | 0.1153 |
| 23309 | SIN3B | P17T-E | Human | Esophagus | ESCC | 1.55e-15 | 5.03e-01 | 0.1278 |
| 23309 | SIN3B | P19T-E | Human | Esophagus | ESCC | 2.95e-02 | 3.18e-01 | 0.1662 |
| 23309 | SIN3B | P20T-E | Human | Esophagus | ESCC | 7.03e-18 | 1.93e-01 | 0.1124 |
| 23309 | SIN3B | P21T-E | Human | Esophagus | ESCC | 9.17e-25 | 4.99e-01 | 0.1617 |
| Page: 1 2 3 4 5 |
| Tissue | Expression Dynamics | Abbreviation |
| Esophagus |  | ESCC: Esophageal squamous cell carcinoma |
| HGIN: High-grade intraepithelial neoplasias | ||
| LGIN: Low-grade intraepithelial neoplasias | ||
| Oral Cavity | 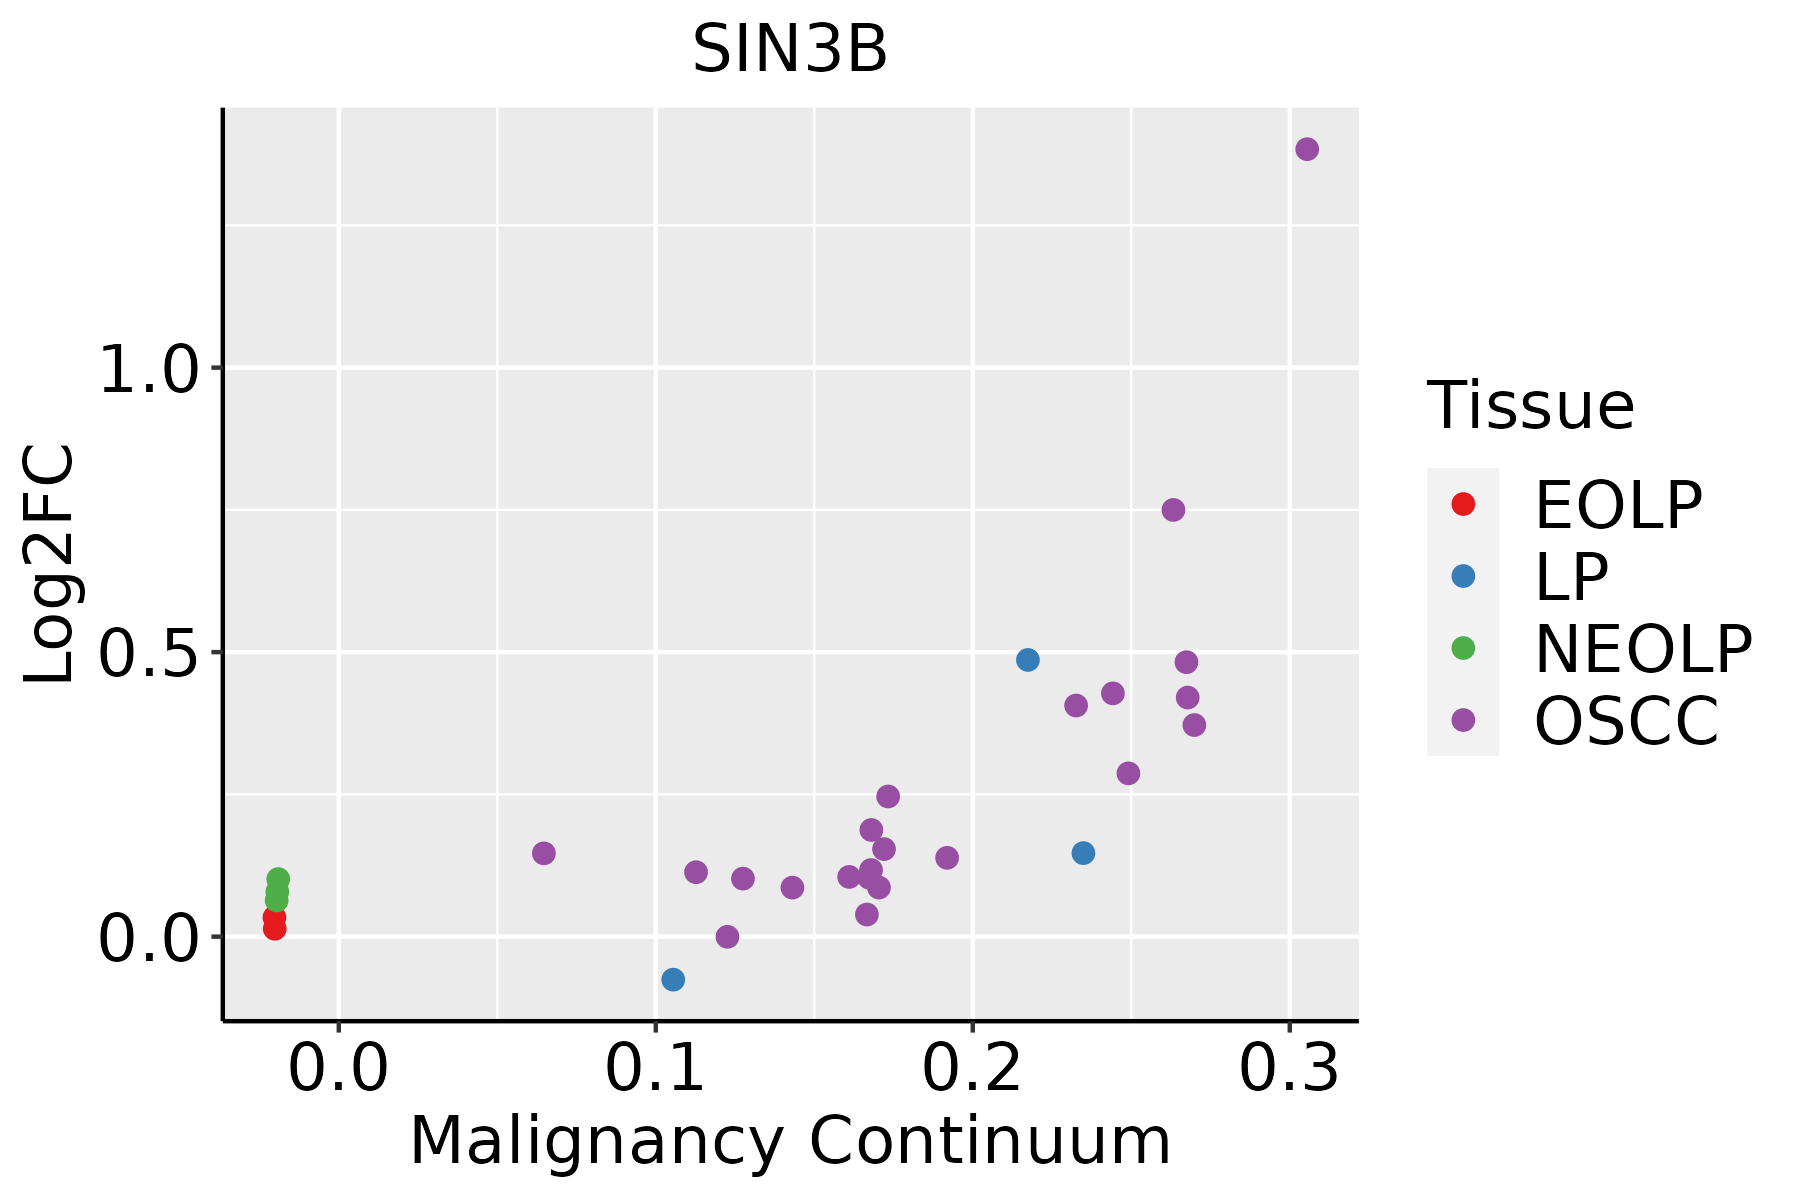 | EOLP: Erosive Oral lichen planus |
| LP: leukoplakia | ||
| NEOLP: Non-erosive oral lichen planus | ||
| OSCC: Oral squamous cell carcinoma | ||
| Thyroid |  | ATC: Anaplastic thyroid cancer |
| HT: Hashimoto's thyroiditis | ||
| PTC: Papillary thyroid cancer |
| ∗log2FC in expression of this searched gene in stem-like cells from each diseased tissue sample relative to stem-like cells in normal samples in each tissue plotted against the malignancy continuum. Samples are colored based on if they are from different disease stage. |
Top |
Malignant transformation related pathway analysis |
| Find out the enriched GO biological processes and KEGG pathways involved in transition from healthy to precancer to cancer |
| Tissue | Disease Stage | Enriched GO biological Processes |
| Colorectum | AD |  |
| Colorectum | SER |  |
| Colorectum | MSS |  |
| Colorectum | MSI-H |  |
| Colorectum | FAP |  |
| ∗Top 15 enriched GO BP terms are showed in the bar plot of each disease state in each tissue. Each row represents a significant GO biological process which is colored according to the -log10(p.adjust). |
| Page: 1 2 3 4 5 6 7 8 9 |
| GO ID | Tissue | Disease Stage | Description | Gene Ratio | Bg Ratio | pvalue | p.adjust | Count |
| GO:001657015 | Esophagus | ESCC | histone modification | 323/8552 | 463/18723 | 2.61e-26 | 7.88e-24 | 323 |
| GO:00356015 | Esophagus | ESCC | protein deacylation | 79/8552 | 112/18723 | 8.30e-08 | 1.42e-06 | 79 |
| GO:00987325 | Esophagus | ESCC | macromolecule deacylation | 80/8552 | 116/18723 | 3.19e-07 | 4.50e-06 | 80 |
| GO:00165754 | Esophagus | ESCC | histone deacetylation | 60/8552 | 82/18723 | 3.85e-07 | 5.32e-06 | 60 |
| GO:00064765 | Esophagus | ESCC | protein deacetylation | 70/8552 | 101/18723 | 1.29e-06 | 1.58e-05 | 70 |
| GO:00165707 | Oral cavity | OSCC | histone modification | 270/7305 | 463/18723 | 1.59e-17 | 1.50e-15 | 270 |
| GO:00356014 | Oral cavity | OSCC | protein deacylation | 74/7305 | 112/18723 | 5.88e-09 | 1.26e-07 | 74 |
| GO:00987324 | Oral cavity | OSCC | macromolecule deacylation | 74/7305 | 116/18723 | 5.52e-08 | 1.01e-06 | 74 |
| GO:00064764 | Oral cavity | OSCC | protein deacetylation | 66/7305 | 101/18723 | 7.36e-08 | 1.30e-06 | 66 |
| GO:00165753 | Oral cavity | OSCC | histone deacetylation | 54/7305 | 82/18723 | 7.68e-07 | 1.08e-05 | 54 |
| GO:001657010 | Thyroid | PTC | histone modification | 235/5968 | 463/18723 | 1.17e-17 | 1.15e-15 | 235 |
| GO:00356017 | Thyroid | PTC | protein deacylation | 58/5968 | 112/18723 | 9.29e-06 | 1.05e-04 | 58 |
| GO:00165756 | Thyroid | PTC | histone deacetylation | 45/5968 | 82/18723 | 1.34e-05 | 1.45e-04 | 45 |
| GO:00064767 | Thyroid | PTC | protein deacetylation | 53/5968 | 101/18723 | 1.36e-05 | 1.47e-04 | 53 |
| GO:00987327 | Thyroid | PTC | macromolecule deacylation | 58/5968 | 116/18723 | 3.59e-05 | 3.36e-04 | 58 |
| GO:001657017 | Thyroid | ATC | histone modification | 243/6293 | 463/18723 | 2.23e-17 | 2.27e-15 | 243 |
| GO:003560114 | Thyroid | ATC | protein deacylation | 61/6293 | 112/18723 | 4.37e-06 | 4.79e-05 | 61 |
| GO:000647614 | Thyroid | ATC | protein deacetylation | 56/6293 | 101/18723 | 5.15e-06 | 5.57e-05 | 56 |
| GO:001657512 | Thyroid | ATC | histone deacetylation | 47/6293 | 82/18723 | 8.75e-06 | 8.81e-05 | 47 |
| GO:009873213 | Thyroid | ATC | macromolecule deacylation | 61/6293 | 116/18723 | 1.89e-05 | 1.72e-04 | 61 |
| Page: 1 |
| Pathway ID | Tissue | Disease Stage | Description | Gene Ratio | Bg Ratio | pvalue | p.adjust | qvalue | Count |
| Page: 1 |
Top |
Cell-cell communication analysis |
| Identification of potential cell-cell interactions between two cell types and their ligand-receptor pairs for different disease states |
| Ligand | Receptor | LRpair | Pathway | Tissue | Disease Stage |
| Page: 1 |
Top |
Single-cell gene regulatory network inference analysis |
| Find out the significant the regulons (TFs) and the target genes of each regulon across cell types for different disease states |
| TF | Cell Type | Tissue | Disease Stage | Target Gene | RSS | Regulon Activity |
| ∗The dot plots of a searched regulon are shown for all cell subpopulations in each disease state of each tissue based on the regulon specific score inferred using pySCENIC and by calculating the average expression. |
| Page: 1 |
Top |
Somatic mutation of malignant transformation related genes |
| Annotation of somatic variants for genes involved in malignant transformation |
| Hugo Symbol | Variant Class | Variant Classification | dbSNP RS | HGVSc | HGVSp | HGVSp Short | SWISSPROT | BIOTYPE | SIFT | PolyPhen | Tumor Sample Barcode | Tissue | Histology | Sex | Age | Stage | Therapy Types | Drugs | Outcome |
| SIN3B | SNV | Missense_Mutation | rs753381939 | c.3347N>T | p.Ala1116Val | p.A1116V | O75182 | protein_coding | tolerated(0.2) | benign(0.013) | TCGA-A2-A0CS-01 | Breast | breast invasive carcinoma | Female | >=65 | III/IV | Hormone Therapy | anastrozole | SD |
| SIN3B | SNV | Missense_Mutation | rs753381939 | c.3347N>T | p.Ala1116Val | p.A1116V | O75182 | protein_coding | tolerated(0.2) | benign(0.013) | TCGA-A2-A1G0-01 | Breast | breast invasive carcinoma | Female | <65 | I/II | Chemotherapy | taxotere | SD |
| SIN3B | SNV | Missense_Mutation | c.331G>A | p.Asp111Asn | p.D111N | O75182 | protein_coding | deleterious(0.02) | benign(0.027) | TCGA-A8-A08S-01 | Breast | breast invasive carcinoma | Female | >=65 | I/II | Hormone Therapy | anastrozole | SD | |
| SIN3B | SNV | Missense_Mutation | c.1394N>T | p.Ser465Phe | p.S465F | O75182 | protein_coding | deleterious(0) | benign(0.403) | TCGA-AC-A23H-01 | Breast | breast invasive carcinoma | Female | >=65 | I/II | Unknown | Unknown | PD | |
| SIN3B | SNV | Missense_Mutation | c.982N>G | p.Leu328Val | p.L328V | O75182 | protein_coding | deleterious(0.04) | probably_damaging(0.999) | TCGA-AR-A256-01 | Breast | breast invasive carcinoma | Female | <65 | I/II | Chemotherapy | doxorubicin | PD | |
| SIN3B | SNV | Missense_Mutation | novel | c.3286N>T | p.His1096Tyr | p.H1096Y | O75182 | protein_coding | deleterious(0) | probably_damaging(0.961) | TCGA-BH-A0BP-01 | Breast | breast invasive carcinoma | Female | >=65 | I/II | Unknown | Unknown | SD |
| SIN3B | SNV | Missense_Mutation | rs760752165 | c.994G>A | p.Ala332Thr | p.A332T | O75182 | protein_coding | tolerated(0.4) | benign(0.183) | TCGA-BH-A0DD-01 | Breast | breast invasive carcinoma | Male | <65 | I/II | Chemotherapy | docetaxel | CR |
| SIN3B | SNV | Missense_Mutation | rs774961122 | c.1919C>T | p.Ser640Leu | p.S640L | O75182 | protein_coding | deleterious(0.02) | benign(0.107) | TCGA-E2-A1IN-01 | Breast | breast invasive carcinoma | Female | <65 | I/II | Hormone Therapy | arimidex | SD |
| SIN3B | SNV | Missense_Mutation | rs753381939 | c.3347N>T | p.Ala1116Val | p.A1116V | O75182 | protein_coding | tolerated(0.2) | benign(0.013) | TCGA-EW-A1P7-01 | Breast | breast invasive carcinoma | Female | <65 | I/II | Chemotherapy | carboplatin | PD |
| SIN3B | SNV | Missense_Mutation | novel | c.2428C>T | p.Arg810Trp | p.R810W | O75182 | protein_coding | deleterious(0.01) | probably_damaging(0.96) | TCGA-OL-A5RZ-01 | Breast | breast invasive carcinoma | Female | <65 | I/II | Chemotherapy | doxorubicin | CR |
| Page: 1 2 3 4 5 6 7 8 9 10 11 |
Top |
Related drugs of malignant transformation related genes |
| Identification of chemicals and drugs interact with genes involved in malignant transfromation |
| (DGIdb 4.0) |
| Entrez ID | Symbol | Category | Interaction Types | Drug Claim Name | Drug Name | PMIDs |
| Page: 1 |

Copyright 2023-Present -The University of Texas Health Science Center at Houston |