| Tissue | Expression Dynamics | Abbreviation |
| Colorectum (GSE201348) |  | FAP: Familial adenomatous polyposis |
| CRC: Colorectal cancer |
| Colorectum (HTA11) | 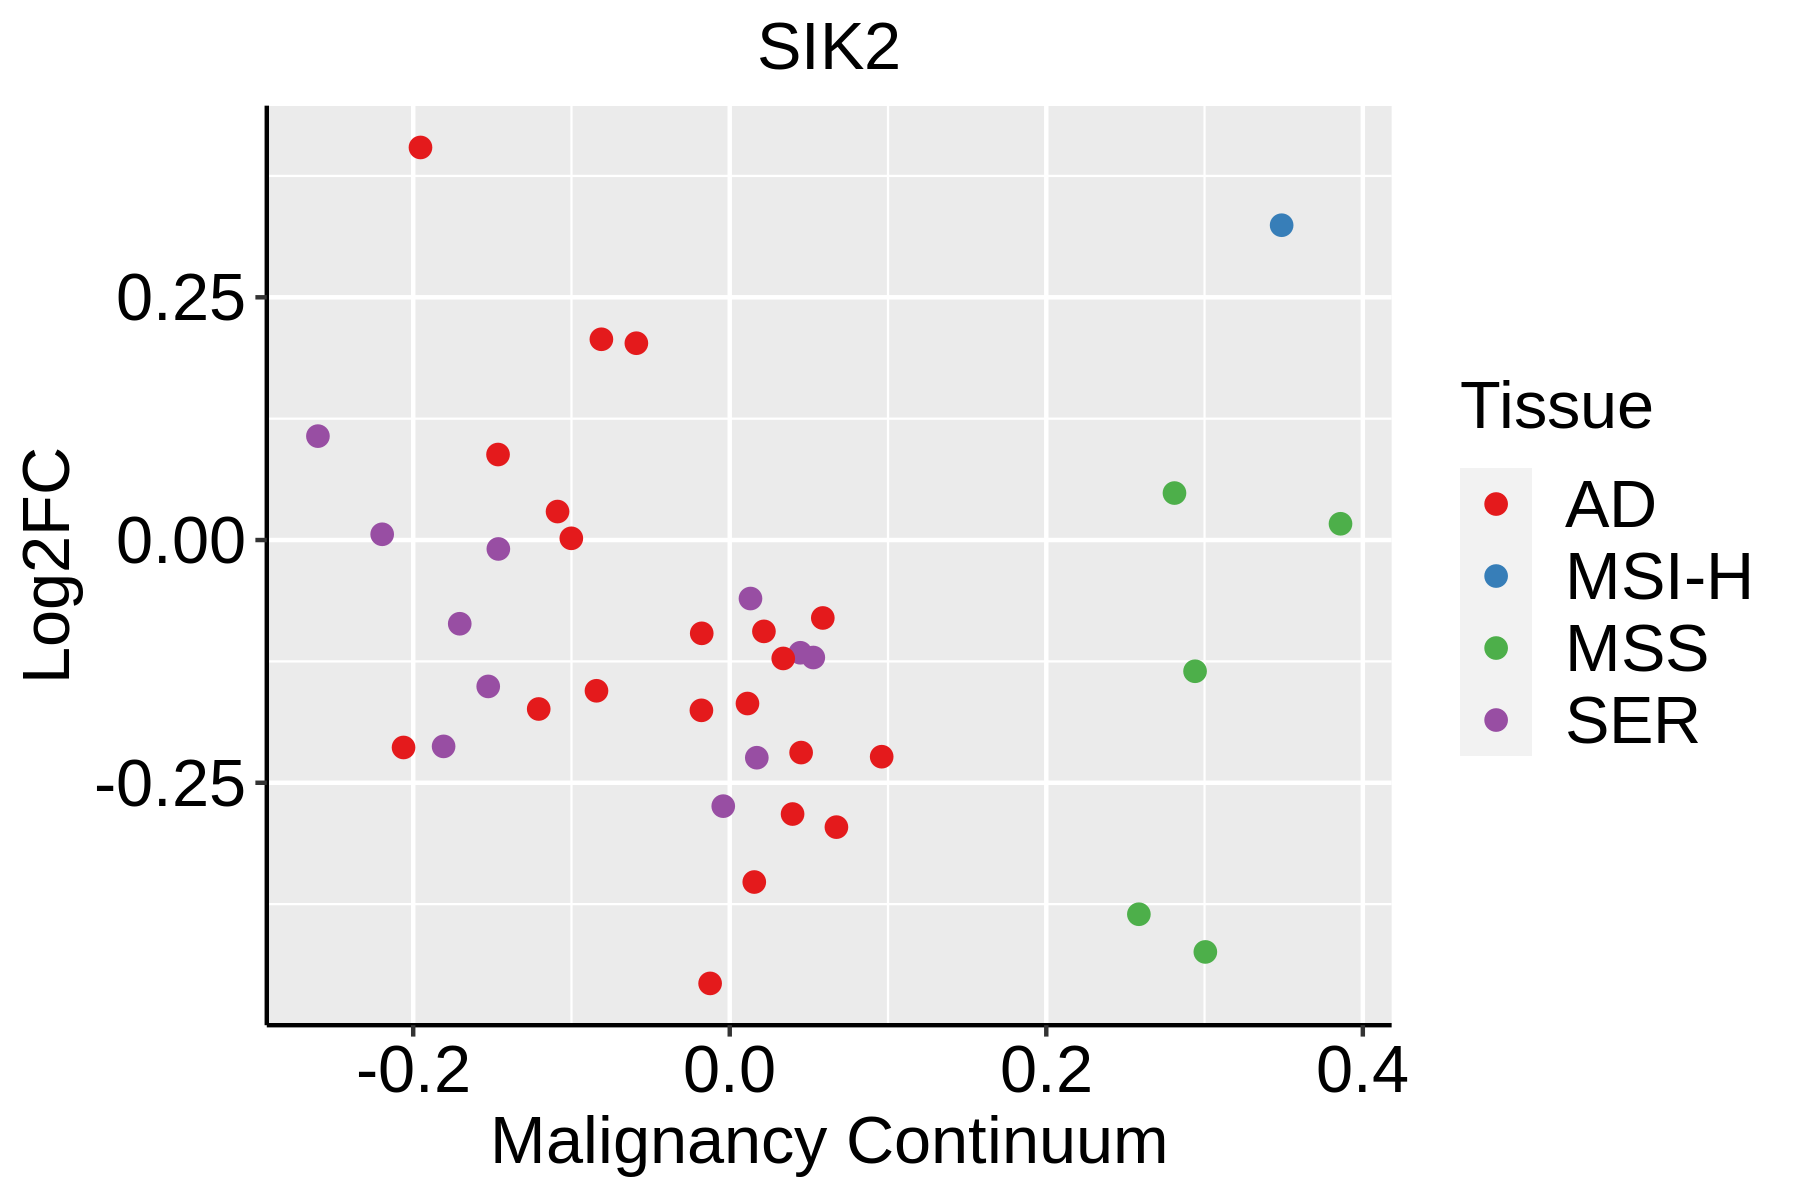 | AD: Adenomas |
| SER: Sessile serrated lesions |
| MSI-H: Microsatellite-high colorectal cancer |
| MSS: Microsatellite stable colorectal cancer |
| Endometrium | 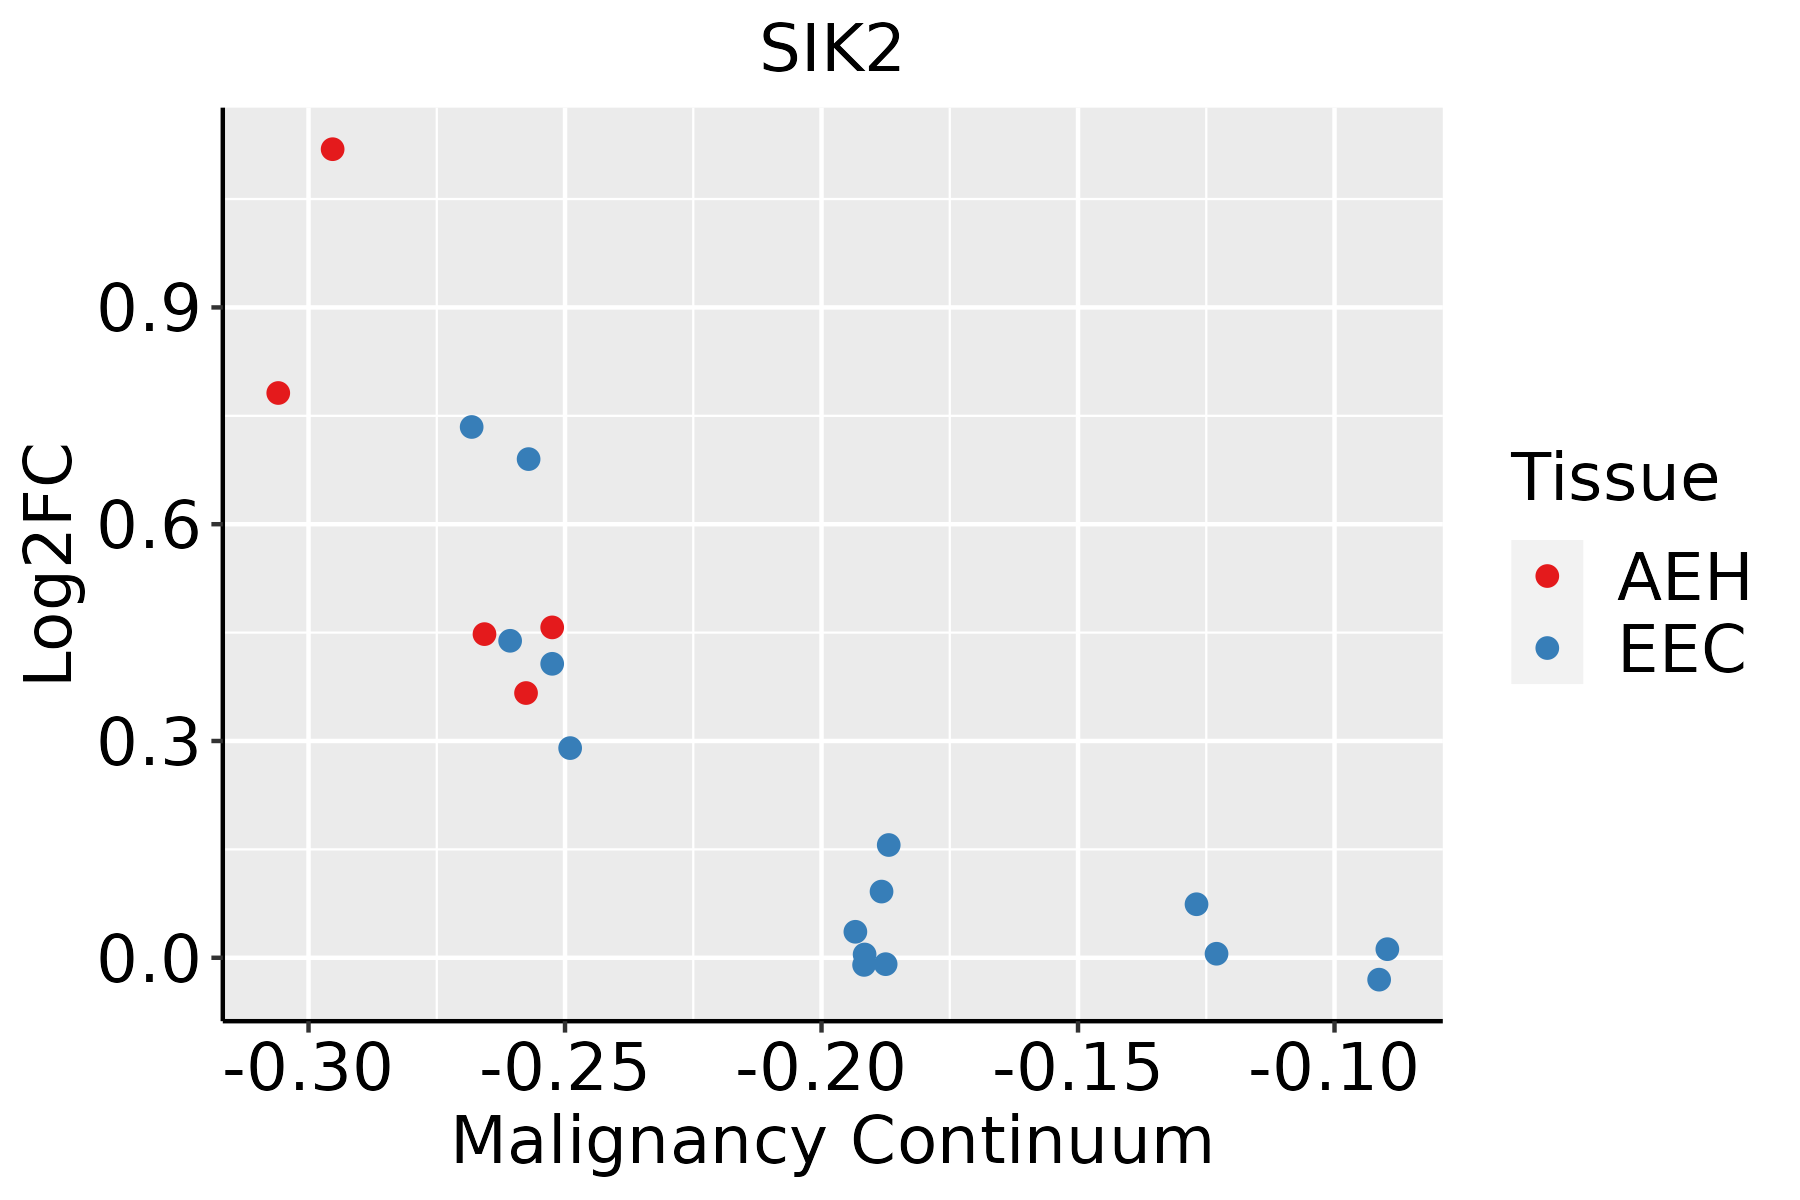 | AEH: Atypical endometrial hyperplasia |
| EEC: Endometrioid Cancer |
| Liver | 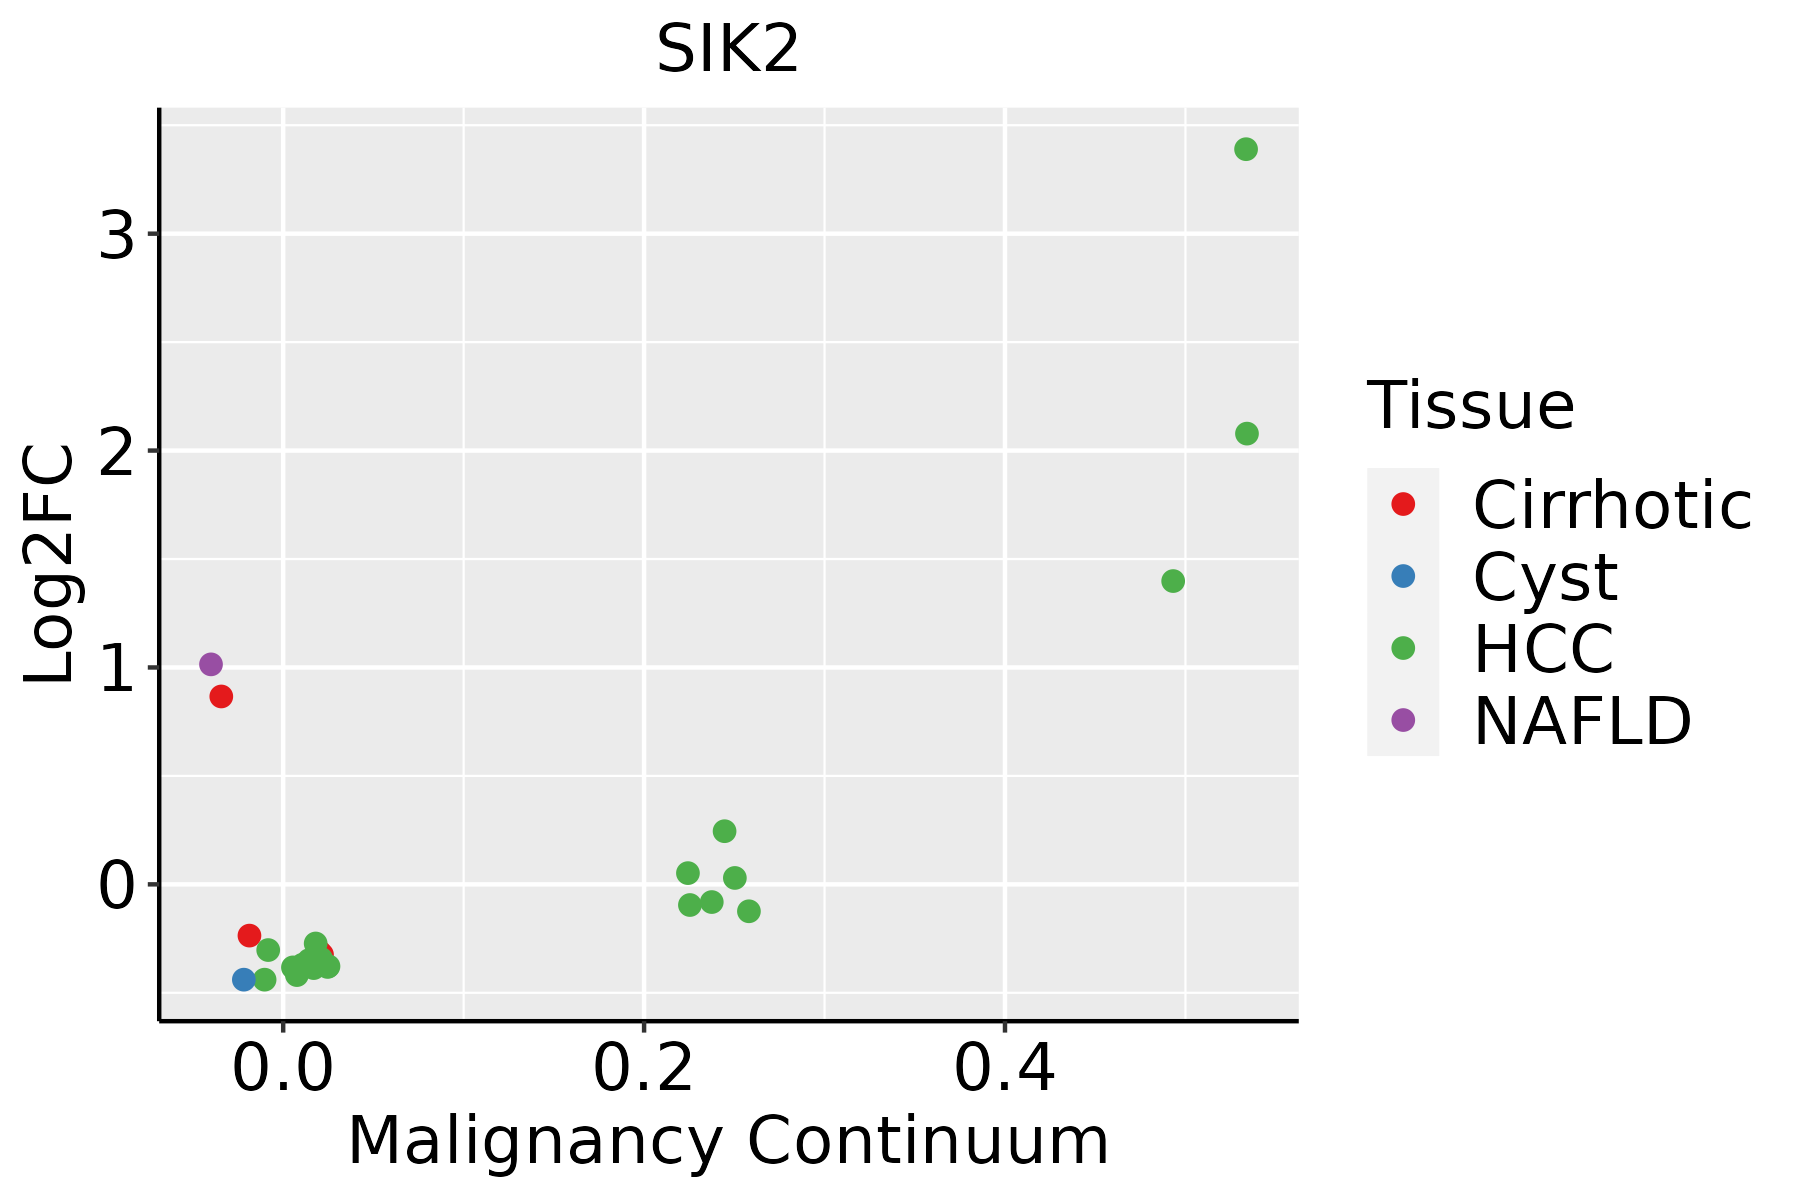 | HCC: Hepatocellular carcinoma |
| NAFLD: Non-alcoholic fatty liver disease |
| Lung |  | AAH: Atypical adenomatous hyperplasia |
| AIS: Adenocarcinoma in situ |
| IAC: Invasive lung adenocarcinoma |
| MIA: Minimally invasive adenocarcinoma |
| GO ID | Tissue | Disease Stage | Description | Gene Ratio | Bg Ratio | pvalue | p.adjust | Count |
| GO:0032868 | Colorectum | AD | response to insulin | 91/3918 | 264/18723 | 2.02e-07 | 8.48e-06 | 91 |
| GO:1901653 | Colorectum | AD | cellular response to peptide | 114/3918 | 359/18723 | 8.32e-07 | 2.88e-05 | 114 |
| GO:0032869 | Colorectum | AD | cellular response to insulin stimulus | 72/3918 | 203/18723 | 1.10e-06 | 3.68e-05 | 72 |
| GO:0071375 | Colorectum | AD | cellular response to peptide hormone stimulus | 95/3918 | 290/18723 | 1.50e-06 | 4.66e-05 | 95 |
| GO:0043434 | Colorectum | AD | response to peptide hormone | 126/3918 | 414/18723 | 2.70e-06 | 7.86e-05 | 126 |
| GO:0031667 | Colorectum | AD | response to nutrient levels | 138/3918 | 474/18723 | 1.22e-05 | 2.68e-04 | 138 |
| GO:0046777 | Colorectum | AD | protein autophosphorylation | 74/3918 | 227/18723 | 2.48e-05 | 4.76e-04 | 74 |
| GO:0042594 | Colorectum | AD | response to starvation | 63/3918 | 197/18723 | 1.77e-04 | 2.38e-03 | 63 |
| GO:0071496 | Colorectum | AD | cellular response to external stimulus | 94/3918 | 320/18723 | 1.98e-04 | 2.64e-03 | 94 |
| GO:0009267 | Colorectum | AD | cellular response to starvation | 51/3918 | 156/18723 | 3.90e-04 | 4.44e-03 | 51 |
| GO:0031668 | Colorectum | AD | cellular response to extracellular stimulus | 71/3918 | 246/18723 | 1.86e-03 | 1.52e-02 | 71 |
| GO:0031669 | Colorectum | AD | cellular response to nutrient levels | 63/3918 | 215/18723 | 2.19e-03 | 1.73e-02 | 63 |
| GO:00316672 | Colorectum | MSS | response to nutrient levels | 125/3467 | 474/18723 | 1.24e-05 | 2.88e-04 | 125 |
| GO:00467772 | Colorectum | MSS | protein autophosphorylation | 63/3467 | 227/18723 | 3.96e-04 | 4.91e-03 | 63 |
| GO:00425942 | Colorectum | MSS | response to starvation | 56/3467 | 197/18723 | 4.25e-04 | 5.21e-03 | 56 |
| GO:00434342 | Colorectum | MSS | response to peptide hormone | 104/3467 | 414/18723 | 4.58e-04 | 5.43e-03 | 104 |
| GO:19016532 | Colorectum | MSS | cellular response to peptide | 91/3467 | 359/18723 | 7.38e-04 | 7.88e-03 | 91 |
| GO:00714962 | Colorectum | MSS | cellular response to external stimulus | 82/3467 | 320/18723 | 9.30e-04 | 9.44e-03 | 82 |
| GO:00328692 | Colorectum | MSS | cellular response to insulin stimulus | 56/3467 | 203/18723 | 9.41e-04 | 9.50e-03 | 56 |
| GO:00713752 | Colorectum | MSS | cellular response to peptide hormone stimulus | 75/3467 | 290/18723 | 1.14e-03 | 1.12e-02 | 75 |
| Pathway ID | Tissue | Disease Stage | Description | Gene Ratio | Bg Ratio | pvalue | p.adjust | qvalue | Count |
| hsa04922 | Colorectum | AD | Glucagon signaling pathway | 41/2092 | 107/8465 | 1.18e-03 | 7.75e-03 | 4.94e-03 | 41 |
| hsa049221 | Colorectum | AD | Glucagon signaling pathway | 41/2092 | 107/8465 | 1.18e-03 | 7.75e-03 | 4.94e-03 | 41 |
| hsa049226 | Colorectum | FAP | Glucagon signaling pathway | 32/1404 | 107/8465 | 4.08e-04 | 3.10e-03 | 1.89e-03 | 32 |
| hsa049227 | Colorectum | FAP | Glucagon signaling pathway | 32/1404 | 107/8465 | 4.08e-04 | 3.10e-03 | 1.89e-03 | 32 |
| hsa049228 | Colorectum | CRC | Glucagon signaling pathway | 24/1091 | 107/8465 | 4.21e-03 | 2.47e-02 | 1.67e-02 | 24 |
| hsa049229 | Colorectum | CRC | Glucagon signaling pathway | 24/1091 | 107/8465 | 4.21e-03 | 2.47e-02 | 1.67e-02 | 24 |
| hsa0492210 | Liver | NAFLD | Glucagon signaling pathway | 24/1043 | 107/8465 | 2.33e-03 | 2.46e-02 | 1.99e-02 | 24 |
| hsa0492211 | Liver | NAFLD | Glucagon signaling pathway | 24/1043 | 107/8465 | 2.33e-03 | 2.46e-02 | 1.99e-02 | 24 |
| hsa0492221 | Liver | Cirrhotic | Glucagon signaling pathway | 43/2530 | 107/8465 | 1.42e-02 | 4.35e-02 | 2.68e-02 | 43 |
| hsa0492231 | Liver | Cirrhotic | Glucagon signaling pathway | 43/2530 | 107/8465 | 1.42e-02 | 4.35e-02 | 2.68e-02 | 43 |
| hsa0492241 | Liver | HCC | Glucagon signaling pathway | 64/4020 | 107/8465 | 6.70e-03 | 1.87e-02 | 1.04e-02 | 64 |
| hsa0492251 | Liver | HCC | Glucagon signaling pathway | 64/4020 | 107/8465 | 6.70e-03 | 1.87e-02 | 1.04e-02 | 64 |
| Hugo Symbol | Variant Class | Variant Classification | dbSNP RS | HGVSc | HGVSp | HGVSp Short | SWISSPROT | BIOTYPE | SIFT | PolyPhen | Tumor Sample Barcode | Tissue | Histology | Sex | Age | Stage | Therapy Types | Drugs | Outcome |
| SIK2 | SNV | Missense_Mutation | | c.1006N>T | p.Arg336Cys | p.R336C | Q9H0K1 | protein_coding | deleterious(0) | probably_damaging(0.997) | TCGA-AO-A0JB-01 | Breast | breast invasive carcinoma | Female | <65 | III/IV | Chemotherapy | cyclophosphamide | SD |
| SIK2 | SNV | Missense_Mutation | | c.2608N>A | p.Asp870Asn | p.D870N | Q9H0K1 | protein_coding | tolerated_low_confidence(0.14) | benign(0.001) | TCGA-D8-A1XW-01 | Breast | breast invasive carcinoma | Female | <65 | I/II | Chemotherapy | adriamycin+cyclophosphamide | SD |
| SIK2 | insertion | Nonsense_Mutation | novel | c.2713_2714insATTCCTTATAGGCAAGTAGCTTT | p.Gly905AspfsTer4 | p.G905Dfs*4 | Q9H0K1 | protein_coding | | | TCGA-A8-A07G-01 | Breast | breast invasive carcinoma | Female | >=65 | I/II | Chemotherapy | 5-fluorouracil | CR |
| SIK2 | insertion | Frame_Shift_Ins | novel | c.2338_2339insAAGATCTAACTCCACCTTTCTCATTG | p.Pro780GlnfsTer107 | p.P780Qfs*107 | Q9H0K1 | protein_coding | | | TCGA-AO-A0JJ-01 | Breast | breast invasive carcinoma | Female | <65 | I/II | Chemotherapy | cyclophospamide | SD |
| SIK2 | insertion | Frame_Shift_Ins | novel | c.2428_2429insACCTGGCTTCTTTCTTT | p.Ala810AspfsTer74 | p.A810Dfs*74 | Q9H0K1 | protein_coding | | | TCGA-BH-A0B8-01 | Breast | breast invasive carcinoma | Female | <65 | I/II | Hormone Therapy | arimidex | SD |
| SIK2 | deletion | Frame_Shift_Del | novel | c.1749delN | p.Arg584AlafsTer13 | p.R584Afs*13 | Q9H0K1 | protein_coding | | | TCGA-D8-A27V-01 | Breast | breast invasive carcinoma | Female | <65 | I/II | Hormone Therapy | tamoxiphen | SD |
| SIK2 | SNV | Missense_Mutation | | c.498N>G | p.Phe166Leu | p.F166L | Q9H0K1 | protein_coding | deleterious(0.04) | possibly_damaging(0.884) | TCGA-DR-A0ZL-01 | Cervix | cervical & endocervical cancer | Female | <65 | I/II | Unknown | Unknown | SD |
| SIK2 | SNV | Missense_Mutation | | c.1879N>A | p.Glu627Lys | p.E627K | Q9H0K1 | protein_coding | tolerated(0.35) | benign(0.014) | TCGA-DR-A0ZM-01 | Cervix | cervical & endocervical cancer | Female | <65 | III/IV | Unspecific | Cisplatin | SD |
| SIK2 | SNV | Missense_Mutation | | c.243A>T | p.Lys81Asn | p.K81N | Q9H0K1 | protein_coding | deleterious(0) | probably_damaging(0.999) | TCGA-EA-A5FO-01 | Cervix | cervical & endocervical cancer | Female | <65 | I/II | Unknown | Unknown | SD |
| SIK2 | SNV | Missense_Mutation | novel | c.820N>A | p.Glu274Lys | p.E274K | Q9H0K1 | protein_coding | deleterious(0.03) | benign(0.277) | TCGA-IR-A3LK-01 | Cervix | cervical & endocervical cancer | Female | >=65 | I/II | Chemotherapy | cisplatin | PD |
| Entrez ID | Symbol | Category | Interaction Types | Drug Claim Name | Drug Name | PMIDs |
| 23235 | SIK2 | SERINE THREONINE KINASE, KINASE, DRUGGABLE GENOME, ENZYME | inhibitor | 340590212 | | |
| 23235 | SIK2 | SERINE THREONINE KINASE, KINASE, DRUGGABLE GENOME, ENZYME | | PF-562271 | PF-00562271 | |
| 23235 | SIK2 | SERINE THREONINE KINASE, KINASE, DRUGGABLE GENOME, ENZYME | inhibitor | 178102336 | BOSUTINIB | |
| 23235 | SIK2 | SERINE THREONINE KINASE, KINASE, DRUGGABLE GENOME, ENZYME | inhibitor | 249565729 | | |
| 23235 | SIK2 | SERINE THREONINE KINASE, KINASE, DRUGGABLE GENOME, ENZYME | | TAMATINIB | R-406 | |
| 23235 | SIK2 | SERINE THREONINE KINASE, KINASE, DRUGGABLE GENOME, ENZYME | | JNJ-7706621 | JNJ-7706621 | |
| 23235 | SIK2 | SERINE THREONINE KINASE, KINASE, DRUGGABLE GENOME, ENZYME | | DASATINIB | DASATINIB | |
| 23235 | SIK2 | SERINE THREONINE KINASE, KINASE, DRUGGABLE GENOME, ENZYME | | DOVITINIB | DOVITINIB | |
| 23235 | SIK2 | SERINE THREONINE KINASE, KINASE, DRUGGABLE GENOME, ENZYME | | GEFITINIB | GEFITINIB | |
| 23235 | SIK2 | SERINE THREONINE KINASE, KINASE, DRUGGABLE GENOME, ENZYME | | SB-203580 | SB-203580 | |


