
|
|||||
|
 | |
| |
| |
| |
| |
| |
|
Gene: SIK1 |
Gene summary for SIK1 |
| Gene information | Species | Human | Gene symbol | SIK1 | Gene ID | 150094 |
| Gene name | salt inducible kinase 1 | |
| Gene Alias | DEE30 | |
| Cytomap | 21q22.3 | |
| Gene Type | protein-coding | GO ID | GO:0000278 | UniProtAcc | P57059 |
Top |
Malignant transformation analysis |
| Identification of the aberrant gene expression in precancerous and cancerous lesions by comparing the gene expression of stem-like cells in diseased tissues with normal stem cells |
| Entrez ID | Symbol | Replicates | Species | Organ | Tissue | Adj P-value | Log2FC | Malignancy |
| 150094 | SIK1 | P5T-E | Human | Esophagus | ESCC | 3.89e-12 | 2.16e-01 | 0.1327 |
| 150094 | SIK1 | P9T-E | Human | Esophagus | ESCC | 1.23e-14 | 3.26e-01 | 0.1131 |
| 150094 | SIK1 | P11T-E | Human | Esophagus | ESCC | 3.66e-11 | 5.38e-01 | 0.1426 |
| 150094 | SIK1 | P12T-E | Human | Esophagus | ESCC | 3.75e-03 | 9.48e-02 | 0.1122 |
| 150094 | SIK1 | P22T-E | Human | Esophagus | ESCC | 8.84e-05 | 1.24e-01 | 0.1236 |
| 150094 | SIK1 | P23T-E | Human | Esophagus | ESCC | 3.88e-04 | 1.49e-01 | 0.108 |
| 150094 | SIK1 | P27T-E | Human | Esophagus | ESCC | 9.20e-06 | 1.28e-01 | 0.1055 |
| 150094 | SIK1 | P30T-E | Human | Esophagus | ESCC | 1.44e-32 | 9.69e-01 | 0.137 |
| 150094 | SIK1 | P36T-E | Human | Esophagus | ESCC | 2.82e-02 | 1.08e-01 | 0.1187 |
| 150094 | SIK1 | P37T-E | Human | Esophagus | ESCC | 3.92e-24 | 4.86e-01 | 0.1371 |
| 150094 | SIK1 | P47T-E | Human | Esophagus | ESCC | 4.12e-11 | 2.86e-01 | 0.1067 |
| 150094 | SIK1 | P49T-E | Human | Esophagus | ESCC | 5.57e-05 | 3.14e-01 | 0.1768 |
| 150094 | SIK1 | P57T-E | Human | Esophagus | ESCC | 7.90e-03 | 9.21e-02 | 0.0926 |
| 150094 | SIK1 | P62T-E | Human | Esophagus | ESCC | 2.13e-09 | 1.99e-01 | 0.1302 |
| 150094 | SIK1 | P65T-E | Human | Esophagus | ESCC | 6.43e-06 | 1.45e-01 | 0.0978 |
| 150094 | SIK1 | P76T-E | Human | Esophagus | ESCC | 2.06e-08 | 1.69e-01 | 0.1207 |
| 150094 | SIK1 | P80T-E | Human | Esophagus | ESCC | 3.16e-03 | 1.31e-01 | 0.155 |
| 150094 | SIK1 | P94T-E | Human | Esophagus | ESCC | 6.05e-03 | 2.95e-01 | 0.0879 |
| 150094 | SIK1 | P126T-E | Human | Esophagus | ESCC | 7.86e-04 | 2.76e-01 | 0.1125 |
| 150094 | SIK1 | P127T-E | Human | Esophagus | ESCC | 3.68e-10 | 2.11e-01 | 0.0826 |
| Page: 1 2 3 |
| Tissue | Expression Dynamics | Abbreviation |
| Esophagus |  | ESCC: Esophageal squamous cell carcinoma |
| HGIN: High-grade intraepithelial neoplasias | ||
| LGIN: Low-grade intraepithelial neoplasias | ||
| GC |  | CAG: Chronic atrophic gastritis |
| CAG with IM: Chronic atrophic gastritis with intestinal metaplasia | ||
| CSG: Chronic superficial gastritis | ||
| GC: Gastric cancer | ||
| SIM: Severe intestinal metaplasia | ||
| WIM: Wild intestinal metaplasia | ||
| Prostate | 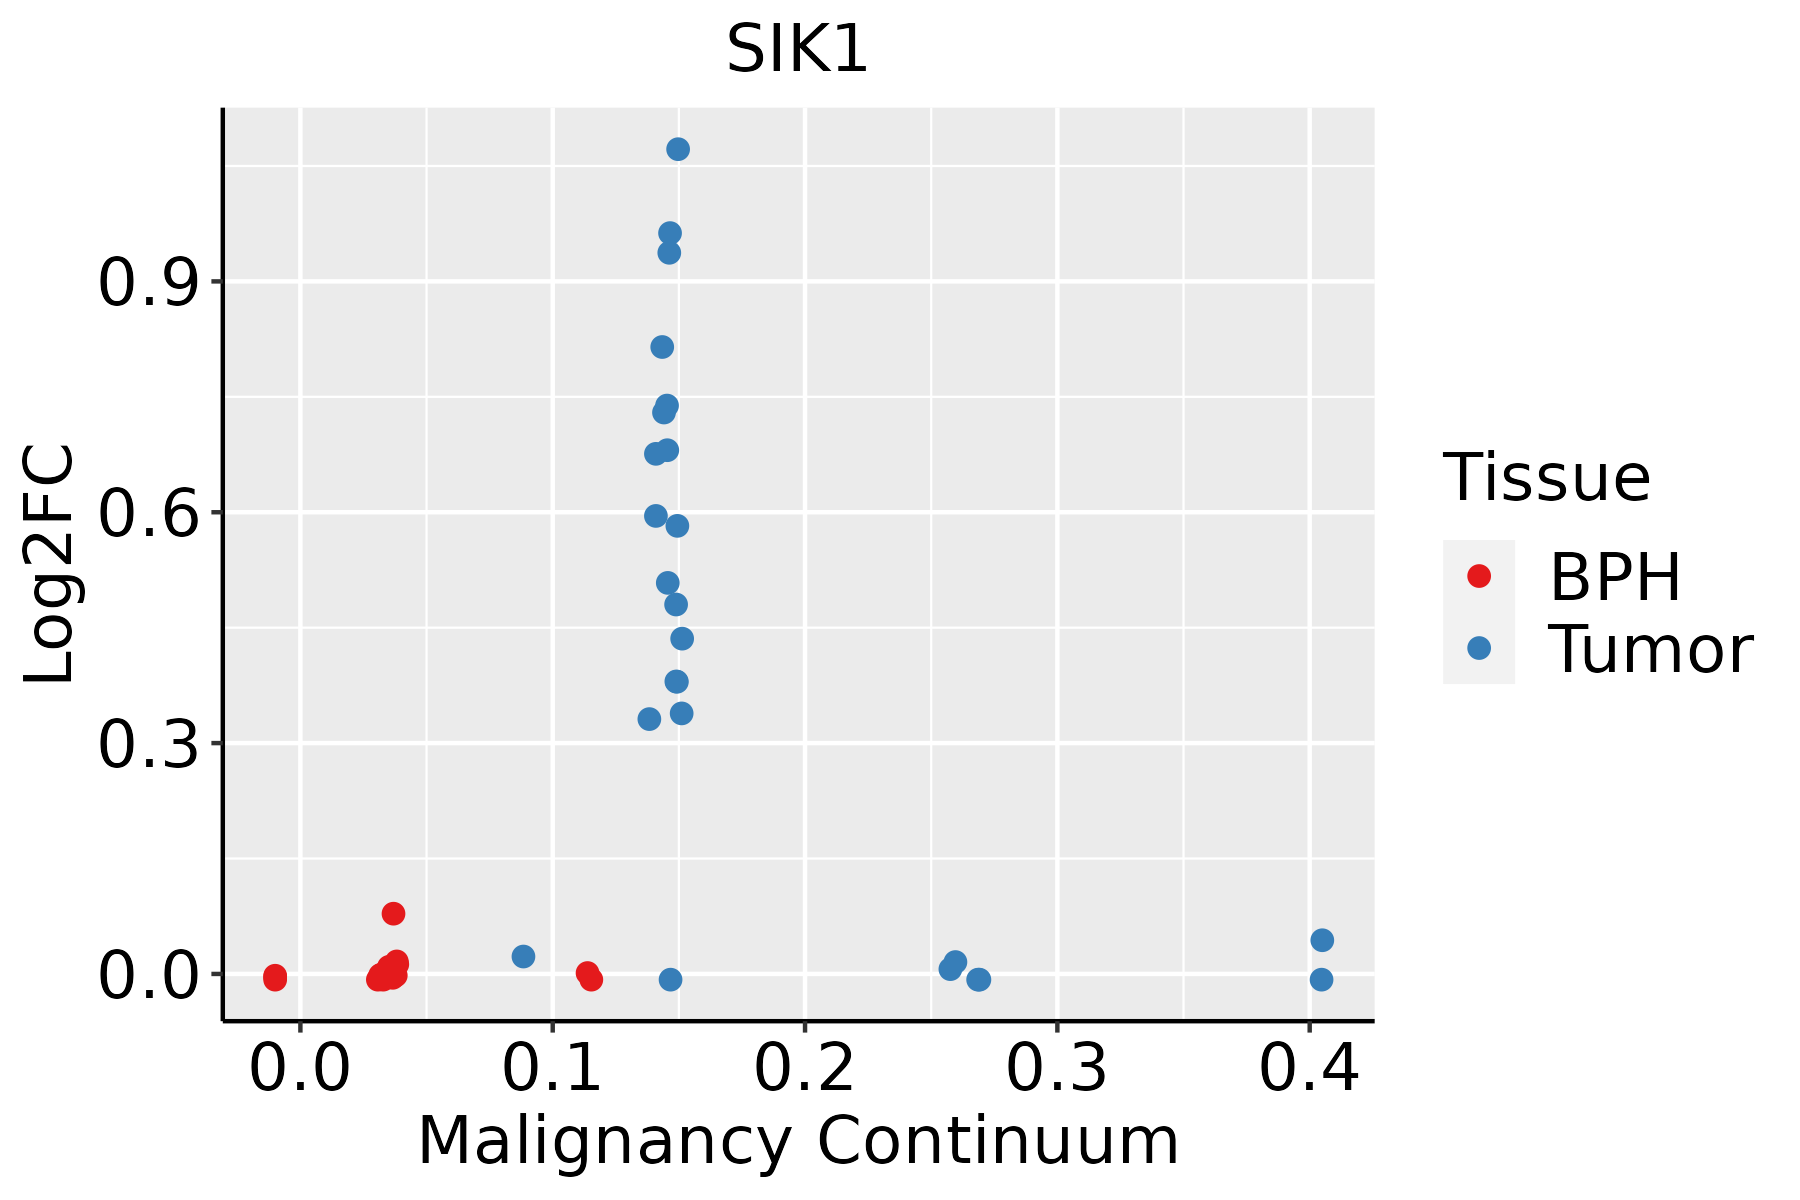 | BPH: Benign Prostatic Hyperplasia |
| Skin | 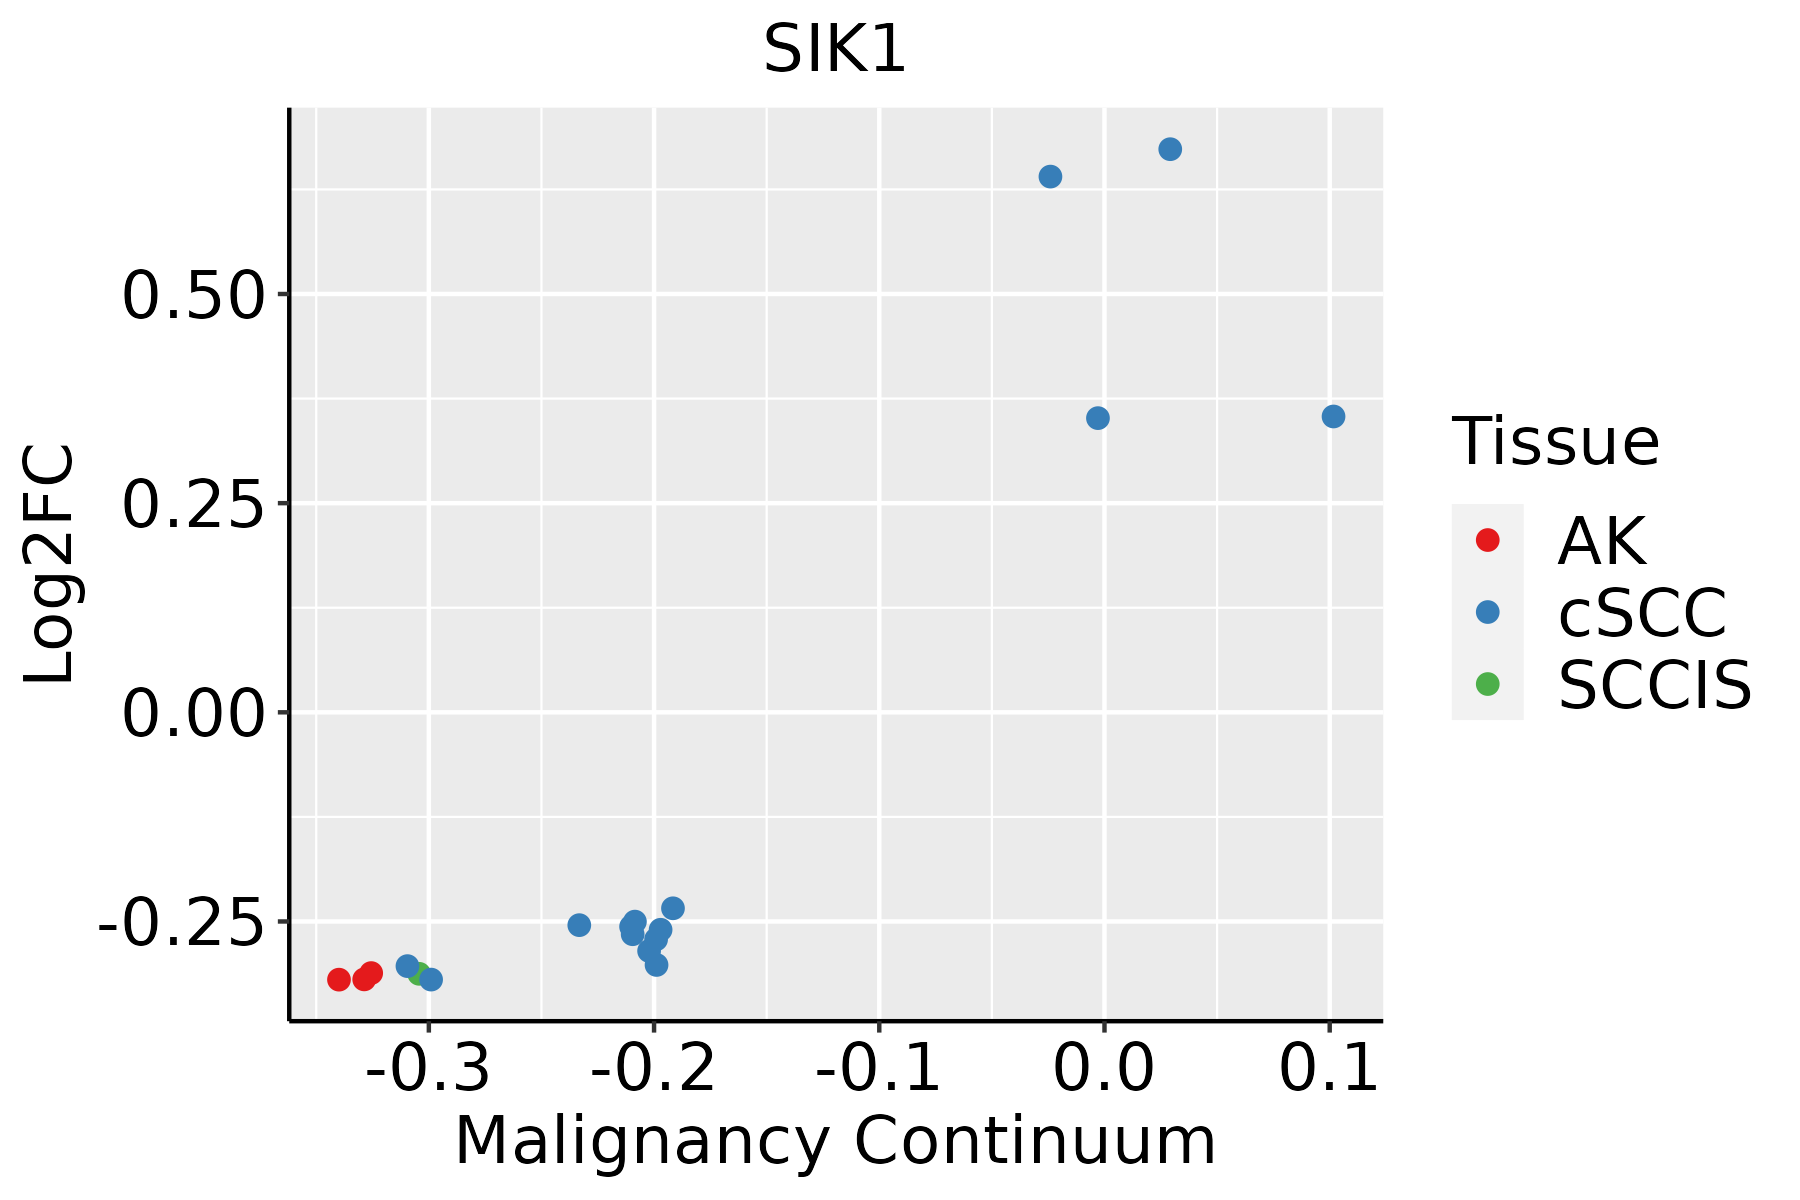 | AK: Actinic keratosis |
| cSCC: Cutaneous squamous cell carcinoma | ||
| SCCIS:squamous cell carcinoma in situ |
| ∗log2FC in expression of this searched gene in stem-like cells from each diseased tissue sample relative to stem-like cells in normal samples in each tissue plotted against the malignancy continuum. Samples are colored based on if they are from different disease stage. |
Top |
Malignant transformation related pathway analysis |
| Find out the enriched GO biological processes and KEGG pathways involved in transition from healthy to precancer to cancer |
| Tissue | Disease Stage | Enriched GO biological Processes |
| Colorectum | AD |  |
| Colorectum | SER |  |
| Colorectum | MSS |  |
| Colorectum | MSI-H |  |
| Colorectum | FAP |  |
| ∗Top 15 enriched GO BP terms are showed in the bar plot of each disease state in each tissue. Each row represents a significant GO biological process which is colored according to the -log10(p.adjust). |
| Page: 1 2 3 4 5 6 7 8 9 |
| GO ID | Tissue | Disease Stage | Description | Gene Ratio | Bg Ratio | pvalue | p.adjust | Count |
| GO:000734615 | Esophagus | ESCC | regulation of mitotic cell cycle | 293/8552 | 457/18723 | 8.00e-16 | 5.64e-14 | 293 |
| GO:0071496111 | Esophagus | ESCC | cellular response to external stimulus | 215/8552 | 320/18723 | 4.29e-15 | 2.43e-13 | 215 |
| GO:0031668111 | Esophagus | ESCC | cellular response to extracellular stimulus | 168/8552 | 246/18723 | 4.93e-13 | 2.23e-11 | 168 |
| GO:0031669110 | Esophagus | ESCC | cellular response to nutrient levels | 148/8552 | 215/18723 | 4.58e-12 | 1.76e-10 | 148 |
| GO:0031667111 | Esophagus | ESCC | response to nutrient levels | 289/8552 | 474/18723 | 9.25e-12 | 3.47e-10 | 289 |
| GO:000931419 | Esophagus | ESCC | response to radiation | 277/8552 | 456/18723 | 4.42e-11 | 1.43e-09 | 277 |
| GO:0009267110 | Esophagus | ESCC | cellular response to starvation | 110/8552 | 156/18723 | 2.63e-10 | 7.37e-09 | 110 |
| GO:004259419 | Esophagus | ESCC | response to starvation | 133/8552 | 197/18723 | 4.31e-10 | 1.14e-08 | 133 |
| GO:00059969 | Esophagus | ESCC | monosaccharide metabolic process | 159/8552 | 257/18723 | 1.11e-07 | 1.81e-06 | 159 |
| GO:00193189 | Esophagus | ESCC | hexose metabolic process | 147/8552 | 237/18723 | 2.63e-07 | 3.94e-06 | 147 |
| GO:00450175 | Esophagus | ESCC | glycerolipid biosynthetic process | 154/8552 | 252/18723 | 5.20e-07 | 6.96e-06 | 154 |
| GO:00510908 | Esophagus | ESCC | regulation of DNA-binding transcription factor activity | 252/8552 | 440/18723 | 5.22e-07 | 6.97e-06 | 252 |
| GO:004677710 | Esophagus | ESCC | protein autophosphorylation | 138/8552 | 227/18723 | 2.98e-06 | 3.38e-05 | 138 |
| GO:00060069 | Esophagus | ESCC | glucose metabolic process | 119/8552 | 196/18723 | 1.51e-05 | 1.36e-04 | 119 |
| GO:000941611 | Esophagus | ESCC | response to light stimulus | 183/8552 | 320/18723 | 2.03e-05 | 1.76e-04 | 183 |
| GO:00421492 | Esophagus | ESCC | cellular response to glucose starvation | 36/8552 | 48/18723 | 3.43e-05 | 2.80e-04 | 36 |
| GO:00442626 | Esophagus | ESCC | cellular carbohydrate metabolic process | 160/8552 | 283/18723 | 1.43e-04 | 9.66e-04 | 160 |
| GO:20002093 | Esophagus | ESCC | regulation of anoikis | 20/8552 | 24/18723 | 1.69e-04 | 1.11e-03 | 20 |
| GO:00432761 | Esophagus | ESCC | anoikis | 26/8552 | 34/18723 | 2.53e-04 | 1.55e-03 | 26 |
| GO:00160514 | Esophagus | ESCC | carbohydrate biosynthetic process | 117/8552 | 202/18723 | 2.96e-04 | 1.79e-03 | 117 |
| Page: 1 2 3 4 5 6 7 8 9 |
| Pathway ID | Tissue | Disease Stage | Description | Gene Ratio | Bg Ratio | pvalue | p.adjust | qvalue | Count |
| Page: 1 |
Top |
Cell-cell communication analysis |
| Identification of potential cell-cell interactions between two cell types and their ligand-receptor pairs for different disease states |
| Ligand | Receptor | LRpair | Pathway | Tissue | Disease Stage |
| Page: 1 |
Top |
Single-cell gene regulatory network inference analysis |
| Find out the significant the regulons (TFs) and the target genes of each regulon across cell types for different disease states |
| TF | Cell Type | Tissue | Disease Stage | Target Gene | RSS | Regulon Activity |
| ∗The dot plots of a searched regulon are shown for all cell subpopulations in each disease state of each tissue based on the regulon specific score inferred using pySCENIC and by calculating the average expression. |
| Page: 1 |
Top |
Somatic mutation of malignant transformation related genes |
| Annotation of somatic variants for genes involved in malignant transformation |
| Hugo Symbol | Variant Class | Variant Classification | dbSNP RS | HGVSc | HGVSp | HGVSp Short | SWISSPROT | BIOTYPE | SIFT | PolyPhen | Tumor Sample Barcode | Tissue | Histology | Sex | Age | Stage | Therapy Types | Drugs | Outcome |
| Page: 1 |
Top |
Related drugs of malignant transformation related genes |
| Identification of chemicals and drugs interact with genes involved in malignant transfromation |
| (DGIdb 4.0) |
| Entrez ID | Symbol | Category | Interaction Types | Drug Claim Name | Drug Name | PMIDs |
| 150094 | SIK1 | KINASE, DRUGGABLE GENOME, ENZYME, SERINE THREONINE KINASE | inhibitor | 249565818 | ||
| 150094 | SIK1 | KINASE, DRUGGABLE GENOME, ENZYME, SERINE THREONINE KINASE | inhibitor | 178102336 | BOSUTINIB | |
| 150094 | SIK1 | KINASE, DRUGGABLE GENOME, ENZYME, SERINE THREONINE KINASE | inhibitor | 249565729 | ||
| 150094 | SIK1 | KINASE, DRUGGABLE GENOME, ENZYME, SERINE THREONINE KINASE | inhibitor | 340590212 | ||
| 150094 | SIK1 | KINASE, DRUGGABLE GENOME, ENZYME, SERINE THREONINE KINASE | inhibitor | 178102305 | DASATINIB |
| Page: 1 |

Copyright 2023-Present -The University of Texas Health Science Center at Houston |