
|
|||||
|
 | |
| |
| |
| |
| |
| |
|
Gene: SIGMAR1 |
Gene summary for SIGMAR1 |
| Gene information | Species | Human | Gene symbol | SIGMAR1 | Gene ID | 10280 |
| Gene name | sigma non-opioid intracellular receptor 1 | |
| Gene Alias | ALS16 | |
| Cytomap | 9p13.3 | |
| Gene Type | protein-coding | GO ID | GO:0000302 | UniProtAcc | B4DR71 |
Top |
Malignant transformation analysis |
| Identification of the aberrant gene expression in precancerous and cancerous lesions by comparing the gene expression of stem-like cells in diseased tissues with normal stem cells |
| Entrez ID | Symbol | Replicates | Species | Organ | Tissue | Adj P-value | Log2FC | Malignancy |
| 10280 | SIGMAR1 | HTA11_3410_2000001011 | Human | Colorectum | AD | 3.56e-12 | 2.46e-01 | 0.0155 |
| 10280 | SIGMAR1 | HTA11_2487_2000001011 | Human | Colorectum | SER | 3.97e-06 | 3.01e-01 | -0.1808 |
| 10280 | SIGMAR1 | HTA11_2951_2000001011 | Human | Colorectum | AD | 1.44e-02 | 3.66e-01 | 0.0216 |
| 10280 | SIGMAR1 | HTA11_1938_2000001011 | Human | Colorectum | AD | 6.03e-12 | 5.21e-01 | -0.0811 |
| 10280 | SIGMAR1 | HTA11_78_2000001011 | Human | Colorectum | AD | 6.49e-06 | 2.04e-01 | -0.1088 |
| 10280 | SIGMAR1 | HTA11_347_2000001011 | Human | Colorectum | AD | 5.31e-16 | 3.53e-01 | -0.1954 |
| 10280 | SIGMAR1 | HTA11_411_2000001011 | Human | Colorectum | SER | 3.52e-08 | 6.95e-01 | -0.2602 |
| 10280 | SIGMAR1 | HTA11_2112_2000001011 | Human | Colorectum | SER | 1.08e-02 | 4.84e-01 | -0.2196 |
| 10280 | SIGMAR1 | HTA11_3361_2000001011 | Human | Colorectum | AD | 7.29e-04 | 3.16e-01 | -0.1207 |
| 10280 | SIGMAR1 | HTA11_83_2000001011 | Human | Colorectum | SER | 1.05e-04 | 3.72e-01 | -0.1526 |
| 10280 | SIGMAR1 | HTA11_696_2000001011 | Human | Colorectum | AD | 7.59e-13 | 4.15e-01 | -0.1464 |
| 10280 | SIGMAR1 | HTA11_866_2000001011 | Human | Colorectum | AD | 2.02e-06 | 2.62e-01 | -0.1001 |
| 10280 | SIGMAR1 | HTA11_1391_2000001011 | Human | Colorectum | AD | 1.41e-19 | 6.79e-01 | -0.059 |
| 10280 | SIGMAR1 | HTA11_2992_2000001011 | Human | Colorectum | SER | 1.22e-03 | 3.77e-01 | -0.1706 |
| 10280 | SIGMAR1 | HTA11_5212_2000001011 | Human | Colorectum | AD | 4.49e-03 | 3.39e-01 | -0.2061 |
| 10280 | SIGMAR1 | HTA11_5216_2000001011 | Human | Colorectum | SER | 2.82e-04 | 3.39e-01 | -0.1462 |
| 10280 | SIGMAR1 | HTA11_546_2000001011 | Human | Colorectum | AD | 3.87e-06 | 2.66e-01 | -0.0842 |
| 10280 | SIGMAR1 | HTA11_7862_2000001011 | Human | Colorectum | AD | 3.30e-09 | 4.44e-01 | -0.0179 |
| 10280 | SIGMAR1 | HTA11_866_3004761011 | Human | Colorectum | AD | 1.99e-25 | 6.17e-01 | 0.096 |
| 10280 | SIGMAR1 | HTA11_4255_2000001011 | Human | Colorectum | SER | 2.52e-05 | 4.91e-01 | 0.0446 |
| Page: 1 2 3 4 5 6 7 8 |
| Tissue | Expression Dynamics | Abbreviation |
| Colorectum (GSE201348) | 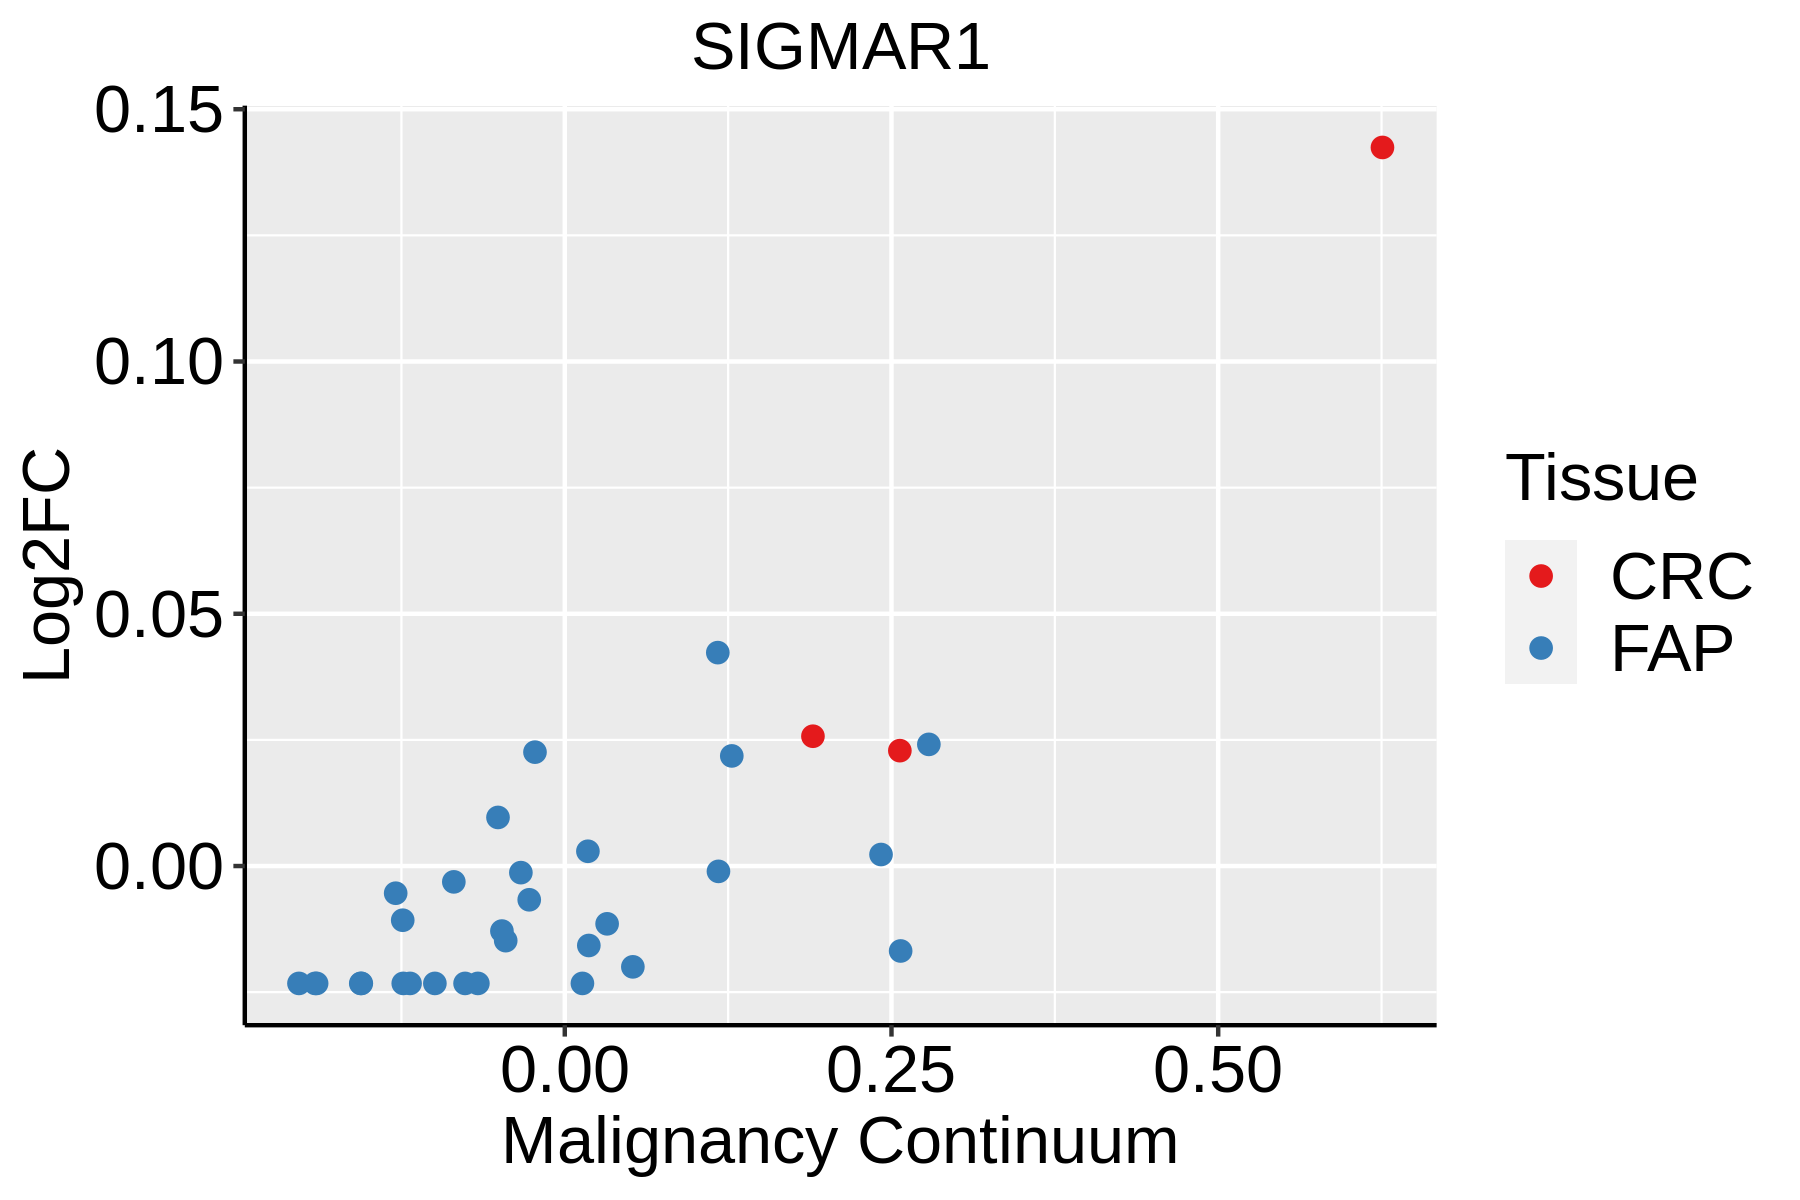 | FAP: Familial adenomatous polyposis |
| CRC: Colorectal cancer | ||
| Colorectum (HTA11) |  | AD: Adenomas |
| SER: Sessile serrated lesions | ||
| MSI-H: Microsatellite-high colorectal cancer | ||
| MSS: Microsatellite stable colorectal cancer | ||
| Esophagus | 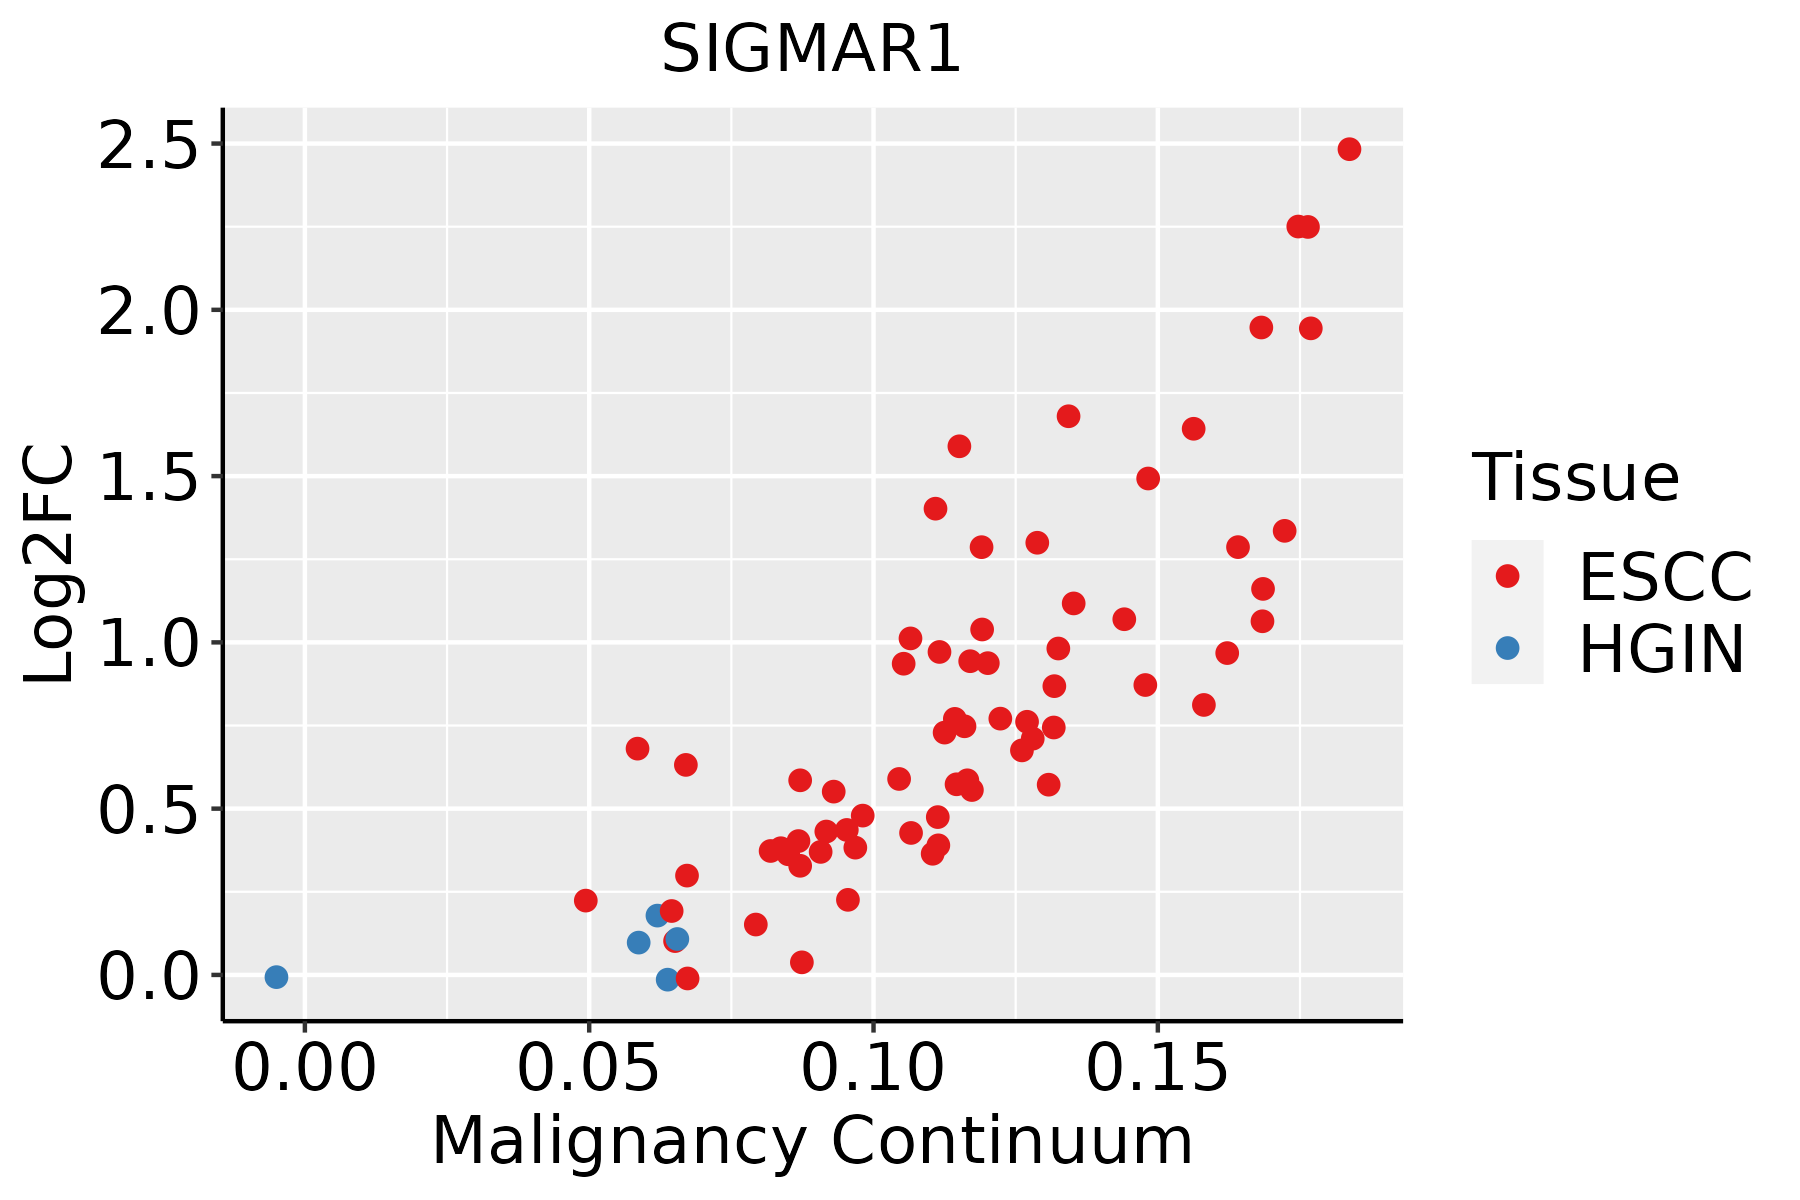 | ESCC: Esophageal squamous cell carcinoma |
| HGIN: High-grade intraepithelial neoplasias | ||
| LGIN: Low-grade intraepithelial neoplasias | ||
| Liver |  | HCC: Hepatocellular carcinoma |
| NAFLD: Non-alcoholic fatty liver disease | ||
| Oral Cavity | 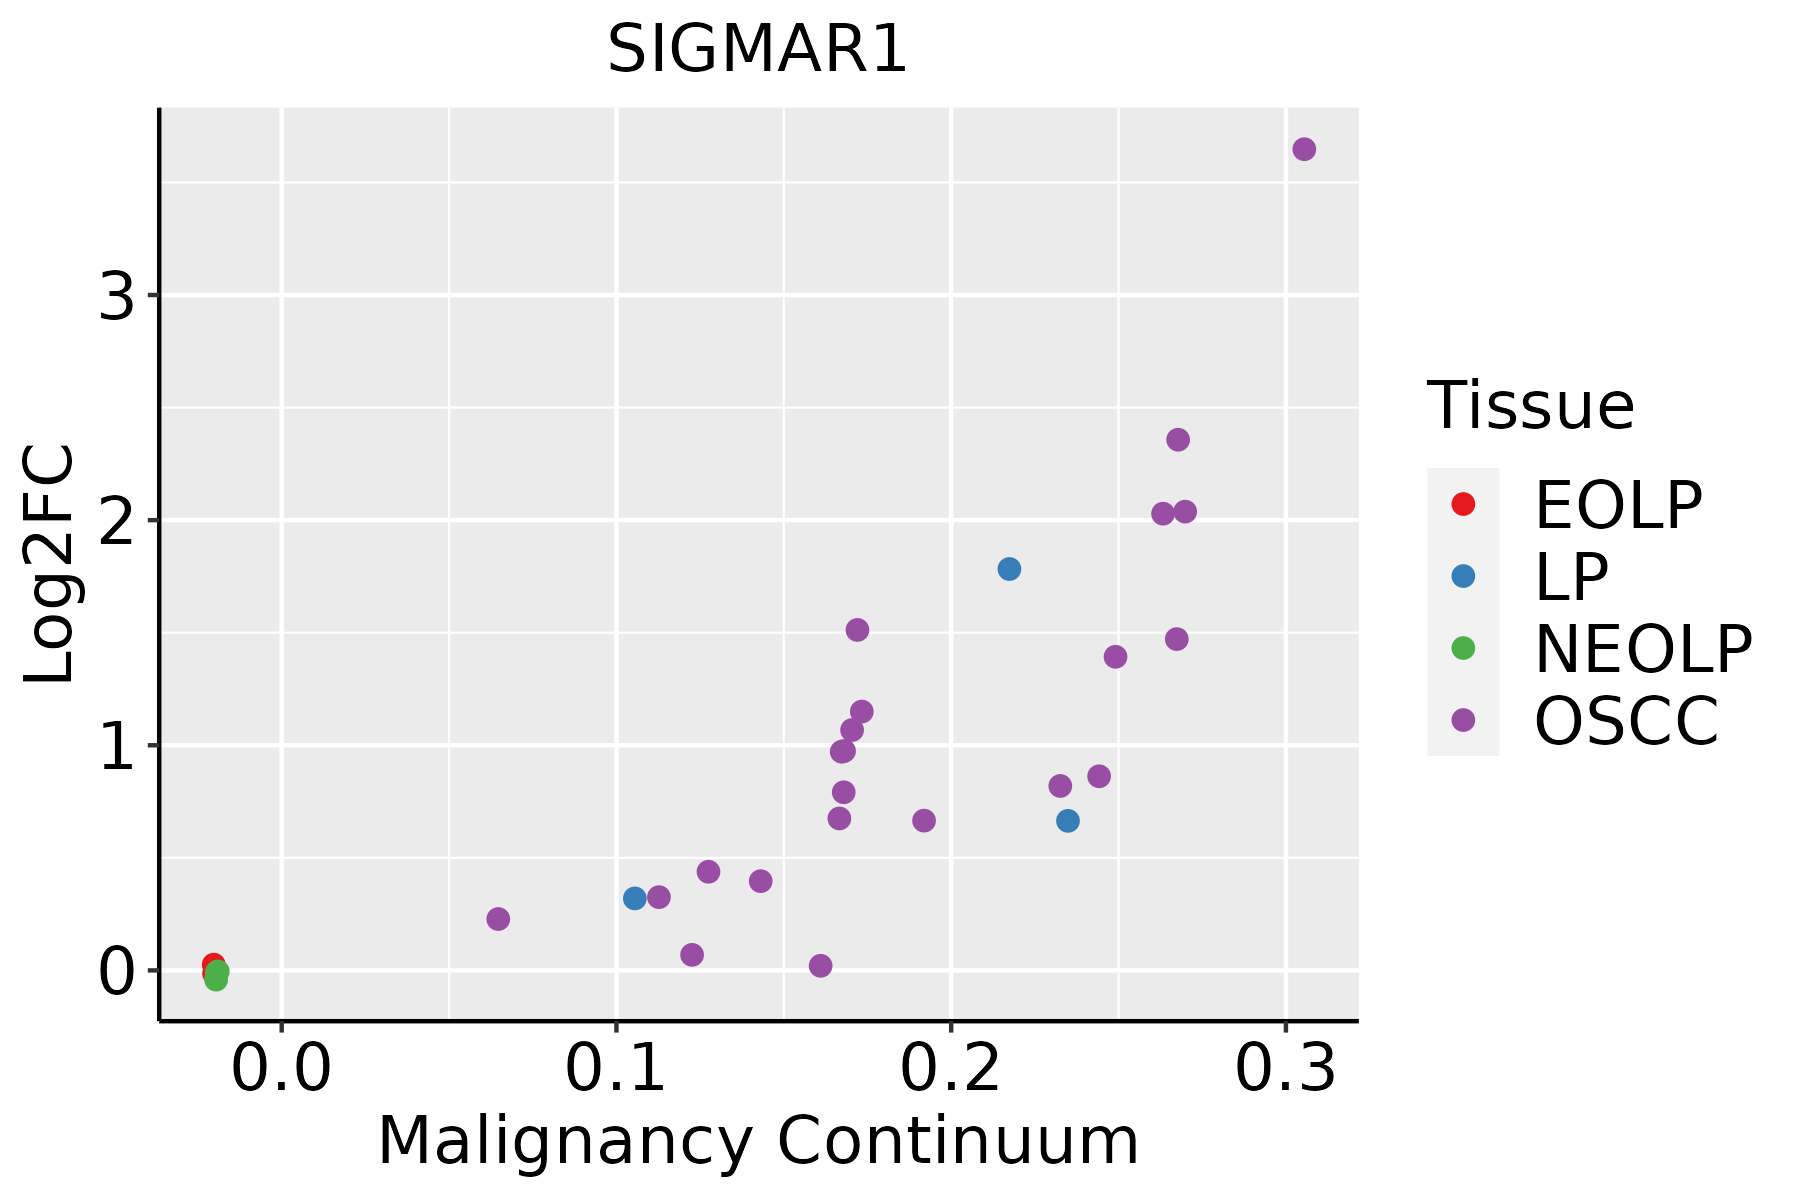 | EOLP: Erosive Oral lichen planus |
| LP: leukoplakia | ||
| NEOLP: Non-erosive oral lichen planus | ||
| OSCC: Oral squamous cell carcinoma | ||
| Skin |  | AK: Actinic keratosis |
| cSCC: Cutaneous squamous cell carcinoma | ||
| SCCIS:squamous cell carcinoma in situ | ||
| Thyroid | 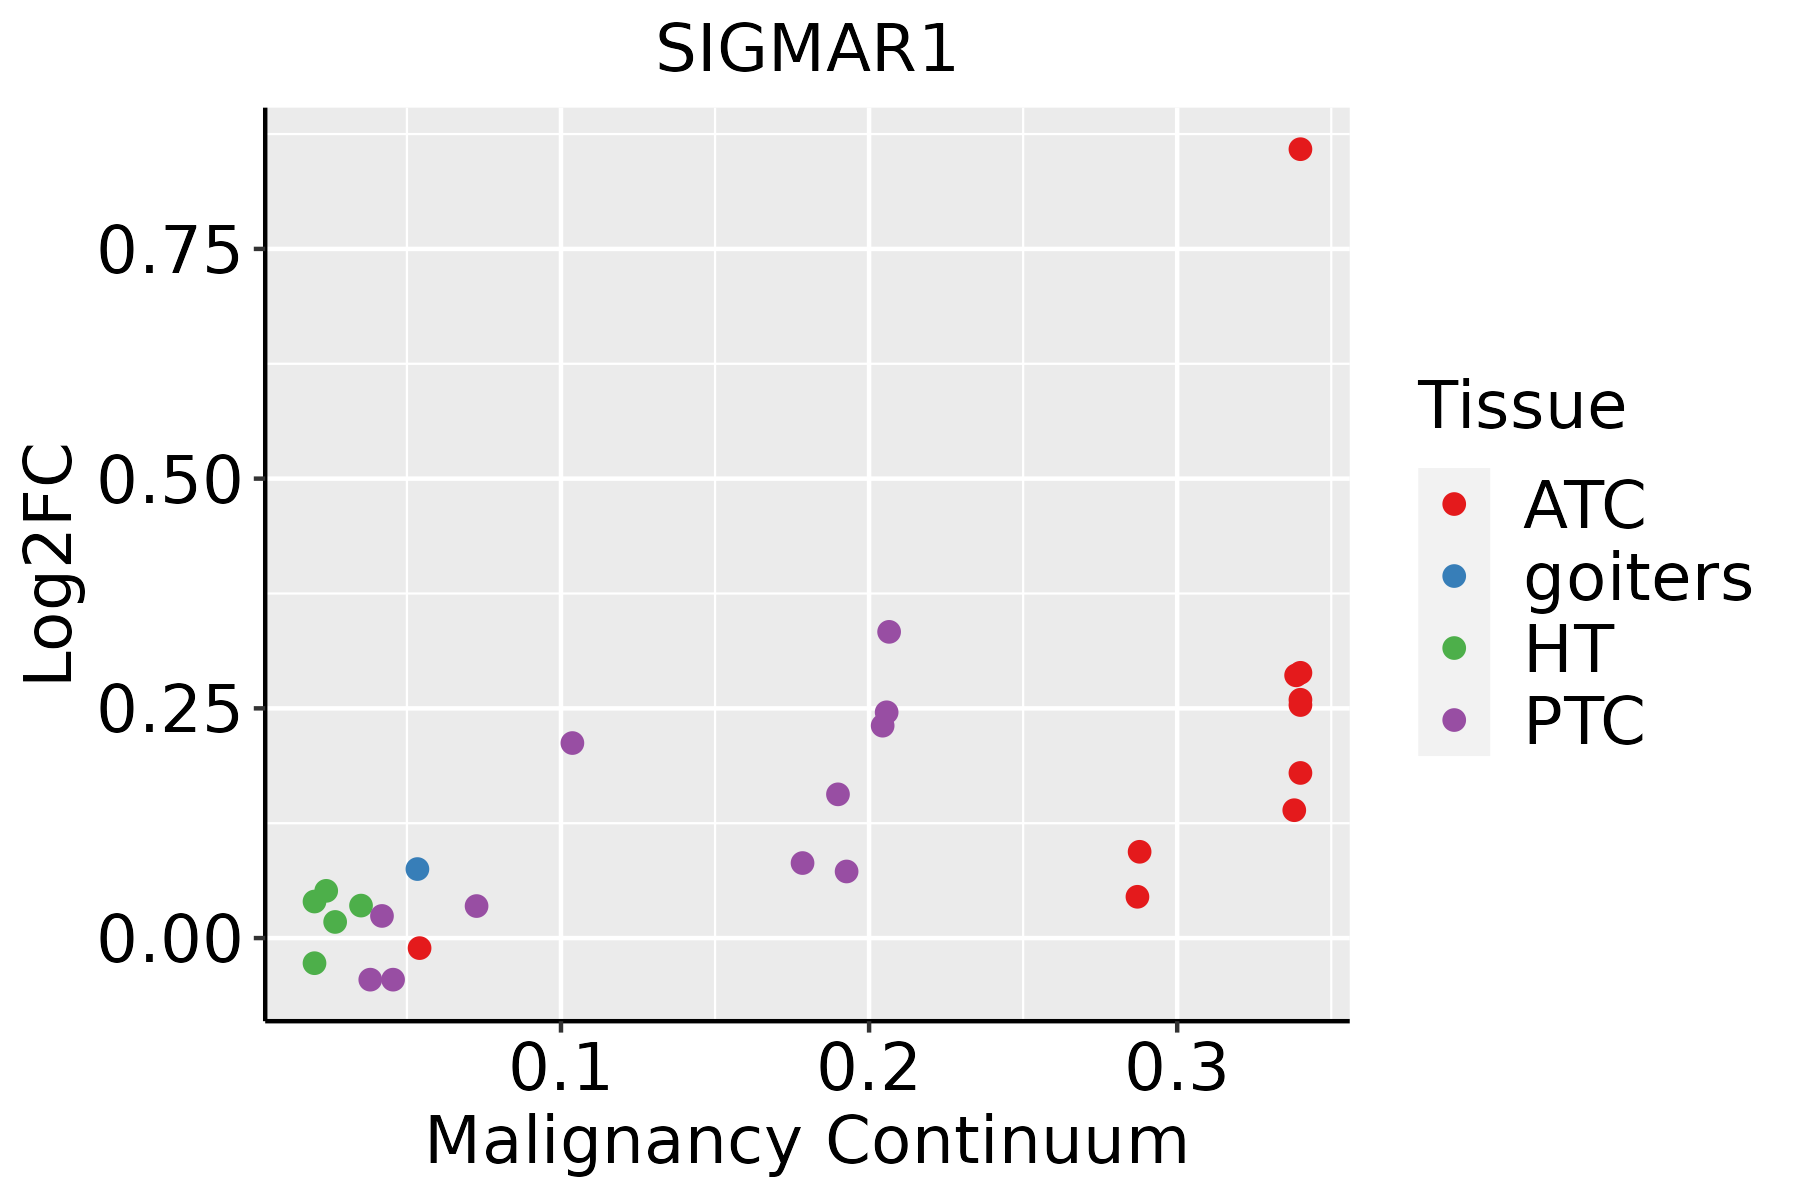 | ATC: Anaplastic thyroid cancer |
| HT: Hashimoto's thyroiditis | ||
| PTC: Papillary thyroid cancer |
| ∗log2FC in expression of this searched gene in stem-like cells from each diseased tissue sample relative to stem-like cells in normal samples in each tissue plotted against the malignancy continuum. Samples are colored based on if they are from different disease stage. |
Top |
Malignant transformation related pathway analysis |
| Find out the enriched GO biological processes and KEGG pathways involved in transition from healthy to precancer to cancer |
| Tissue | Disease Stage | Enriched GO biological Processes |
| Colorectum | AD |  |
| Colorectum | SER |  |
| Colorectum | MSS |  |
| Colorectum | MSI-H |  |
| Colorectum | FAP |  |
| ∗Top 15 enriched GO BP terms are showed in the bar plot of each disease state in each tissue. Each row represents a significant GO biological process which is colored according to the -log10(p.adjust). |
| Page: 1 2 3 4 5 6 7 8 9 |
| GO ID | Tissue | Disease Stage | Description | Gene Ratio | Bg Ratio | pvalue | p.adjust | Count |
| GO:0006979 | Colorectum | AD | response to oxidative stress | 145/3918 | 446/18723 | 5.16e-09 | 3.23e-07 | 145 |
| GO:0062197 | Colorectum | AD | cellular response to chemical stress | 109/3918 | 337/18723 | 5.33e-07 | 1.95e-05 | 109 |
| GO:0000302 | Colorectum | AD | response to reactive oxygen species | 78/3918 | 222/18723 | 6.17e-07 | 2.21e-05 | 78 |
| GO:0070997 | Colorectum | AD | neuron death | 114/3918 | 361/18723 | 1.13e-06 | 3.72e-05 | 114 |
| GO:0034599 | Colorectum | AD | cellular response to oxidative stress | 94/3918 | 288/18723 | 2.03e-06 | 6.02e-05 | 94 |
| GO:1901214 | Colorectum | AD | regulation of neuron death | 99/3918 | 319/18723 | 1.26e-05 | 2.76e-04 | 99 |
| GO:0042542 | Colorectum | AD | response to hydrogen peroxide | 52/3918 | 146/18723 | 2.83e-05 | 5.30e-04 | 52 |
| GO:0051402 | Colorectum | AD | neuron apoptotic process | 77/3918 | 246/18723 | 8.07e-05 | 1.28e-03 | 77 |
| GO:0036473 | Colorectum | AD | cell death in response to oxidative stress | 35/3918 | 95/18723 | 2.58e-04 | 3.24e-03 | 35 |
| GO:0034614 | Colorectum | AD | cellular response to reactive oxygen species | 50/3918 | 155/18723 | 6.25e-04 | 6.49e-03 | 50 |
| GO:0043523 | Colorectum | AD | regulation of neuron apoptotic process | 64/3918 | 212/18723 | 8.95e-04 | 8.63e-03 | 64 |
| GO:0010876 | Colorectum | AD | lipid localization | 120/3918 | 448/18723 | 1.59e-03 | 1.33e-02 | 120 |
| GO:0006869 | Colorectum | AD | lipid transport | 108/3918 | 398/18723 | 1.67e-03 | 1.39e-02 | 108 |
| GO:00069791 | Colorectum | SER | response to oxidative stress | 114/2897 | 446/18723 | 1.75e-08 | 1.28e-06 | 114 |
| GO:00003021 | Colorectum | SER | response to reactive oxygen species | 65/2897 | 222/18723 | 1.21e-07 | 7.29e-06 | 65 |
| GO:00621971 | Colorectum | SER | cellular response to chemical stress | 87/2897 | 337/18723 | 5.33e-07 | 2.59e-05 | 87 |
| GO:00345991 | Colorectum | SER | cellular response to oxidative stress | 73/2897 | 288/18723 | 8.52e-06 | 2.86e-04 | 73 |
| GO:00425421 | Colorectum | SER | response to hydrogen peroxide | 42/2897 | 146/18723 | 3.10e-05 | 8.27e-04 | 42 |
| GO:00709971 | Colorectum | SER | neuron death | 84/2897 | 361/18723 | 5.76e-05 | 1.35e-03 | 84 |
| GO:00514021 | Colorectum | SER | neuron apoptotic process | 60/2897 | 246/18723 | 1.65e-04 | 3.13e-03 | 60 |
| Page: 1 2 3 4 5 6 7 8 |
| Pathway ID | Tissue | Disease Stage | Description | Gene Ratio | Bg Ratio | pvalue | p.adjust | qvalue | Count |
| hsa05014 | Colorectum | AD | Amyotrophic lateral sclerosis | 164/2092 | 364/8465 | 4.28e-18 | 1.27e-16 | 8.09e-17 | 164 |
| hsa05022 | Colorectum | AD | Pathways of neurodegeneration - multiple diseases | 201/2092 | 476/8465 | 4.54e-18 | 1.27e-16 | 8.09e-17 | 201 |
| hsa050141 | Colorectum | AD | Amyotrophic lateral sclerosis | 164/2092 | 364/8465 | 4.28e-18 | 1.27e-16 | 8.09e-17 | 164 |
| hsa050221 | Colorectum | AD | Pathways of neurodegeneration - multiple diseases | 201/2092 | 476/8465 | 4.54e-18 | 1.27e-16 | 8.09e-17 | 201 |
| hsa050222 | Colorectum | SER | Pathways of neurodegeneration - multiple diseases | 168/1580 | 476/8465 | 6.23e-19 | 2.07e-17 | 1.50e-17 | 168 |
| hsa050142 | Colorectum | SER | Amyotrophic lateral sclerosis | 138/1580 | 364/8465 | 9.89e-19 | 2.99e-17 | 2.17e-17 | 138 |
| hsa050223 | Colorectum | SER | Pathways of neurodegeneration - multiple diseases | 168/1580 | 476/8465 | 6.23e-19 | 2.07e-17 | 1.50e-17 | 168 |
| hsa050143 | Colorectum | SER | Amyotrophic lateral sclerosis | 138/1580 | 364/8465 | 9.89e-19 | 2.99e-17 | 2.17e-17 | 138 |
| hsa050224 | Colorectum | MSS | Pathways of neurodegeneration - multiple diseases | 192/1875 | 476/8465 | 2.79e-20 | 1.04e-18 | 6.36e-19 | 192 |
| hsa050144 | Colorectum | MSS | Amyotrophic lateral sclerosis | 156/1875 | 364/8465 | 1.43e-19 | 4.62e-18 | 2.83e-18 | 156 |
| hsa050225 | Colorectum | MSS | Pathways of neurodegeneration - multiple diseases | 192/1875 | 476/8465 | 2.79e-20 | 1.04e-18 | 6.36e-19 | 192 |
| hsa050145 | Colorectum | MSS | Amyotrophic lateral sclerosis | 156/1875 | 364/8465 | 1.43e-19 | 4.62e-18 | 2.83e-18 | 156 |
| hsa050146 | Colorectum | MSI-H | Amyotrophic lateral sclerosis | 95/797 | 364/8465 | 2.31e-21 | 1.50e-19 | 1.26e-19 | 95 |
| hsa050226 | Colorectum | MSI-H | Pathways of neurodegeneration - multiple diseases | 107/797 | 476/8465 | 1.24e-18 | 5.72e-17 | 4.80e-17 | 107 |
| hsa050147 | Colorectum | MSI-H | Amyotrophic lateral sclerosis | 95/797 | 364/8465 | 2.31e-21 | 1.50e-19 | 1.26e-19 | 95 |
| hsa050227 | Colorectum | MSI-H | Pathways of neurodegeneration - multiple diseases | 107/797 | 476/8465 | 1.24e-18 | 5.72e-17 | 4.80e-17 | 107 |
| hsa05014210 | Esophagus | ESCC | Amyotrophic lateral sclerosis | 266/4205 | 364/8465 | 1.31e-20 | 2.20e-18 | 1.13e-18 | 266 |
| hsa05022210 | Esophagus | ESCC | Pathways of neurodegeneration - multiple diseases | 318/4205 | 476/8465 | 6.10e-15 | 2.04e-13 | 1.05e-13 | 318 |
| hsa0501438 | Esophagus | ESCC | Amyotrophic lateral sclerosis | 266/4205 | 364/8465 | 1.31e-20 | 2.20e-18 | 1.13e-18 | 266 |
| hsa0502238 | Esophagus | ESCC | Pathways of neurodegeneration - multiple diseases | 318/4205 | 476/8465 | 6.10e-15 | 2.04e-13 | 1.05e-13 | 318 |
| Page: 1 2 |
Top |
Cell-cell communication analysis |
| Identification of potential cell-cell interactions between two cell types and their ligand-receptor pairs for different disease states |
| Ligand | Receptor | LRpair | Pathway | Tissue | Disease Stage |
| Page: 1 |
Top |
Single-cell gene regulatory network inference analysis |
| Find out the significant the regulons (TFs) and the target genes of each regulon across cell types for different disease states |
| TF | Cell Type | Tissue | Disease Stage | Target Gene | RSS | Regulon Activity |
| ∗The dot plots of a searched regulon are shown for all cell subpopulations in each disease state of each tissue based on the regulon specific score inferred using pySCENIC and by calculating the average expression. |
| Page: 1 |
Top |
Somatic mutation of malignant transformation related genes |
| Annotation of somatic variants for genes involved in malignant transformation |
| Hugo Symbol | Variant Class | Variant Classification | dbSNP RS | HGVSc | HGVSp | HGVSp Short | SWISSPROT | BIOTYPE | SIFT | PolyPhen | Tumor Sample Barcode | Tissue | Histology | Sex | Age | Stage | Therapy Types | Drugs | Outcome |
| SIGMAR1 | SNV | Missense_Mutation | rs376256711 | c.524N>A | p.Arg175Gln | p.R175Q | Q99720 | protein_coding | tolerated(0.06) | possibly_damaging(0.799) | TCGA-E2-A15R-01 | Breast | breast invasive carcinoma | Female | <65 | I/II | Chemotherapy | cyclophosphamide | SD |
| SIGMAR1 | SNV | Missense_Mutation | c.338N>G | p.Ser113Cys | p.S113C | Q99720 | protein_coding | deleterious(0) | probably_damaging(0.935) | TCGA-C5-A1MK-01 | Cervix | cervical & endocervical cancer | Female | >=65 | III/IV | Chemotherapy | carboplatin | PD | |
| SIGMAR1 | SNV | Missense_Mutation | novel | c.121N>C | p.Glu41Gln | p.E41Q | Q99720 | protein_coding | tolerated(0.3) | possibly_damaging(0.611) | TCGA-MA-AA41-01 | Cervix | cervical & endocervical cancer | Female | <65 | I/II | Unknown | Unknown | SD |
| SIGMAR1 | SNV | Missense_Mutation | novel | c.118N>A | p.Glu40Lys | p.E40K | Q99720 | protein_coding | tolerated(0.22) | benign(0.01) | TCGA-VS-A9U7-01 | Cervix | cervical & endocervical cancer | Female | <65 | I/II | Chemotherapy | cisplatin | CR |
| SIGMAR1 | SNV | Missense_Mutation | novel | c.355C>T | p.Arg119Cys | p.R119C | Q99720 | protein_coding | deleterious(0.01) | benign(0.288) | TCGA-A6-2686-01 | Colorectum | colon adenocarcinoma | Female | >=65 | I/II | Unknown | Unknown | SD |
| SIGMAR1 | SNV | Missense_Mutation | rs755288111 | c.562N>A | p.Asp188Asn | p.D188N | Q99720 | protein_coding | deleterious(0.01) | probably_damaging(0.944) | TCGA-AA-3949-01 | Colorectum | colon adenocarcinoma | Female | >=65 | III/IV | Unknown | Unknown | SD |
| SIGMAR1 | SNV | Missense_Mutation | c.628N>T | p.Leu210Phe | p.L210F | Q99720 | protein_coding | tolerated(0.12) | probably_damaging(0.951) | TCGA-AA-A01K-01 | Colorectum | colon adenocarcinoma | Female | >=65 | III/IV | Chemotherapy | folinic | CR | |
| SIGMAR1 | SNV | Missense_Mutation | c.626N>A | p.Gly209Asp | p.G209D | Q99720 | protein_coding | deleterious(0.01) | possibly_damaging(0.499) | TCGA-AD-6964-01 | Colorectum | colon adenocarcinoma | Male | <65 | III/IV | Chemotherapy | folfox | PD | |
| SIGMAR1 | SNV | Missense_Mutation | rs149409262 | c.529N>A | p.Val177Ile | p.V177I | Q99720 | protein_coding | tolerated(0.08) | benign(0.081) | TCGA-AJ-A3BG-01 | Endometrium | uterine corpus endometrioid carcinoma | Female | >=65 | I/II | Chemotherapy | carboplatin | PD |
| SIGMAR1 | SNV | Missense_Mutation | rs777650644 | c.553N>A | p.Ala185Thr | p.A185T | Q99720 | protein_coding | tolerated(0.08) | benign(0.164) | TCGA-AX-A0IZ-01 | Endometrium | uterine corpus endometrioid carcinoma | Female | <65 | I/II | Unknown | Unknown | SD |
| Page: 1 2 |
Top |
Related drugs of malignant transformation related genes |
| Identification of chemicals and drugs interact with genes involved in malignant transfromation |
| (DGIdb 4.0) |
| Entrez ID | Symbol | Category | Interaction Types | Drug Claim Name | Drug Name | PMIDs |
| 10280 | SIGMAR1 | DRUGGABLE GENOME, ION CHANNEL | antagonist | 178103764 | FLUVOXAMINE | |
| 10280 | SIGMAR1 | DRUGGABLE GENOME, ION CHANNEL | SSR-125329A | |||
| 10280 | SIGMAR1 | DRUGGABLE GENOME, ION CHANNEL | OPC-14523 | |||
| 10280 | SIGMAR1 | DRUGGABLE GENOME, ION CHANNEL | (+)-[3H]-PENTAZOCINE | CHEMBL2311194 | 22853801 | |
| 10280 | SIGMAR1 | DRUGGABLE GENOME, ION CHANNEL | Isoindoline derivative 1 | |||
| 10280 | SIGMAR1 | DRUGGABLE GENOME, ION CHANNEL | Isoindoline derivative 2 | |||
| 10280 | SIGMAR1 | DRUGGABLE GENOME, ION CHANNEL | SSR-125047 | |||
| 10280 | SIGMAR1 | DRUGGABLE GENOME, ION CHANNEL | antagonist | 385612191 | ||
| 10280 | SIGMAR1 | DRUGGABLE GENOME, ION CHANNEL | ANAVEX 2-73 | |||
| 10280 | SIGMAR1 | DRUGGABLE GENOME, ION CHANNEL | Benzamide derivative 11 |
| Page: 1 2 3 4 5 6 7 |

Copyright 2023-Present -The University of Texas Health Science Center at Houston |