
|
|||||
|
 | |
| |
| |
| |
| |
| |
|
Gene: SIDT2 |
Gene summary for SIDT2 |
| Gene information | Species | Human | Gene symbol | SIDT2 | Gene ID | 51092 |
| Gene name | SID1 transmembrane family member 2 | |
| Gene Alias | CGI-40 | |
| Cytomap | 11q23.3 | |
| Gene Type | protein-coding | GO ID | GO:0000902 | UniProtAcc | Q8NBJ9 |
Top |
Malignant transformation analysis |
| Identification of the aberrant gene expression in precancerous and cancerous lesions by comparing the gene expression of stem-like cells in diseased tissues with normal stem cells |
| Entrez ID | Symbol | Replicates | Species | Organ | Tissue | Adj P-value | Log2FC | Malignancy |
| 51092 | SIDT2 | HTA11_78_2000001011 | Human | Colorectum | AD | 6.85e-03 | 1.98e-01 | -0.1088 |
| 51092 | SIDT2 | HTA11_347_2000001011 | Human | Colorectum | AD | 1.59e-09 | 2.90e-01 | -0.1954 |
| 51092 | SIDT2 | HTA11_3361_2000001011 | Human | Colorectum | AD | 7.51e-07 | 4.07e-01 | -0.1207 |
| 51092 | SIDT2 | HTA11_696_2000001011 | Human | Colorectum | AD | 2.67e-07 | 3.71e-01 | -0.1464 |
| 51092 | SIDT2 | HTA11_866_2000001011 | Human | Colorectum | AD | 2.19e-02 | 2.37e-01 | -0.1001 |
| 51092 | SIDT2 | HTA11_1391_2000001011 | Human | Colorectum | AD | 7.78e-04 | 2.74e-01 | -0.059 |
| 51092 | SIDT2 | HTA11_546_2000001011 | Human | Colorectum | AD | 2.73e-02 | 3.16e-01 | -0.0842 |
| Page: 1 |
| Tissue | Expression Dynamics | Abbreviation |
| Colorectum (GSE201348) |  | FAP: Familial adenomatous polyposis |
| CRC: Colorectal cancer | ||
| Colorectum (HTA11) | 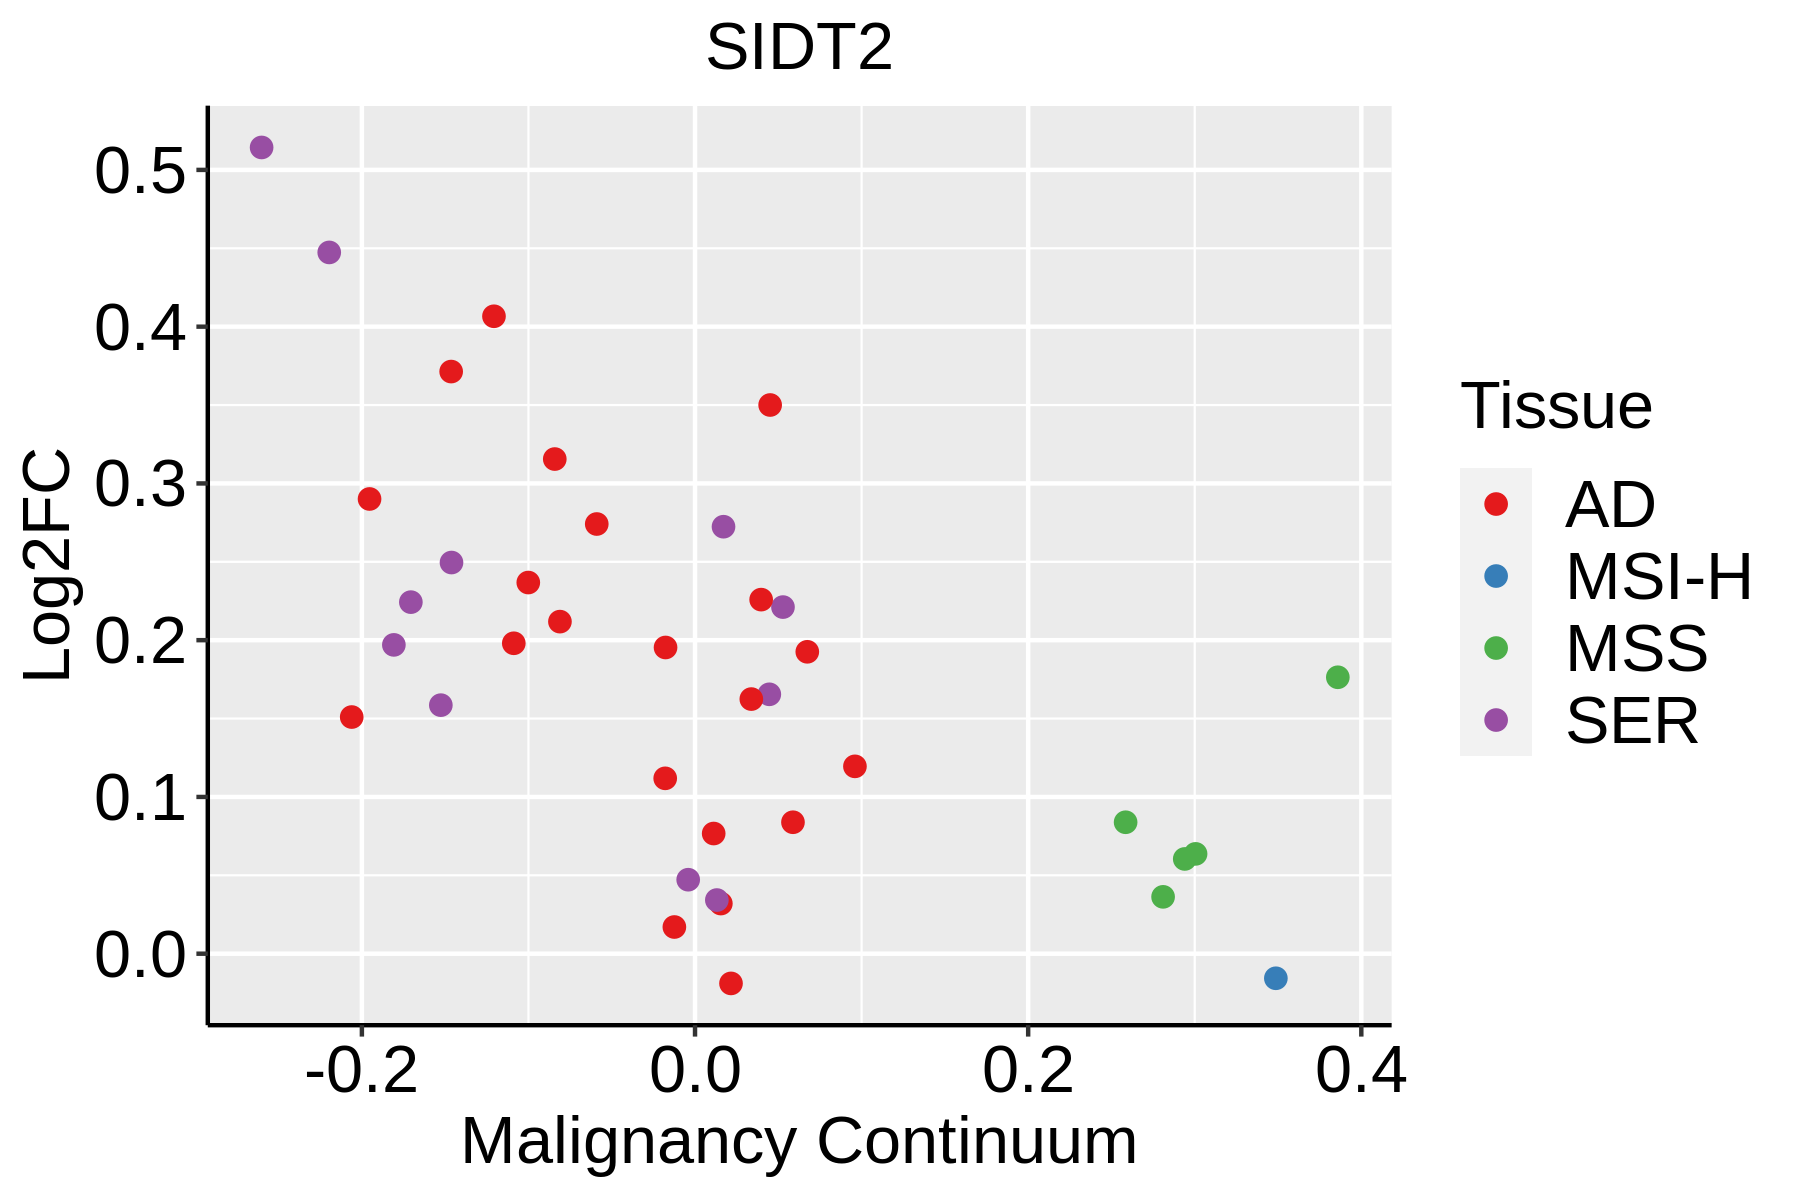 | AD: Adenomas |
| SER: Sessile serrated lesions | ||
| MSI-H: Microsatellite-high colorectal cancer | ||
| MSS: Microsatellite stable colorectal cancer |
| ∗log2FC in expression of this searched gene in stem-like cells from each diseased tissue sample relative to stem-like cells in normal samples in each tissue plotted against the malignancy continuum. Samples are colored based on if they are from different disease stage. |
Top |
Malignant transformation related pathway analysis |
| Find out the enriched GO biological processes and KEGG pathways involved in transition from healthy to precancer to cancer |
| Tissue | Disease Stage | Enriched GO biological Processes |
| Colorectum | AD |  |
| Colorectum | SER |  |
| Colorectum | MSS |  |
| Colorectum | MSI-H |  |
| Colorectum | FAP |  |
| ∗Top 15 enriched GO BP terms are showed in the bar plot of each disease state in each tissue. Each row represents a significant GO biological process which is colored according to the -log10(p.adjust). |
| Page: 1 2 3 4 5 6 7 8 9 |
| GO ID | Tissue | Disease Stage | Description | Gene Ratio | Bg Ratio | pvalue | p.adjust | Count |
| GO:0002064 | Colorectum | AD | epithelial cell development | 89/3918 | 220/18723 | 2.98e-11 | 3.52e-09 | 89 |
| GO:0006401 | Colorectum | AD | RNA catabolic process | 102/3918 | 278/18723 | 8.64e-10 | 6.76e-08 | 102 |
| GO:0044270 | Colorectum | AD | cellular nitrogen compound catabolic process | 147/3918 | 451/18723 | 3.35e-09 | 2.23e-07 | 147 |
| GO:0046700 | Colorectum | AD | heterocycle catabolic process | 145/3918 | 445/18723 | 4.37e-09 | 2.84e-07 | 145 |
| GO:0034655 | Colorectum | AD | nucleobase-containing compound catabolic process | 133/3918 | 407/18723 | 1.56e-08 | 9.12e-07 | 133 |
| GO:0019439 | Colorectum | AD | aromatic compound catabolic process | 146/3918 | 467/18723 | 7.48e-08 | 3.84e-06 | 146 |
| GO:1901361 | Colorectum | AD | organic cyclic compound catabolic process | 153/3918 | 495/18723 | 8.23e-08 | 4.18e-06 | 153 |
| GO:0009743 | Colorectum | AD | response to carbohydrate | 86/3918 | 253/18723 | 8.43e-07 | 2.90e-05 | 86 |
| GO:0006403 | Colorectum | AD | RNA localization | 71/3918 | 201/18723 | 1.54e-06 | 4.76e-05 | 71 |
| GO:0034284 | Colorectum | AD | response to monosaccharide | 76/3918 | 225/18723 | 4.64e-06 | 1.23e-04 | 76 |
| GO:0033500 | Colorectum | AD | carbohydrate homeostasis | 84/3918 | 259/18723 | 9.10e-06 | 2.15e-04 | 84 |
| GO:0009746 | Colorectum | AD | response to hexose | 73/3918 | 219/18723 | 1.20e-05 | 2.65e-04 | 73 |
| GO:0009749 | Colorectum | AD | response to glucose | 71/3918 | 212/18723 | 1.31e-05 | 2.85e-04 | 71 |
| GO:0042593 | Colorectum | AD | glucose homeostasis | 83/3918 | 258/18723 | 1.44e-05 | 3.11e-04 | 83 |
| GO:0001678 | Colorectum | AD | cellular glucose homeostasis | 60/3918 | 172/18723 | 1.49e-05 | 3.18e-04 | 60 |
| GO:0051236 | Colorectum | AD | establishment of RNA localization | 58/3918 | 166/18723 | 1.95e-05 | 4.01e-04 | 58 |
| GO:0015931 | Colorectum | AD | nucleobase-containing compound transport | 73/3918 | 222/18723 | 2.02e-05 | 4.10e-04 | 73 |
| GO:0050657 | Colorectum | AD | nucleic acid transport | 57/3918 | 163/18723 | 2.22e-05 | 4.39e-04 | 57 |
| GO:0050658 | Colorectum | AD | RNA transport | 57/3918 | 163/18723 | 2.22e-05 | 4.39e-04 | 57 |
| GO:0071322 | Colorectum | AD | cellular response to carbohydrate stimulus | 56/3918 | 163/18723 | 4.61e-05 | 7.97e-04 | 56 |
| Page: 1 2 |
| Pathway ID | Tissue | Disease Stage | Description | Gene Ratio | Bg Ratio | pvalue | p.adjust | qvalue | Count |
| Page: 1 |
Top |
Cell-cell communication analysis |
| Identification of potential cell-cell interactions between two cell types and their ligand-receptor pairs for different disease states |
| Ligand | Receptor | LRpair | Pathway | Tissue | Disease Stage |
| Page: 1 |
Top |
Single-cell gene regulatory network inference analysis |
| Find out the significant the regulons (TFs) and the target genes of each regulon across cell types for different disease states |
| TF | Cell Type | Tissue | Disease Stage | Target Gene | RSS | Regulon Activity |
| ∗The dot plots of a searched regulon are shown for all cell subpopulations in each disease state of each tissue based on the regulon specific score inferred using pySCENIC and by calculating the average expression. |
| Page: 1 |
Top |
Somatic mutation of malignant transformation related genes |
| Annotation of somatic variants for genes involved in malignant transformation |
| Hugo Symbol | Variant Class | Variant Classification | dbSNP RS | HGVSc | HGVSp | HGVSp Short | SWISSPROT | BIOTYPE | SIFT | PolyPhen | Tumor Sample Barcode | Tissue | Histology | Sex | Age | Stage | Therapy Types | Drugs | Outcome |
| SIDT2 | SNV | Missense_Mutation | c.2167A>G | p.Ile723Val | p.I723V | Q8NBJ9 | protein_coding | deleterious(0) | possibly_damaging(0.842) | TCGA-A1-A0SD-01 | Breast | breast invasive carcinoma | Female | <65 | I/II | Unknown | Unknown | SD | |
| SIDT2 | SNV | Missense_Mutation | c.1859C>T | p.Ser620Phe | p.S620F | Q8NBJ9 | protein_coding | deleterious(0.01) | possibly_damaging(0.722) | TCGA-A1-A0SI-01 | Breast | breast invasive carcinoma | Female | <65 | I/II | Unknown | Unknown | SD | |
| SIDT2 | SNV | Missense_Mutation | novel | c.1558A>C | p.Ile520Leu | p.I520L | Q8NBJ9 | protein_coding | deleterious(0.01) | benign(0.088) | TCGA-A7-A0DA-01 | Breast | breast invasive carcinoma | Female | <65 | I/II | Chemotherapy | adriamycin | SD |
| SIDT2 | SNV | Missense_Mutation | rs200870091 | c.1597C>T | p.Arg533Cys | p.R533C | Q8NBJ9 | protein_coding | tolerated(0.06) | benign(0.031) | TCGA-AC-A23H-01 | Breast | breast invasive carcinoma | Female | >=65 | I/II | Unknown | Unknown | PD |
| SIDT2 | SNV | Missense_Mutation | c.1728N>A | p.Phe576Leu | p.F576L | Q8NBJ9 | protein_coding | deleterious(0) | probably_damaging(0.992) | TCGA-AN-A0FN-01 | Breast | breast invasive carcinoma | Female | <65 | I/II | Unknown | Unknown | SD | |
| SIDT2 | SNV | Missense_Mutation | c.1815C>A | p.Ser605Arg | p.S605R | Q8NBJ9 | protein_coding | tolerated(0.21) | benign(0.441) | TCGA-BH-A18T-01 | Breast | breast invasive carcinoma | Female | >=65 | I/II | Unknown | Unknown | PD | |
| SIDT2 | SNV | Missense_Mutation | rs868396005 | c.1585N>T | p.Arg529Trp | p.R529W | Q8NBJ9 | protein_coding | deleterious(0) | probably_damaging(0.989) | TCGA-D8-A1XQ-01 | Breast | breast invasive carcinoma | Female | >=65 | I/II | Unknown | Unknown | SD |
| SIDT2 | SNV | Missense_Mutation | rs778953424 | c.440N>A | p.Arg147Gln | p.R147Q | Q8NBJ9 | protein_coding | tolerated(0.32) | benign(0.125) | TCGA-2W-A8YY-01 | Cervix | cervical & endocervical cancer | Female | <65 | I/II | Chemotherapy | cisplatin | CR |
| SIDT2 | SNV | Missense_Mutation | rs774956200 | c.2257N>A | p.Val753Ile | p.V753I | Q8NBJ9 | protein_coding | tolerated(0.6) | benign(0.006) | TCGA-2W-A8YY-01 | Cervix | cervical & endocervical cancer | Female | <65 | I/II | Chemotherapy | cisplatin | CR |
| SIDT2 | SNV | Missense_Mutation | c.167C>T | p.Thr56Ile | p.T56I | Q8NBJ9 | protein_coding | deleterious(0.01) | benign(0.408) | TCGA-EK-A2RC-01 | Cervix | cervical & endocervical cancer | Female | <65 | I/II | Unknown | Unknown | SD |
| Page: 1 2 3 4 5 6 7 8 9 |
Top |
Related drugs of malignant transformation related genes |
| Identification of chemicals and drugs interact with genes involved in malignant transfromation |
| (DGIdb 4.0) |
| Entrez ID | Symbol | Category | Interaction Types | Drug Claim Name | Drug Name | PMIDs |
| Page: 1 |

Copyright 2023-Present -The University of Texas Health Science Center at Houston |