
|
|||||
|
 | |
| |
| |
| |
| |
| |
|
Gene: SHROOM4 |
Gene summary for SHROOM4 |
| Gene information | Species | Human | Gene symbol | SHROOM4 | Gene ID | 57477 |
| Gene name | shroom family member 4 | |
| Gene Alias | MRXSSDS | |
| Cytomap | Xp11.22 | |
| Gene Type | protein-coding | GO ID | GO:0003008 | UniProtAcc | Q9ULL8 |
Top |
Malignant transformation analysis |
| Identification of the aberrant gene expression in precancerous and cancerous lesions by comparing the gene expression of stem-like cells in diseased tissues with normal stem cells |
| Entrez ID | Symbol | Replicates | Species | Organ | Tissue | Adj P-value | Log2FC | Malignancy |
| 57477 | SHROOM4 | HCC1 | Human | Liver | HCC | 2.53e-11 | 2.36e+00 | 0.5336 |
| 57477 | SHROOM4 | HCC2 | Human | Liver | HCC | 9.74e-22 | 1.20e+00 | 0.5341 |
| 57477 | SHROOM4 | HCC5 | Human | Liver | HCC | 3.86e-42 | 1.54e+00 | 0.4932 |
| 57477 | SHROOM4 | RNA-P25T1-P25T1-1 | Human | Lung | AIS | 1.34e-15 | 8.36e-01 | -0.2116 |
| 57477 | SHROOM4 | RNA-P25T1-P25T1-2 | Human | Lung | AIS | 3.39e-02 | 6.20e-01 | -0.1941 |
| 57477 | SHROOM4 | RNA-P25T1-P25T1-3 | Human | Lung | AIS | 1.28e-10 | 8.98e-01 | -0.2107 |
| 57477 | SHROOM4 | RNA-P25T1-P25T1-4 | Human | Lung | AIS | 1.85e-10 | 7.00e-01 | -0.2119 |
| 57477 | SHROOM4 | RNA-P6T1-P6T1-4 | Human | Lung | MIAC | 5.98e-05 | 7.43e-01 | -0.0263 |
| 57477 | SHROOM4 | RNA-P6T2-P6T2-1 | Human | Lung | IAC | 3.22e-22 | 8.42e-01 | -0.0166 |
| 57477 | SHROOM4 | RNA-P6T2-P6T2-2 | Human | Lung | IAC | 4.68e-29 | 8.50e-01 | -0.0132 |
| 57477 | SHROOM4 | RNA-P6T2-P6T2-3 | Human | Lung | IAC | 5.23e-37 | 9.31e-01 | -0.013 |
| 57477 | SHROOM4 | RNA-P6T2-P6T2-4 | Human | Lung | IAC | 5.18e-19 | 7.55e-01 | -0.0121 |
| 57477 | SHROOM4 | RNA-P7T1-P7T1-1 | Human | Lung | AIS | 4.10e-02 | 6.26e-01 | -0.0961 |
| 57477 | SHROOM4 | RNA-P7T1-P7T1-4 | Human | Lung | AIS | 1.10e-03 | 6.41e-01 | -0.0809 |
| 57477 | SHROOM4 | male-WTA | Human | Thyroid | PTC | 7.27e-33 | 3.53e-01 | 0.1037 |
| 57477 | SHROOM4 | PTC01 | Human | Thyroid | PTC | 1.50e-26 | 5.08e-01 | 0.1899 |
| 57477 | SHROOM4 | PTC03 | Human | Thyroid | PTC | 1.35e-04 | 1.99e-01 | 0.1784 |
| 57477 | SHROOM4 | PTC04 | Human | Thyroid | PTC | 2.61e-10 | 2.23e-01 | 0.1927 |
| 57477 | SHROOM4 | PTC05 | Human | Thyroid | PTC | 1.25e-14 | 5.73e-01 | 0.2065 |
| 57477 | SHROOM4 | PTC06 | Human | Thyroid | PTC | 8.26e-53 | 1.07e+00 | 0.2057 |
| Page: 1 2 |
| Tissue | Expression Dynamics | Abbreviation |
| Liver | 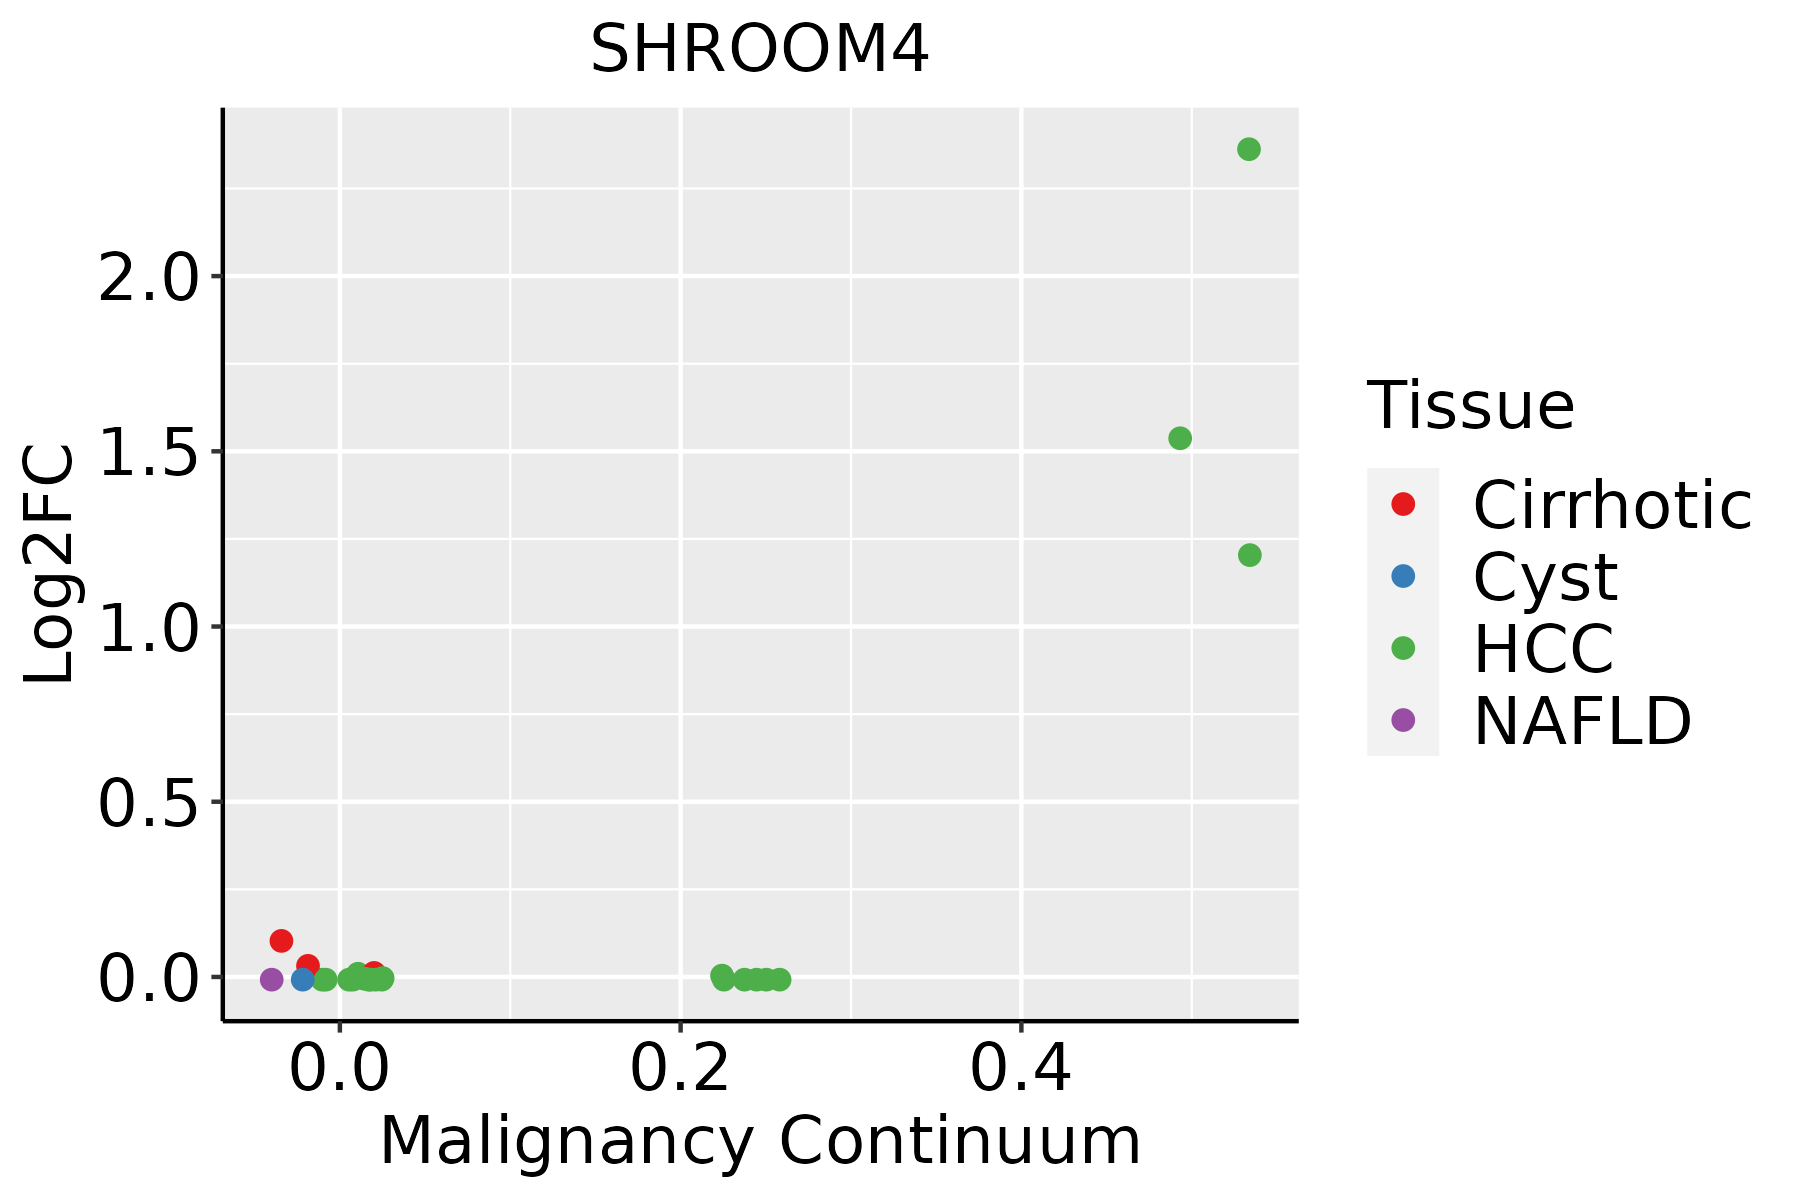 | HCC: Hepatocellular carcinoma |
| NAFLD: Non-alcoholic fatty liver disease | ||
| Lung |  | AAH: Atypical adenomatous hyperplasia |
| AIS: Adenocarcinoma in situ | ||
| IAC: Invasive lung adenocarcinoma | ||
| MIA: Minimally invasive adenocarcinoma | ||
| Thyroid |  | ATC: Anaplastic thyroid cancer |
| HT: Hashimoto's thyroiditis | ||
| PTC: Papillary thyroid cancer |
| ∗log2FC in expression of this searched gene in stem-like cells from each diseased tissue sample relative to stem-like cells in normal samples in each tissue plotted against the malignancy continuum. Samples are colored based on if they are from different disease stage. |
Top |
Malignant transformation related pathway analysis |
| Find out the enriched GO biological processes and KEGG pathways involved in transition from healthy to precancer to cancer |
| Tissue | Disease Stage | Enriched GO biological Processes |
| Colorectum | AD |  |
| Colorectum | SER |  |
| Colorectum | MSS |  |
| Colorectum | MSI-H |  |
| Colorectum | FAP |  |
| ∗Top 15 enriched GO BP terms are showed in the bar plot of each disease state in each tissue. Each row represents a significant GO biological process which is colored according to the -log10(p.adjust). |
| Page: 1 2 3 4 5 6 7 8 9 |
| GO ID | Tissue | Disease Stage | Description | Gene Ratio | Bg Ratio | pvalue | p.adjust | Count |
| GO:000701522 | Liver | HCC | actin filament organization | 252/7958 | 442/18723 | 3.83e-10 | 1.25e-08 | 252 |
| GO:00070158 | Lung | IAC | actin filament organization | 92/2061 | 442/18723 | 1.01e-09 | 1.93e-07 | 92 |
| GO:000701513 | Lung | AIS | actin filament organization | 88/1849 | 442/18723 | 1.02e-10 | 3.13e-08 | 88 |
| GO:000701533 | Lung | MIAC | actin filament organization | 50/967 | 442/18723 | 1.64e-07 | 3.81e-05 | 50 |
| GO:0007015112 | Thyroid | PTC | actin filament organization | 225/5968 | 442/18723 | 3.76e-17 | 3.44e-15 | 225 |
| GO:0007015210 | Thyroid | ATC | actin filament organization | 227/6293 | 442/18723 | 5.96e-15 | 3.85e-13 | 227 |
| Page: 1 |
| Pathway ID | Tissue | Disease Stage | Description | Gene Ratio | Bg Ratio | pvalue | p.adjust | qvalue | Count |
| Page: 1 |
Top |
Cell-cell communication analysis |
| Identification of potential cell-cell interactions between two cell types and their ligand-receptor pairs for different disease states |
| Ligand | Receptor | LRpair | Pathway | Tissue | Disease Stage |
| Page: 1 |
Top |
Single-cell gene regulatory network inference analysis |
| Find out the significant the regulons (TFs) and the target genes of each regulon across cell types for different disease states |
| TF | Cell Type | Tissue | Disease Stage | Target Gene | RSS | Regulon Activity |
| ∗The dot plots of a searched regulon are shown for all cell subpopulations in each disease state of each tissue based on the regulon specific score inferred using pySCENIC and by calculating the average expression. |
| Page: 1 |
Top |
Somatic mutation of malignant transformation related genes |
| Annotation of somatic variants for genes involved in malignant transformation |
| Hugo Symbol | Variant Class | Variant Classification | dbSNP RS | HGVSc | HGVSp | HGVSp Short | SWISSPROT | BIOTYPE | SIFT | PolyPhen | Tumor Sample Barcode | Tissue | Histology | Sex | Age | Stage | Therapy Types | Drugs | Outcome |
| SHROOM4 | SNV | Missense_Mutation | novel | c.2968N>G | p.His990Asp | p.H990D | Q9ULL8 | protein_coding | deleterious(0.02) | possibly_damaging(0.879) | TCGA-5L-AAT1-01 | Breast | breast invasive carcinoma | Female | <65 | III/IV | Hormone Therapy | letrozol | SD |
| SHROOM4 | SNV | Missense_Mutation | novel | c.2243N>T | p.Pro748Leu | p.P748L | Q9ULL8 | protein_coding | tolerated(0.16) | benign(0.003) | TCGA-5L-AAT1-01 | Breast | breast invasive carcinoma | Female | <65 | III/IV | Hormone Therapy | letrozol | SD |
| SHROOM4 | SNV | Missense_Mutation | rs370831168 | c.320N>C | p.Leu107Pro | p.L107P | Q9ULL8 | protein_coding | tolerated(0.2) | possibly_damaging(0.854) | TCGA-A8-A07L-01 | Breast | breast invasive carcinoma | Female | <65 | III/IV | Chemotherapy | CR | |
| SHROOM4 | SNV | Missense_Mutation | c.3016N>C | p.Glu1006Gln | p.E1006Q | Q9ULL8 | protein_coding | deleterious(0.01) | benign(0.031) | TCGA-AC-A23H-01 | Breast | breast invasive carcinoma | Female | >=65 | I/II | Unknown | Unknown | PD | |
| SHROOM4 | SNV | Missense_Mutation | c.2512N>T | p.His838Tyr | p.H838Y | Q9ULL8 | protein_coding | deleterious(0.02) | probably_damaging(0.932) | TCGA-AC-A23H-01 | Breast | breast invasive carcinoma | Female | >=65 | I/II | Unknown | Unknown | PD | |
| SHROOM4 | SNV | Missense_Mutation | c.4189G>A | p.Asp1397Asn | p.D1397N | Q9ULL8 | protein_coding | deleterious(0.04) | probably_damaging(0.995) | TCGA-AN-A046-01 | Breast | breast invasive carcinoma | Female | >=65 | I/II | Unknown | Unknown | SD | |
| SHROOM4 | SNV | Missense_Mutation | rs200144471 | c.3346C>T | p.Arg1116Cys | p.R1116C | Q9ULL8 | protein_coding | deleterious(0) | probably_damaging(0.94) | TCGA-BH-A0BT-01 | Breast | breast invasive carcinoma | Female | <65 | I/II | Chemotherapy | adriamycin | CR |
| SHROOM4 | SNV | Missense_Mutation | c.1142N>G | p.Ser381Cys | p.S381C | Q9ULL8 | protein_coding | tolerated(0.13) | benign(0.001) | TCGA-D8-A27G-01 | Breast | breast invasive carcinoma | Female | >=65 | I/II | Unknown | Unknown | SD | |
| SHROOM4 | SNV | Missense_Mutation | c.3666C>G | p.His1222Gln | p.H1222Q | Q9ULL8 | protein_coding | tolerated(0.16) | benign(0.015) | TCGA-E2-A15S-01 | Breast | breast invasive carcinoma | Female | <65 | I/II | Chemotherapy | doxorubicin | SD | |
| SHROOM4 | SNV | Missense_Mutation | novel | c.2066N>C | p.Gln689Pro | p.Q689P | Q9ULL8 | protein_coding | tolerated(0.06) | benign(0.01) | TCGA-E2-A1II-01 | Breast | breast invasive carcinoma | Female | <65 | I/II | Chemotherapy | doxorubicin | SD |
| Page: 1 2 3 4 5 6 7 8 9 10 11 12 13 14 15 16 17 18 19 |
Top |
Related drugs of malignant transformation related genes |
| Identification of chemicals and drugs interact with genes involved in malignant transfromation |
| (DGIdb 4.0) |
| Entrez ID | Symbol | Category | Interaction Types | Drug Claim Name | Drug Name | PMIDs |
| Page: 1 |

Copyright 2023-Present -The University of Texas Health Science Center at Houston |