
|
|||||
|
 | |
| |
| |
| |
| |
| |
|
Gene: SHPRH |
Gene summary for SHPRH |
| Gene information | Species | Human | Gene symbol | SHPRH | Gene ID | 257218 |
| Gene name | SNF2 histone linker PHD RING helicase | |
| Gene Alias | RAD5 | |
| Cytomap | 6q24.3 | |
| Gene Type | protein-coding | GO ID | GO:0000209 | UniProtAcc | B3KX98 |
Top |
Malignant transformation analysis |
| Identification of the aberrant gene expression in precancerous and cancerous lesions by comparing the gene expression of stem-like cells in diseased tissues with normal stem cells |
| Entrez ID | Symbol | Replicates | Species | Organ | Tissue | Adj P-value | Log2FC | Malignancy |
| 257218 | SHPRH | HTA11_3410_2000001011 | Human | Colorectum | AD | 1.19e-14 | -5.62e-01 | 0.0155 |
| 257218 | SHPRH | HTA11_2487_2000001011 | Human | Colorectum | SER | 1.02e-06 | -5.36e-01 | -0.1808 |
| 257218 | SHPRH | HTA11_1938_2000001011 | Human | Colorectum | AD | 9.18e-03 | -4.82e-01 | -0.0811 |
| 257218 | SHPRH | HTA11_3361_2000001011 | Human | Colorectum | AD | 1.82e-07 | -5.93e-01 | -0.1207 |
| 257218 | SHPRH | HTA11_83_2000001011 | Human | Colorectum | SER | 5.23e-05 | -5.74e-01 | -0.1526 |
| 257218 | SHPRH | HTA11_696_2000001011 | Human | Colorectum | AD | 6.52e-22 | -5.57e-01 | -0.1464 |
| 257218 | SHPRH | HTA11_866_2000001011 | Human | Colorectum | AD | 5.19e-12 | -4.67e-01 | -0.1001 |
| 257218 | SHPRH | HTA11_1391_2000001011 | Human | Colorectum | AD | 8.82e-04 | -4.18e-01 | -0.059 |
| 257218 | SHPRH | HTA11_866_3004761011 | Human | Colorectum | AD | 4.35e-10 | -5.14e-01 | 0.096 |
| 257218 | SHPRH | HTA11_8622_2000001021 | Human | Colorectum | SER | 5.09e-03 | -6.08e-01 | 0.0528 |
| 257218 | SHPRH | HTA11_10711_2000001011 | Human | Colorectum | AD | 4.69e-09 | -5.96e-01 | 0.0338 |
| 257218 | SHPRH | HTA11_7696_3000711011 | Human | Colorectum | AD | 6.02e-16 | -5.03e-01 | 0.0674 |
| 257218 | SHPRH | HTA11_6818_2000001011 | Human | Colorectum | AD | 4.93e-02 | -5.36e-01 | 0.0112 |
| 257218 | SHPRH | HTA11_99999970781_79442 | Human | Colorectum | MSS | 7.17e-11 | -4.06e-01 | 0.294 |
| 257218 | SHPRH | HTA11_99999971662_82457 | Human | Colorectum | MSS | 1.99e-06 | -3.77e-01 | 0.3859 |
| 257218 | SHPRH | HTA11_99999973899_84307 | Human | Colorectum | MSS | 1.79e-02 | -5.10e-01 | 0.2585 |
| 257218 | SHPRH | HTA11_99999974143_84620 | Human | Colorectum | MSS | 1.98e-19 | -5.42e-01 | 0.3005 |
| 257218 | SHPRH | F007 | Human | Colorectum | FAP | 3.70e-02 | -1.69e-01 | 0.1176 |
| 257218 | SHPRH | A001-C-207 | Human | Colorectum | FAP | 9.19e-04 | -2.08e-01 | 0.1278 |
| 257218 | SHPRH | A015-C-203 | Human | Colorectum | FAP | 1.15e-22 | -2.95e-01 | -0.1294 |
| Page: 1 2 3 4 5 6 7 |
| Tissue | Expression Dynamics | Abbreviation |
| Colorectum (GSE201348) |  | FAP: Familial adenomatous polyposis |
| CRC: Colorectal cancer | ||
| Colorectum (HTA11) |  | AD: Adenomas |
| SER: Sessile serrated lesions | ||
| MSI-H: Microsatellite-high colorectal cancer | ||
| MSS: Microsatellite stable colorectal cancer | ||
| Esophagus | 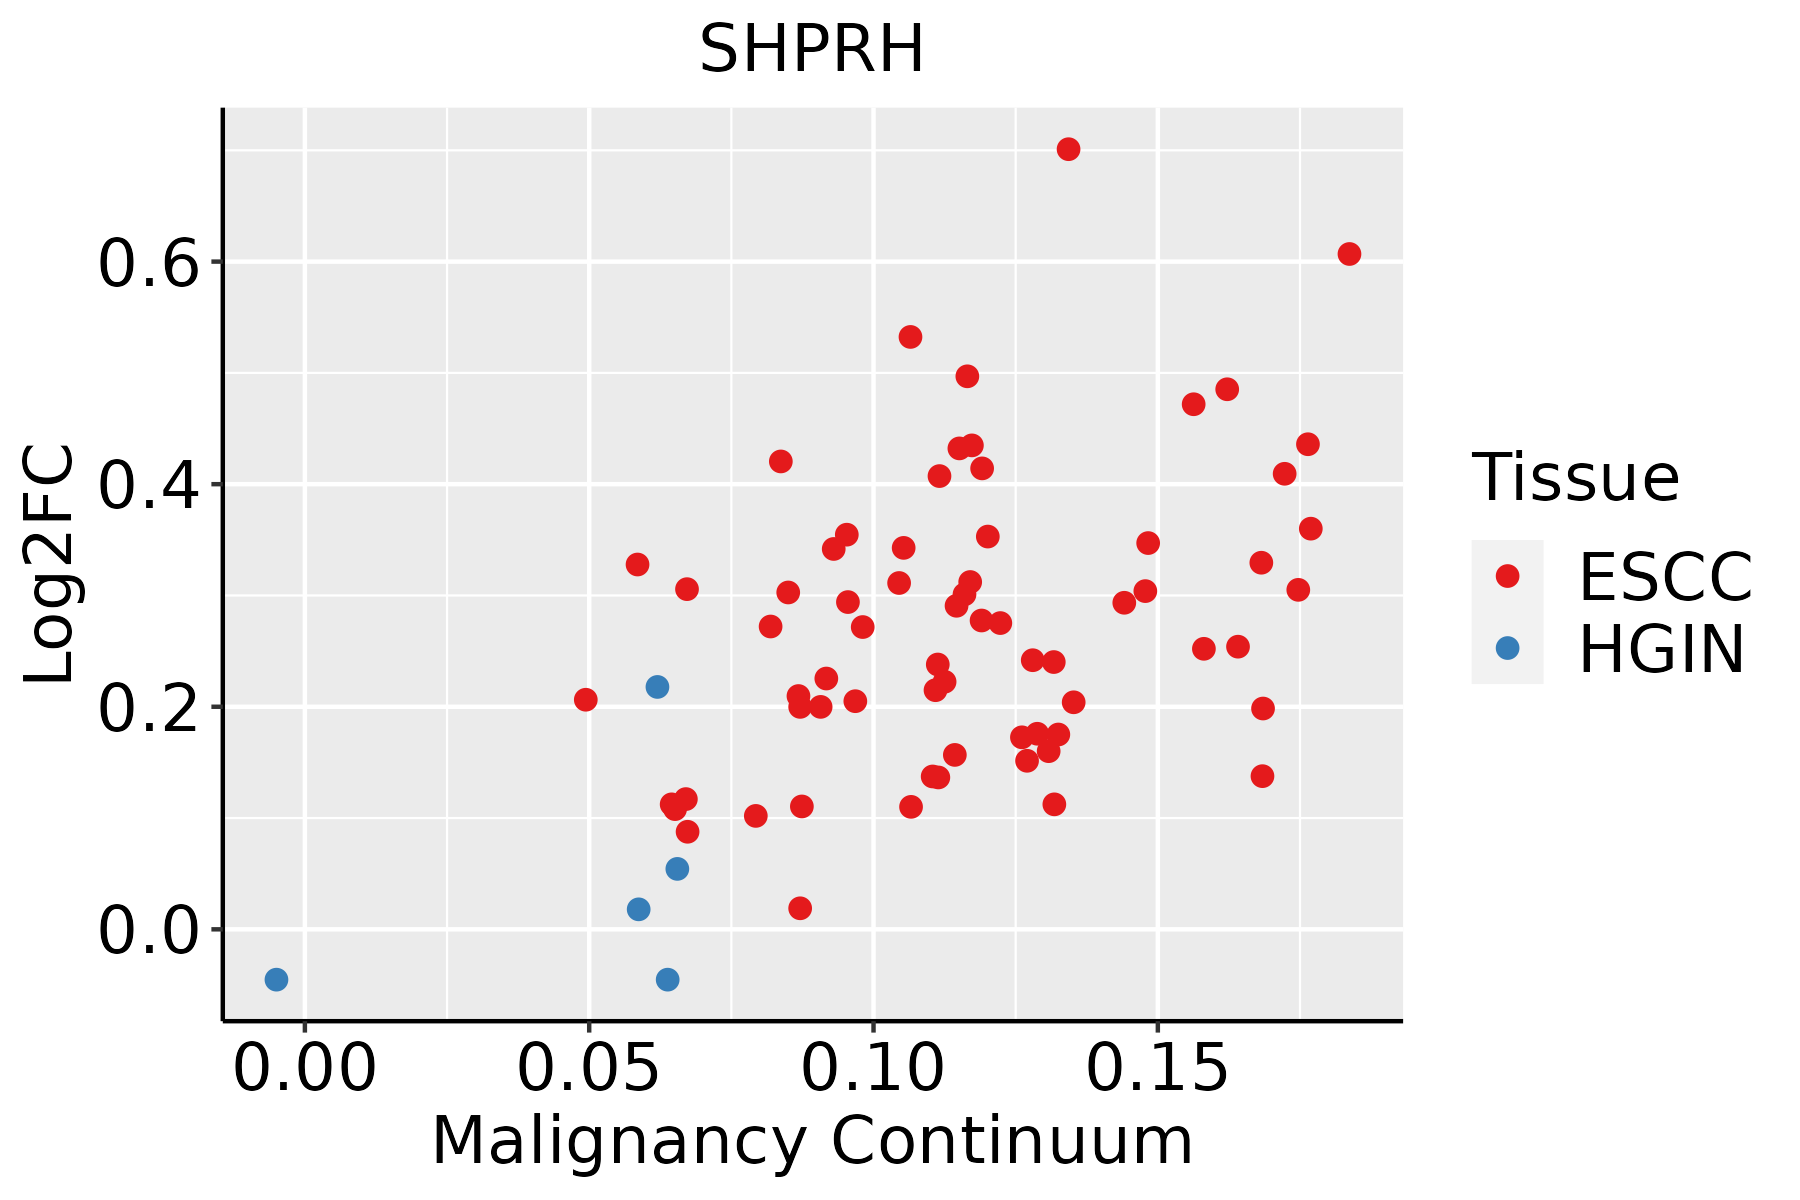 | ESCC: Esophageal squamous cell carcinoma |
| HGIN: High-grade intraepithelial neoplasias | ||
| LGIN: Low-grade intraepithelial neoplasias | ||
| Thyroid | 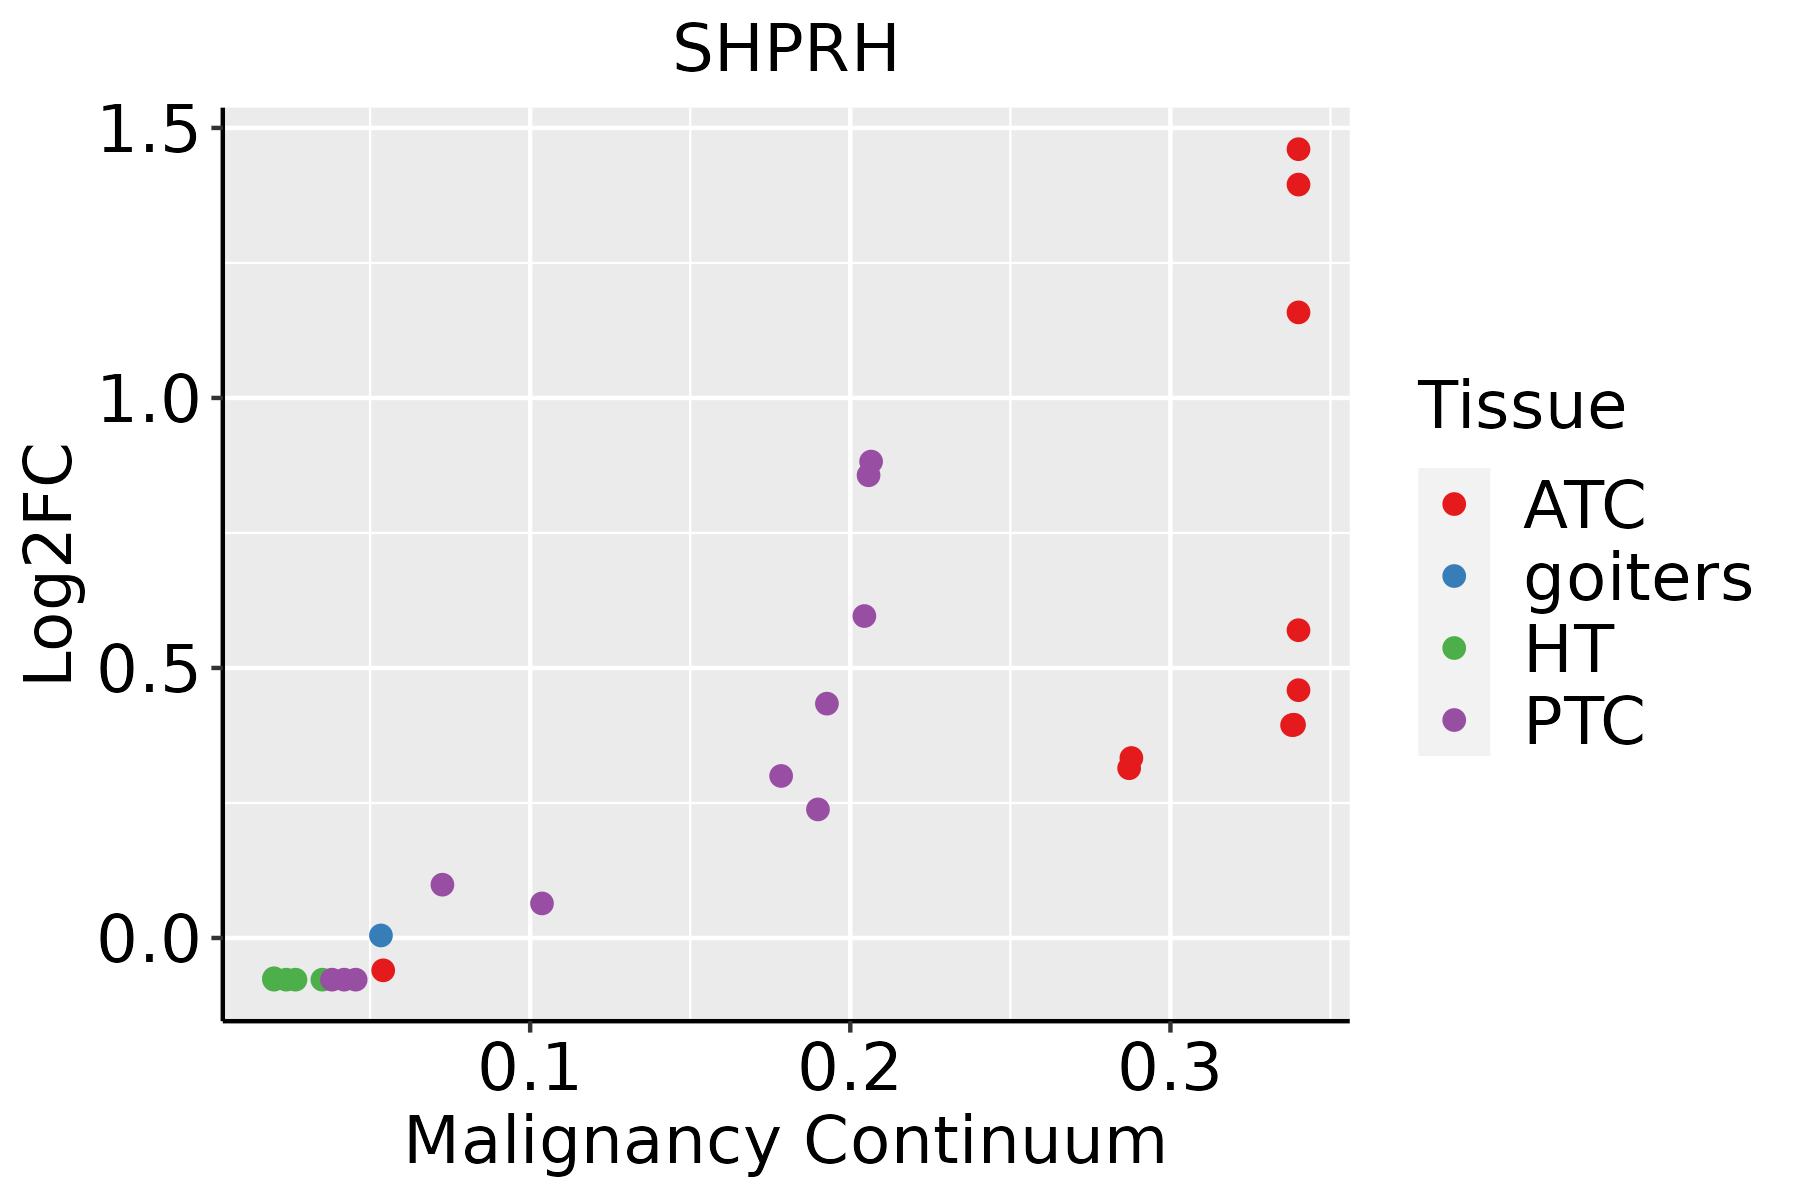 | ATC: Anaplastic thyroid cancer |
| HT: Hashimoto's thyroiditis | ||
| PTC: Papillary thyroid cancer |
| ∗log2FC in expression of this searched gene in stem-like cells from each diseased tissue sample relative to stem-like cells in normal samples in each tissue plotted against the malignancy continuum. Samples are colored based on if they are from different disease stage. |
Top |
Malignant transformation related pathway analysis |
| Find out the enriched GO biological processes and KEGG pathways involved in transition from healthy to precancer to cancer |
| Tissue | Disease Stage | Enriched GO biological Processes |
| Colorectum | AD |  |
| Colorectum | SER |  |
| Colorectum | MSS |  |
| Colorectum | MSI-H |  |
| Colorectum | FAP |  |
| ∗Top 15 enriched GO BP terms are showed in the bar plot of each disease state in each tissue. Each row represents a significant GO biological process which is colored according to the -log10(p.adjust). |
| Page: 1 2 3 4 5 6 7 8 9 |
| GO ID | Tissue | Disease Stage | Description | Gene Ratio | Bg Ratio | pvalue | p.adjust | Count |
| GO:0000209 | Colorectum | AD | protein polyubiquitination | 78/3918 | 236/18723 | 8.71e-06 | 2.06e-04 | 78 |
| GO:0006325 | Colorectum | AD | chromatin organization | 119/3918 | 409/18723 | 4.85e-05 | 8.33e-04 | 119 |
| GO:0006338 | Colorectum | AD | chromatin remodeling | 70/3918 | 255/18723 | 7.44e-03 | 4.53e-02 | 70 |
| GO:00002091 | Colorectum | SER | protein polyubiquitination | 58/2897 | 236/18723 | 1.69e-04 | 3.18e-03 | 58 |
| GO:00063251 | Colorectum | SER | chromatin organization | 89/2897 | 409/18723 | 4.15e-04 | 6.17e-03 | 89 |
| GO:00002092 | Colorectum | MSS | protein polyubiquitination | 72/3467 | 236/18723 | 5.19e-06 | 1.42e-04 | 72 |
| GO:00063252 | Colorectum | MSS | chromatin organization | 107/3467 | 409/18723 | 7.22e-05 | 1.21e-03 | 107 |
| GO:00002093 | Colorectum | FAP | protein polyubiquitination | 59/2622 | 236/18723 | 4.53e-06 | 1.52e-04 | 59 |
| GO:00063253 | Colorectum | FAP | chromatin organization | 84/2622 | 409/18723 | 1.62e-04 | 2.47e-03 | 84 |
| GO:00063254 | Colorectum | CRC | chromatin organization | 74/2078 | 409/18723 | 1.48e-05 | 4.61e-04 | 74 |
| GO:00002094 | Colorectum | CRC | protein polyubiquitination | 46/2078 | 236/18723 | 9.91e-05 | 1.98e-03 | 46 |
| GO:000020917 | Esophagus | ESCC | protein polyubiquitination | 170/8552 | 236/18723 | 1.40e-16 | 1.09e-14 | 170 |
| GO:000632517 | Esophagus | ESCC | chromatin organization | 240/8552 | 409/18723 | 6.52e-08 | 1.14e-06 | 240 |
| GO:000020920 | Thyroid | PTC | protein polyubiquitination | 128/5968 | 236/18723 | 7.81e-13 | 3.65e-11 | 128 |
| GO:000632520 | Thyroid | PTC | chromatin organization | 183/5968 | 409/18723 | 2.55e-08 | 5.70e-07 | 183 |
| GO:00063385 | Thyroid | PTC | chromatin remodeling | 106/5968 | 255/18723 | 6.56e-04 | 4.13e-03 | 106 |
| GO:0000209110 | Thyroid | ATC | protein polyubiquitination | 134/6293 | 236/18723 | 1.86e-13 | 9.20e-12 | 134 |
| GO:0006325110 | Thyroid | ATC | chromatin organization | 189/6293 | 409/18723 | 6.40e-08 | 1.13e-06 | 189 |
| GO:000633813 | Thyroid | ATC | chromatin remodeling | 109/6293 | 255/18723 | 1.38e-03 | 7.15e-03 | 109 |
| GO:00718242 | Thyroid | ATC | protein-DNA complex subunit organization | 103/6293 | 241/18723 | 1.84e-03 | 9.03e-03 | 103 |
| Page: 1 |
| Pathway ID | Tissue | Disease Stage | Description | Gene Ratio | Bg Ratio | pvalue | p.adjust | qvalue | Count |
| Page: 1 |
Top |
Cell-cell communication analysis |
| Identification of potential cell-cell interactions between two cell types and their ligand-receptor pairs for different disease states |
| Ligand | Receptor | LRpair | Pathway | Tissue | Disease Stage |
| Page: 1 |
Top |
Single-cell gene regulatory network inference analysis |
| Find out the significant the regulons (TFs) and the target genes of each regulon across cell types for different disease states |
| TF | Cell Type | Tissue | Disease Stage | Target Gene | RSS | Regulon Activity |
| ∗The dot plots of a searched regulon are shown for all cell subpopulations in each disease state of each tissue based on the regulon specific score inferred using pySCENIC and by calculating the average expression. |
| Page: 1 |
Top |
Somatic mutation of malignant transformation related genes |
| Annotation of somatic variants for genes involved in malignant transformation |
| Hugo Symbol | Variant Class | Variant Classification | dbSNP RS | HGVSc | HGVSp | HGVSp Short | SWISSPROT | BIOTYPE | SIFT | PolyPhen | Tumor Sample Barcode | Tissue | Histology | Sex | Age | Stage | Therapy Types | Drugs | Outcome |
| SHPRH | SNV | Missense_Mutation | novel | c.4103N>A | p.Arg1368Lys | p.R1368K | Q149N8 | protein_coding | tolerated(0.28) | benign(0) | TCGA-A2-A0EQ-01 | Breast | breast invasive carcinoma | Female | <65 | I/II | Chemotherapy | adriamycin | SD |
| SHPRH | SNV | Missense_Mutation | rs761073443 | c.637G>A | p.Gly213Arg | p.G213R | Q149N8 | protein_coding | deleterious(0.02) | benign(0.017) | TCGA-A8-A0A9-01 | Breast | breast invasive carcinoma | Female | >=65 | I/II | Hormone Therapy | anastrozole | SD |
| SHPRH | SNV | Missense_Mutation | c.2602G>A | p.Glu868Lys | p.E868K | Q149N8 | protein_coding | deleterious(0.02) | benign(0.42) | TCGA-AC-A23H-01 | Breast | breast invasive carcinoma | Female | >=65 | I/II | Unknown | Unknown | PD | |
| SHPRH | SNV | Missense_Mutation | rs754645622 | c.40G>A | p.Asp14Asn | p.D14N | Q149N8 | protein_coding | tolerated_low_confidence(0.09) | benign(0.024) | TCGA-AC-A23H-01 | Breast | breast invasive carcinoma | Female | >=65 | I/II | Unknown | Unknown | PD |
| SHPRH | SNV | Missense_Mutation | novel | c.1175G>A | p.Arg392Gln | p.R392Q | Q149N8 | protein_coding | deleterious(0) | probably_damaging(0.999) | TCGA-AC-A3W6-01 | Breast | breast invasive carcinoma | Female | >=65 | III/IV | Unknown | Unknown | SD |
| SHPRH | SNV | Missense_Mutation | novel | c.23C>T | p.Ala8Val | p.A8V | Q149N8 | protein_coding | deleterious_low_confidence(0) | probably_damaging(0.996) | TCGA-AN-A046-01 | Breast | breast invasive carcinoma | Female | >=65 | I/II | Unknown | Unknown | SD |
| SHPRH | SNV | Missense_Mutation | c.3892G>C | p.Glu1298Gln | p.E1298Q | Q149N8 | protein_coding | deleterious(0) | probably_damaging(0.996) | TCGA-B6-A0WZ-01 | Breast | breast invasive carcinoma | Female | <65 | I/II | Unknown | Unknown | PD | |
| SHPRH | SNV | Missense_Mutation | novel | c.226G>C | p.Val76Leu | p.V76L | Q149N8 | protein_coding | tolerated_low_confidence(0.27) | benign(0) | TCGA-BH-A18H-01 | Breast | breast invasive carcinoma | Female | <65 | I/II | Chemotherapy | adriamycin | CR |
| SHPRH | SNV | Missense_Mutation | c.1999N>A | p.Asp667Asn | p.D667N | Q149N8 | protein_coding | tolerated(0.26) | benign(0.009) | TCGA-C8-A26Y-01 | Breast | breast invasive carcinoma | Female | >=65 | I/II | Unknown | Unknown | SD | |
| SHPRH | SNV | Missense_Mutation | c.19C>G | p.Arg7Gly | p.R7G | Q149N8 | protein_coding | deleterious_low_confidence(0) | benign(0.286) | TCGA-D8-A142-01 | Breast | breast invasive carcinoma | Female | >=65 | I/II | Chemotherapy | cyclophosphamid | SD |
| Page: 1 2 3 4 5 6 7 8 9 10 11 12 13 14 15 16 17 18 19 20 21 22 23 24 25 |
Top |
Related drugs of malignant transformation related genes |
| Identification of chemicals and drugs interact with genes involved in malignant transfromation |
| (DGIdb 4.0) |
| Entrez ID | Symbol | Category | Interaction Types | Drug Claim Name | Drug Name | PMIDs |
| Page: 1 |

Copyright 2023-Present -The University of Texas Health Science Center at Houston |