
|
|||||
|
 | |
| |
| |
| |
| |
| |
|
Gene: SHOX2 |
Gene summary for SHOX2 |
| Gene information | Species | Human | Gene symbol | SHOX2 | Gene ID | 6474 |
| Gene name | short stature homeobox 2 | |
| Gene Alias | OG12 | |
| Cytomap | 3q25.32 | |
| Gene Type | protein-coding | GO ID | GO:0000122 | UniProtAcc | O60902 |
Top |
Malignant transformation analysis |
| Identification of the aberrant gene expression in precancerous and cancerous lesions by comparing the gene expression of stem-like cells in diseased tissues with normal stem cells |
| Entrez ID | Symbol | Replicates | Species | Organ | Tissue | Adj P-value | Log2FC | Malignancy |
| 6474 | SHOX2 | LZE7T | Human | Esophagus | ESCC | 3.90e-02 | 1.58e-01 | 0.0667 |
| 6474 | SHOX2 | LZE24T | Human | Esophagus | ESCC | 1.28e-07 | 2.92e-01 | 0.0596 |
| 6474 | SHOX2 | P5T-E | Human | Esophagus | ESCC | 3.50e-02 | 7.33e-02 | 0.1327 |
| 6474 | SHOX2 | P8T-E | Human | Esophagus | ESCC | 1.96e-05 | 1.22e-01 | 0.0889 |
| 6474 | SHOX2 | P10T-E | Human | Esophagus | ESCC | 4.30e-10 | 1.89e-01 | 0.116 |
| 6474 | SHOX2 | P22T-E | Human | Esophagus | ESCC | 4.31e-06 | 1.32e-01 | 0.1236 |
| 6474 | SHOX2 | P23T-E | Human | Esophagus | ESCC | 1.48e-05 | 1.71e-01 | 0.108 |
| 6474 | SHOX2 | P32T-E | Human | Esophagus | ESCC | 8.56e-12 | 2.47e-01 | 0.1666 |
| 6474 | SHOX2 | P39T-E | Human | Esophagus | ESCC | 9.02e-11 | 2.07e-01 | 0.0894 |
| 6474 | SHOX2 | P47T-E | Human | Esophagus | ESCC | 7.90e-03 | 1.04e-01 | 0.1067 |
| 6474 | SHOX2 | P54T-E | Human | Esophagus | ESCC | 3.02e-15 | 3.59e-01 | 0.0975 |
| 6474 | SHOX2 | P62T-E | Human | Esophagus | ESCC | 6.87e-13 | 2.51e-01 | 0.1302 |
| 6474 | SHOX2 | P74T-E | Human | Esophagus | ESCC | 2.69e-06 | 2.00e-01 | 0.1479 |
| 6474 | SHOX2 | P76T-E | Human | Esophagus | ESCC | 7.90e-03 | 9.17e-02 | 0.1207 |
| 6474 | SHOX2 | P84T-E | Human | Esophagus | ESCC | 1.34e-04 | 2.90e-01 | 0.0933 |
| 6474 | SHOX2 | P107T-E | Human | Esophagus | ESCC | 5.52e-09 | 2.11e-01 | 0.171 |
| 6474 | SHOX2 | P128T-E | Human | Esophagus | ESCC | 3.42e-23 | 6.19e-01 | 0.1241 |
| 6474 | SHOX2 | P130T-E | Human | Esophagus | ESCC | 1.88e-11 | 2.27e-01 | 0.1676 |
| 6474 | SHOX2 | ATC13 | Human | Thyroid | ATC | 4.41e-107 | 1.87e+00 | 0.34 |
| 6474 | SHOX2 | ATC5 | Human | Thyroid | ATC | 2.90e-103 | 1.98e+00 | 0.34 |
| Page: 1 |
| Tissue | Expression Dynamics | Abbreviation |
| Thyroid | 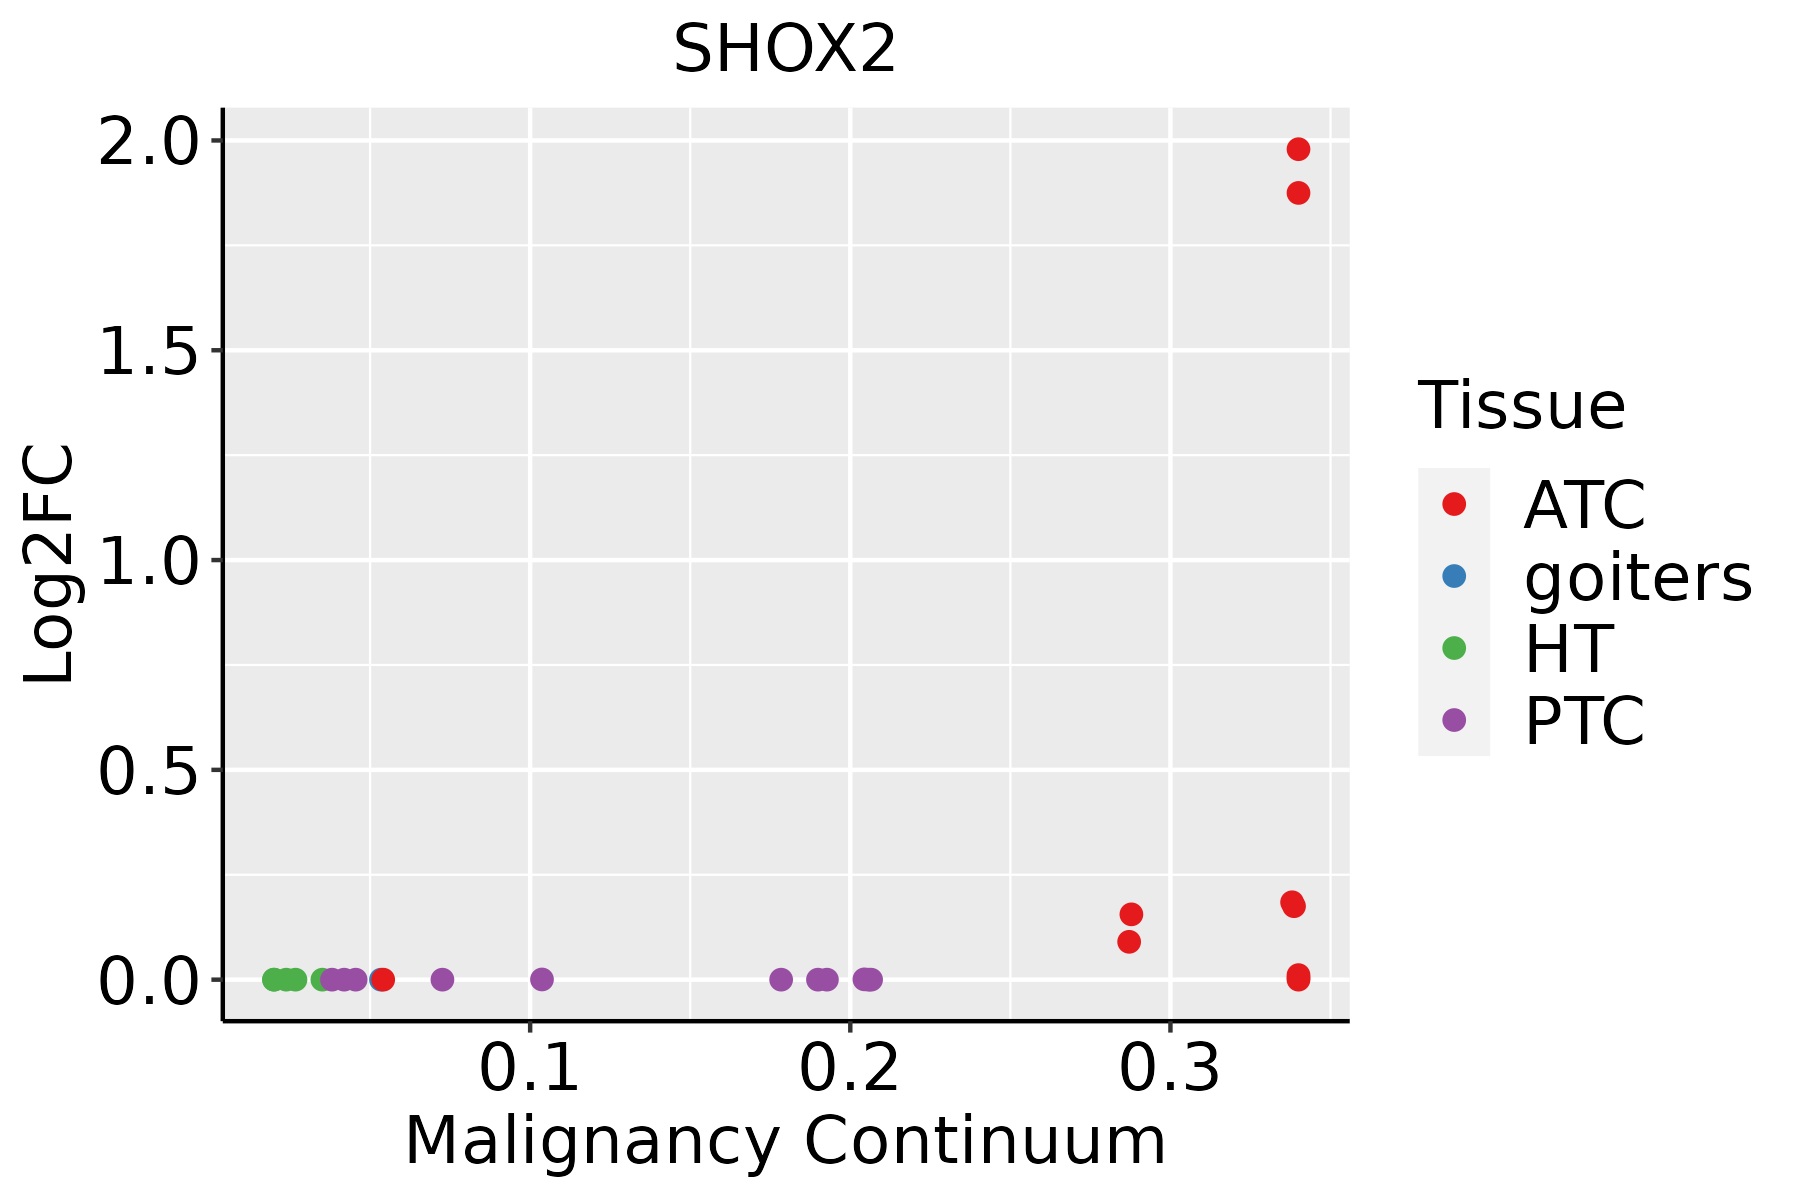 | ATC: Anaplastic thyroid cancer |
| HT: Hashimoto's thyroiditis | ||
| PTC: Papillary thyroid cancer |
| ∗log2FC in expression of this searched gene in stem-like cells from each diseased tissue sample relative to stem-like cells in normal samples in each tissue plotted against the malignancy continuum. Samples are colored based on if they are from different disease stage. |
Top |
Malignant transformation related pathway analysis |
| Find out the enriched GO biological processes and KEGG pathways involved in transition from healthy to precancer to cancer |
| Tissue | Disease Stage | Enriched GO biological Processes |
| Colorectum | AD |  |
| Colorectum | SER |  |
| Colorectum | MSS |  |
| Colorectum | MSI-H |  |
| Colorectum | FAP |  |
| ∗Top 15 enriched GO BP terms are showed in the bar plot of each disease state in each tissue. Each row represents a significant GO biological process which is colored according to the -log10(p.adjust). |
| Page: 1 2 3 4 5 6 7 8 9 |
| GO ID | Tissue | Disease Stage | Description | Gene Ratio | Bg Ratio | pvalue | p.adjust | Count |
| GO:003134623 | Thyroid | ATC | positive regulation of cell projection organization | 186/6293 | 353/18723 | 7.99e-14 | 4.23e-12 | 186 |
| GO:000150332 | Thyroid | ATC | ossification | 206/6293 | 408/18723 | 9.23e-13 | 3.95e-11 | 206 |
| GO:001097523 | Thyroid | ATC | regulation of neuron projection development | 212/6293 | 445/18723 | 4.16e-10 | 1.14e-08 | 212 |
| GO:000164932 | Thyroid | ATC | osteoblast differentiation | 122/6293 | 229/18723 | 6.04e-10 | 1.60e-08 | 122 |
| GO:006156423 | Thyroid | ATC | axon development | 220/6293 | 467/18723 | 6.85e-10 | 1.80e-08 | 220 |
| GO:000740919 | Thyroid | ATC | axonogenesis | 197/6293 | 418/18723 | 5.09e-09 | 1.13e-07 | 197 |
| GO:001072022 | Thyroid | ATC | positive regulation of cell development | 146/6293 | 298/18723 | 2.36e-08 | 4.56e-07 | 146 |
| GO:005076922 | Thyroid | ATC | positive regulation of neurogenesis | 112/6293 | 225/18723 | 3.53e-07 | 5.21e-06 | 112 |
| GO:005076723 | Thyroid | ATC | regulation of neurogenesis | 168/6293 | 364/18723 | 3.73e-07 | 5.48e-06 | 168 |
| GO:005077213 | Thyroid | ATC | positive regulation of axonogenesis | 48/6293 | 79/18723 | 6.89e-07 | 9.35e-06 | 48 |
| GO:006034813 | Thyroid | ATC | bone development | 102/6293 | 205/18723 | 1.18e-06 | 1.52e-05 | 102 |
| GO:006053724 | Thyroid | ATC | muscle tissue development | 181/6293 | 403/18723 | 1.27e-06 | 1.62e-05 | 181 |
| GO:005077011 | Thyroid | ATC | regulation of axonogenesis | 80/6293 | 154/18723 | 1.95e-06 | 2.34e-05 | 80 |
| GO:005196014 | Thyroid | ATC | regulation of nervous system development | 195/6293 | 443/18723 | 2.62e-06 | 3.06e-05 | 195 |
| GO:000176317 | Thyroid | ATC | morphogenesis of a branching structure | 96/6293 | 196/18723 | 5.68e-06 | 6.04e-05 | 96 |
| GO:005196221 | Thyroid | ATC | positive regulation of nervous system development | 126/6293 | 272/18723 | 8.17e-06 | 8.27e-05 | 126 |
| GO:001470622 | Thyroid | ATC | striated muscle tissue development | 168/6293 | 384/18723 | 1.91e-05 | 1.73e-04 | 168 |
| GO:000320512 | Thyroid | ATC | cardiac chamber development | 79/6293 | 161/18723 | 3.39e-05 | 2.80e-04 | 79 |
| GO:0060349 | Thyroid | ATC | bone morphogenesis | 50/6293 | 93/18723 | 4.87e-05 | 3.88e-04 | 50 |
| GO:004269216 | Thyroid | ATC | muscle cell differentiation | 165/6293 | 384/18723 | 7.17e-05 | 5.46e-04 | 165 |
| Page: 1 2 3 |
| Pathway ID | Tissue | Disease Stage | Description | Gene Ratio | Bg Ratio | pvalue | p.adjust | qvalue | Count |
| Page: 1 |
Top |
Cell-cell communication analysis |
| Identification of potential cell-cell interactions between two cell types and their ligand-receptor pairs for different disease states |
| Ligand | Receptor | LRpair | Pathway | Tissue | Disease Stage |
| Page: 1 |
Top |
Single-cell gene regulatory network inference analysis |
| Find out the significant the regulons (TFs) and the target genes of each regulon across cell types for different disease states |
| TF | Cell Type | Tissue | Disease Stage | Target Gene | RSS | Regulon Activity |
| SHOX2 | ECM | Breast | ADJ | PLK3,PIWIL2,TNN, etc. | 4.97e-03 |  |
| SHOX2 | INCAF | Breast | Healthy | PLK3,PIWIL2,TNN, etc. | 1.16e-01 |  |
| SHOX2 | ECM | Breast | IDC | PLK3,PIWIL2,TNN, etc. | 2.50e-01 |  |
| SHOX2 | LYMEND | Breast | IDC | PLK3,PIWIL2,TNN, etc. | 1.61e-02 | |
| SHOX2 | LYMEND | Breast | Precancer | PLK3,PIWIL2,TNN, etc. | 2.61e-02 |  |
| SHOX2 | ECM | Breast | Precancer | PLK3,PIWIL2,TNN, etc. | 3.20e-02 | |
| SHOX2 | FIB | Cervix | N_HPV | MAMDC2,ZNF511,HES1, etc. | -2.22e-16 |  |
| SHOX2 | INCAF | Esophagus | ESCC | RSRC1,CNTN1,COL3A1, etc. | 3.01e-01 |  |
| SHOX2 | MYOFIB | Esophagus | ESCC | RSRC1,CNTN1,COL3A1, etc. | 2.76e-01 | |
| SHOX2 | INCAF | Oral cavity | NEOLP | SCARF2,RP11-379H18.1,CYS1, etc. | 7.69e-01 |  |
| ∗The dot plots of a searched regulon are shown for all cell subpopulations in each disease state of each tissue based on the regulon specific score inferred using pySCENIC and by calculating the average expression. |
| Page: 1 2 3 4 |
Top |
Somatic mutation of malignant transformation related genes |
| Annotation of somatic variants for genes involved in malignant transformation |
| Hugo Symbol | Variant Class | Variant Classification | dbSNP RS | HGVSc | HGVSp | HGVSp Short | SWISSPROT | BIOTYPE | SIFT | PolyPhen | Tumor Sample Barcode | Tissue | Histology | Sex | Age | Stage | Therapy Types | Drugs | Outcome |
| SHOX2 | SNV | Missense_Mutation | rs753586895 | c.1043N>G | p.Lys348Arg | p.K348R | O60902 | protein_coding | tolerated(0.1) | probably_damaging(0.915) | TCGA-D8-A1JK-01 | Breast | breast invasive carcinoma | Female | >=65 | I/II | Unknown | Unknown | SD |
| SHOX2 | SNV | Missense_Mutation | c.1005N>C | p.Lys335Asn | p.K335N | O60902 | protein_coding | deleterious(0) | possibly_damaging(0.857) | TCGA-D8-A27G-01 | Breast | breast invasive carcinoma | Female | >=65 | I/II | Unknown | Unknown | SD | |
| SHOX2 | SNV | Missense_Mutation | c.581N>A | p.Arg194Gln | p.R194Q | O60902 | protein_coding | deleterious(0) | probably_damaging(0.992) | TCGA-AA-3492-01 | Colorectum | colon adenocarcinoma | Female | >=65 | I/II | Unknown | Unknown | SD | |
| SHOX2 | SNV | Missense_Mutation | novel | c.780N>G | p.Ser260Arg | p.S260R | O60902 | protein_coding | tolerated(0.08) | possibly_damaging(0.808) | TCGA-CA-6717-01 | Colorectum | colon adenocarcinoma | Male | <65 | I/II | Chemotherapy | oxaliplatin | CR |
| SHOX2 | SNV | Missense_Mutation | c.709N>G | p.Gln237Glu | p.Q237E | O60902 | protein_coding | tolerated(0.14) | benign(0.293) | TCGA-CI-6623-01 | Colorectum | rectum adenocarcinoma | Male | <65 | I/II | Unknown | Unknown | SD | |
| SHOX2 | SNV | Missense_Mutation | rs747319392 | c.452N>T | p.Ala151Val | p.A151V | O60902 | protein_coding | tolerated(0.53) | benign(0.012) | TCGA-F5-6814-01 | Colorectum | rectum adenocarcinoma | Male | <65 | I/II | Unknown | Unknown | SD |
| SHOX2 | SNV | Missense_Mutation | novel | c.38N>C | p.Asp13Ala | p.D13A | O60902 | protein_coding | deleterious_low_confidence(0) | probably_damaging(0.997) | TCGA-A5-A0G2-01 | Endometrium | uterine corpus endometrioid carcinoma | Female | <65 | III/IV | Unknown | Unknown | SD |
| SHOX2 | SNV | Missense_Mutation | novel | c.988N>A | p.Ala330Thr | p.A330T | O60902 | protein_coding | tolerated(0.05) | probably_damaging(0.994) | TCGA-A5-A2K3-01 | Endometrium | uterine corpus endometrioid carcinoma | Female | >=65 | I/II | Chemotherapy | carboplatin | SD |
| SHOX2 | SNV | Missense_Mutation | c.568N>A | p.Asp190Asn | p.D190N | O60902 | protein_coding | deleterious(0) | probably_damaging(0.999) | TCGA-A5-A2K5-01 | Endometrium | uterine corpus endometrioid carcinoma | Female | >=65 | I/II | Unknown | Unknown | SD | |
| SHOX2 | SNV | Missense_Mutation | novel | c.456N>C | p.Lys152Asn | p.K152N | O60902 | protein_coding | deleterious(0.05) | benign(0.098) | TCGA-AJ-A3EL-01 | Endometrium | uterine corpus endometrioid carcinoma | Female | <65 | I/II | Unknown | Unknown | SD |
| Page: 1 2 3 4 5 |
Top |
Related drugs of malignant transformation related genes |
| Identification of chemicals and drugs interact with genes involved in malignant transfromation |
| (DGIdb 4.0) |
| Entrez ID | Symbol | Category | Interaction Types | Drug Claim Name | Drug Name | PMIDs |
| Page: 1 |

Copyright 2023-Present -The University of Texas Health Science Center at Houston |