Schematic overview of the cellular and molecular mechanisms involved in the cancer progression, including the proposed cellular and molecular mechanisms in cancer cells trajectory. AT1: alveolar type 1 cells; AT2: alveolar type 2 cells; AAH: atypical adenomatous hyperplasia; AIS: adenocarcinoma in situ; MIA: minimally invasive adenocarcinoma; IA: invasive adenocarcinoma; EMT: epithelial-mesenchymal transition

Home

Download

Statistics

Help

Contact

Center for Computational Systems Medicine
leaf

Gene summary

leaf

Malignant transformation analysis

leaf

Malignant transformation related pathway analysis

leaf

Cell-cell communication analysis

leaf

Single-cell gene regulatory network inference analysis

leaf

Somatic mutation of malignant transformation related genes

leaf

Related drugs of malignant transformation related genes

Gene: SHOC2

Gene summary for SHOC2

check button Gene summary.

Gene informationSpeciesHuman
Gene symbol

SHOC2

Gene ID

8036

Gene nameSHOC2 leucine rich repeat scaffold protein
Gene AliasNSLH1
Cytomap10q25.2
Gene Typeprotein-coding
GO ID

GO:0007154

UniProtAcc

Q9UQ13


Top

Malignant transformation analysis

check button Identification of the aberrant gene expression in precancerous and cancerous lesions by comparing the gene expression of stem-like cells in diseased tissues with normal stem cells
check button Malignant transformation involving gene list.
Entrez IDSymbolReplicatesSpeciesOrganTissueAdj P-valueLog2FCMalignancy
8036SHOC2LZE4THumanEsophagusESCC2.16e-154.32e-010.0811
8036SHOC2LZE5THumanEsophagusESCC2.08e-083.33e-010.0514
8036SHOC2LZE7THumanEsophagusESCC5.02e-051.67e-010.0667
8036SHOC2LZE8THumanEsophagusESCC3.19e-081.72e-010.067
8036SHOC2LZE20THumanEsophagusESCC2.14e-031.68e-010.0662
8036SHOC2LZE22THumanEsophagusESCC5.31e-042.26e-010.068
8036SHOC2LZE24THumanEsophagusESCC4.54e-164.35e-010.0596
8036SHOC2LZE21THumanEsophagusESCC2.87e-041.95e-010.0655
8036SHOC2LZE6THumanEsophagusESCC1.66e-021.38e-010.0845
8036SHOC2P1T-EHumanEsophagusESCC6.42e-084.58e-010.0875
8036SHOC2P2T-EHumanEsophagusESCC6.12e-172.27e-010.1177
8036SHOC2P4T-EHumanEsophagusESCC1.38e-234.15e-010.1323
8036SHOC2P5T-EHumanEsophagusESCC5.97e-254.33e-010.1327
8036SHOC2P8T-EHumanEsophagusESCC6.86e-294.86e-010.0889
8036SHOC2P9T-EHumanEsophagusESCC1.76e-133.08e-010.1131
8036SHOC2P10T-EHumanEsophagusESCC6.06e-101.37e-010.116
8036SHOC2P11T-EHumanEsophagusESCC2.06e-205.70e-010.1426
8036SHOC2P12T-EHumanEsophagusESCC1.23e-264.54e-010.1122
8036SHOC2P15T-EHumanEsophagusESCC1.03e-142.59e-010.1149
8036SHOC2P16T-EHumanEsophagusESCC6.24e-192.56e-010.1153
Page: 1 2 3 4 5 6 

check button Transcriptomic changes along malignancy continuum.
TissueExpression DynamicsAbbreviation
EsophagusThe image shows the transcriptomic changes along malignancy continuum.log2FC in expression of this searched gene in stem-like cells from each diseased tissue sample relative to stem-like cells in normal samples in each tissue plotted against the malignancy continuum. Samples are colored based on if they are from different disease stage.
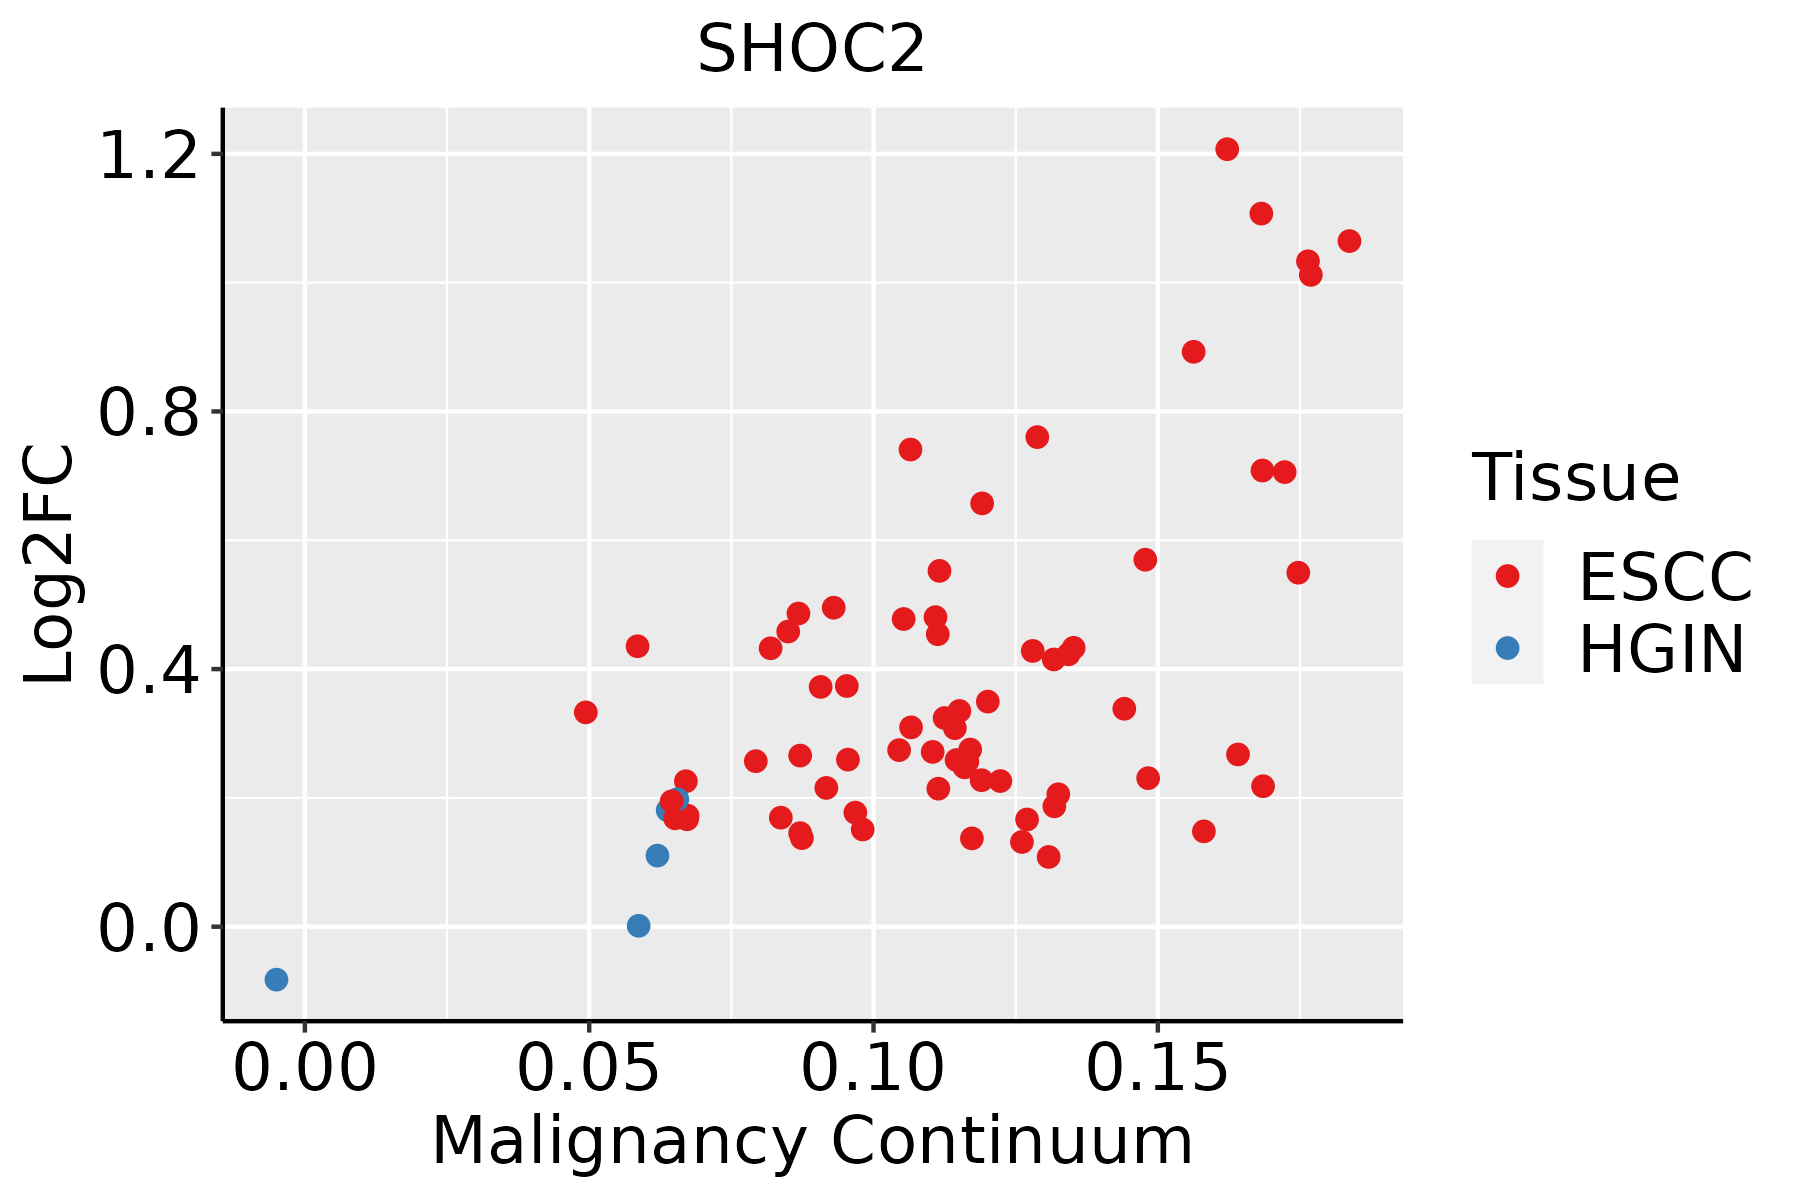
ESCC: Esophageal squamous cell carcinoma
HGIN: High-grade intraepithelial neoplasias
LGIN: Low-grade intraepithelial neoplasias
LiverThe image shows the transcriptomic changes along malignancy continuum.log2FC in expression of this searched gene in stem-like cells from each diseased tissue sample relative to stem-like cells in normal samples in each tissue plotted against the malignancy continuum. Samples are colored based on if they are from different disease stage.
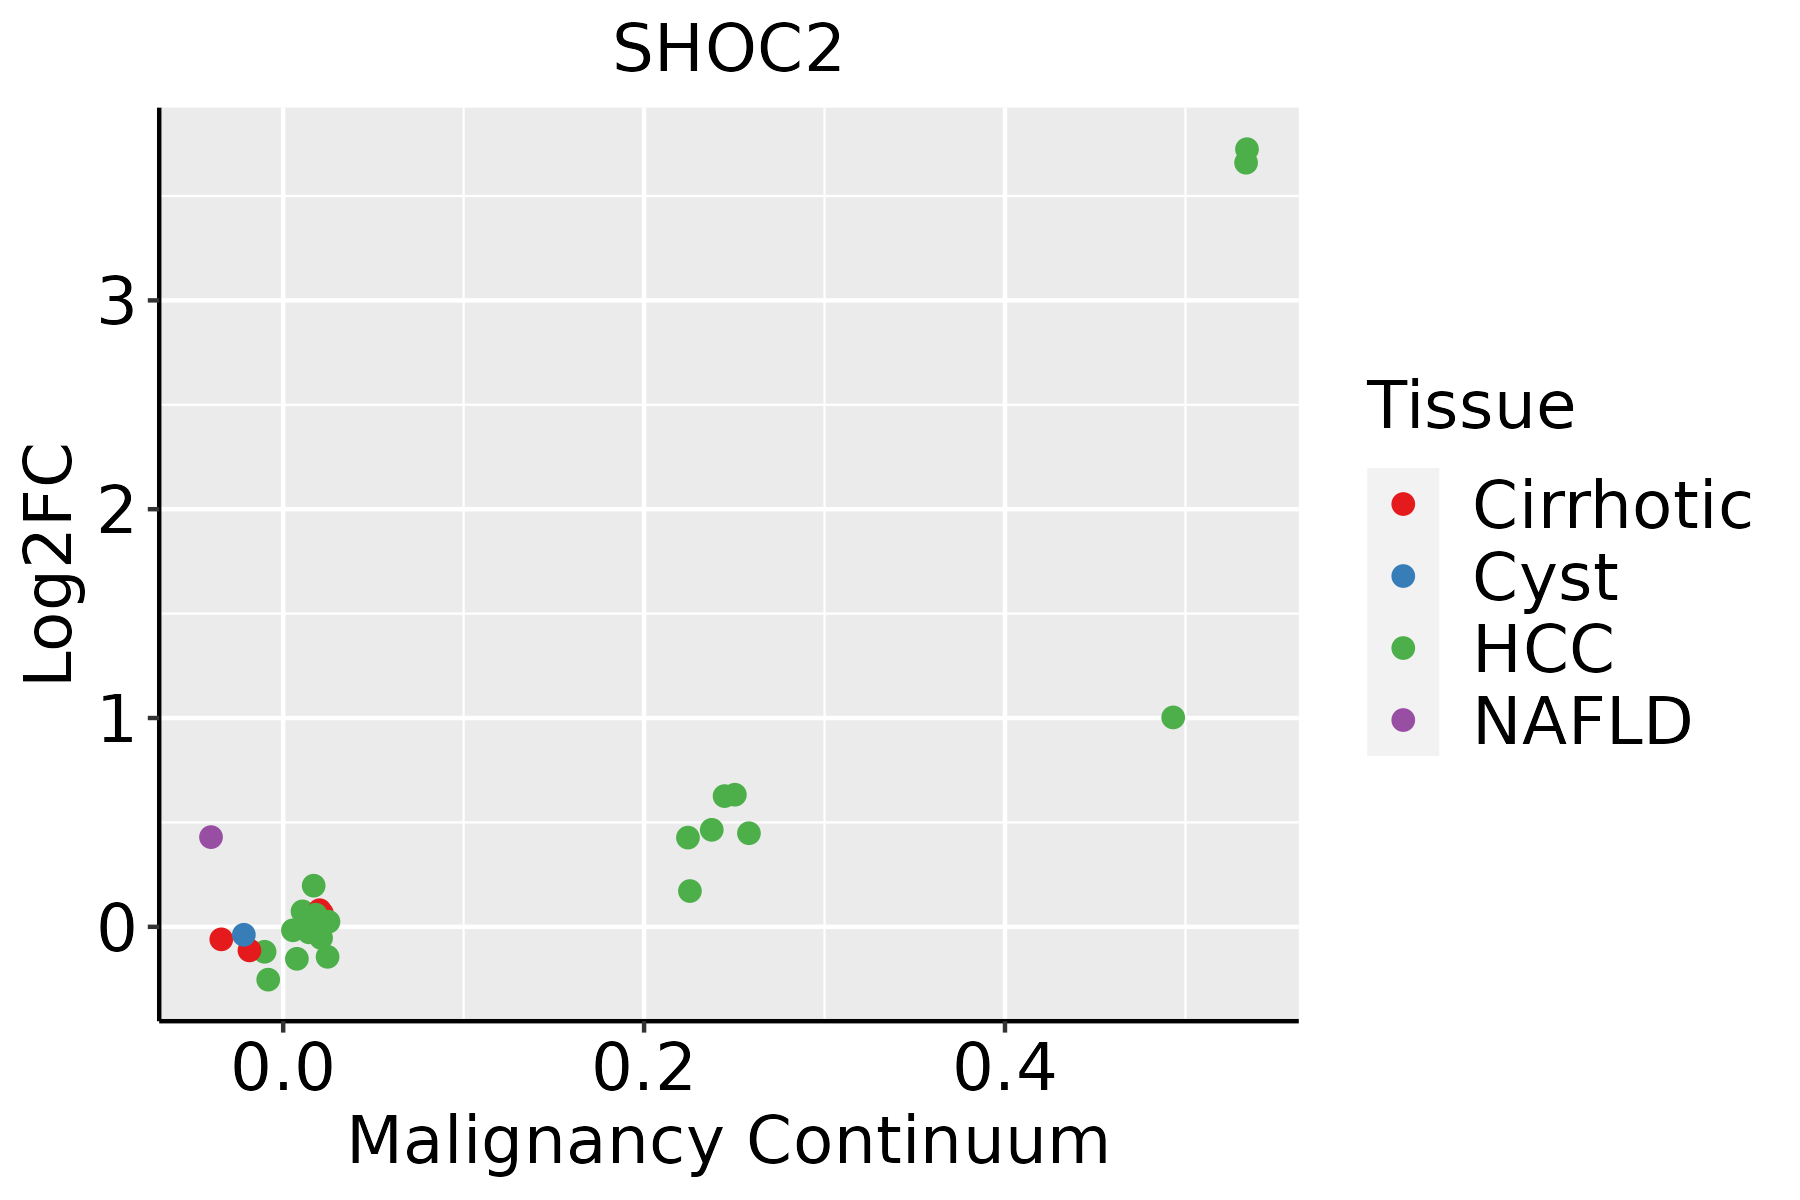
HCC: Hepatocellular carcinoma
NAFLD: Non-alcoholic fatty liver disease
Oral CavityThe image shows the transcriptomic changes along malignancy continuum.log2FC in expression of this searched gene in stem-like cells from each diseased tissue sample relative to stem-like cells in normal samples in each tissue plotted against the malignancy continuum. Samples are colored based on if they are from different disease stage.
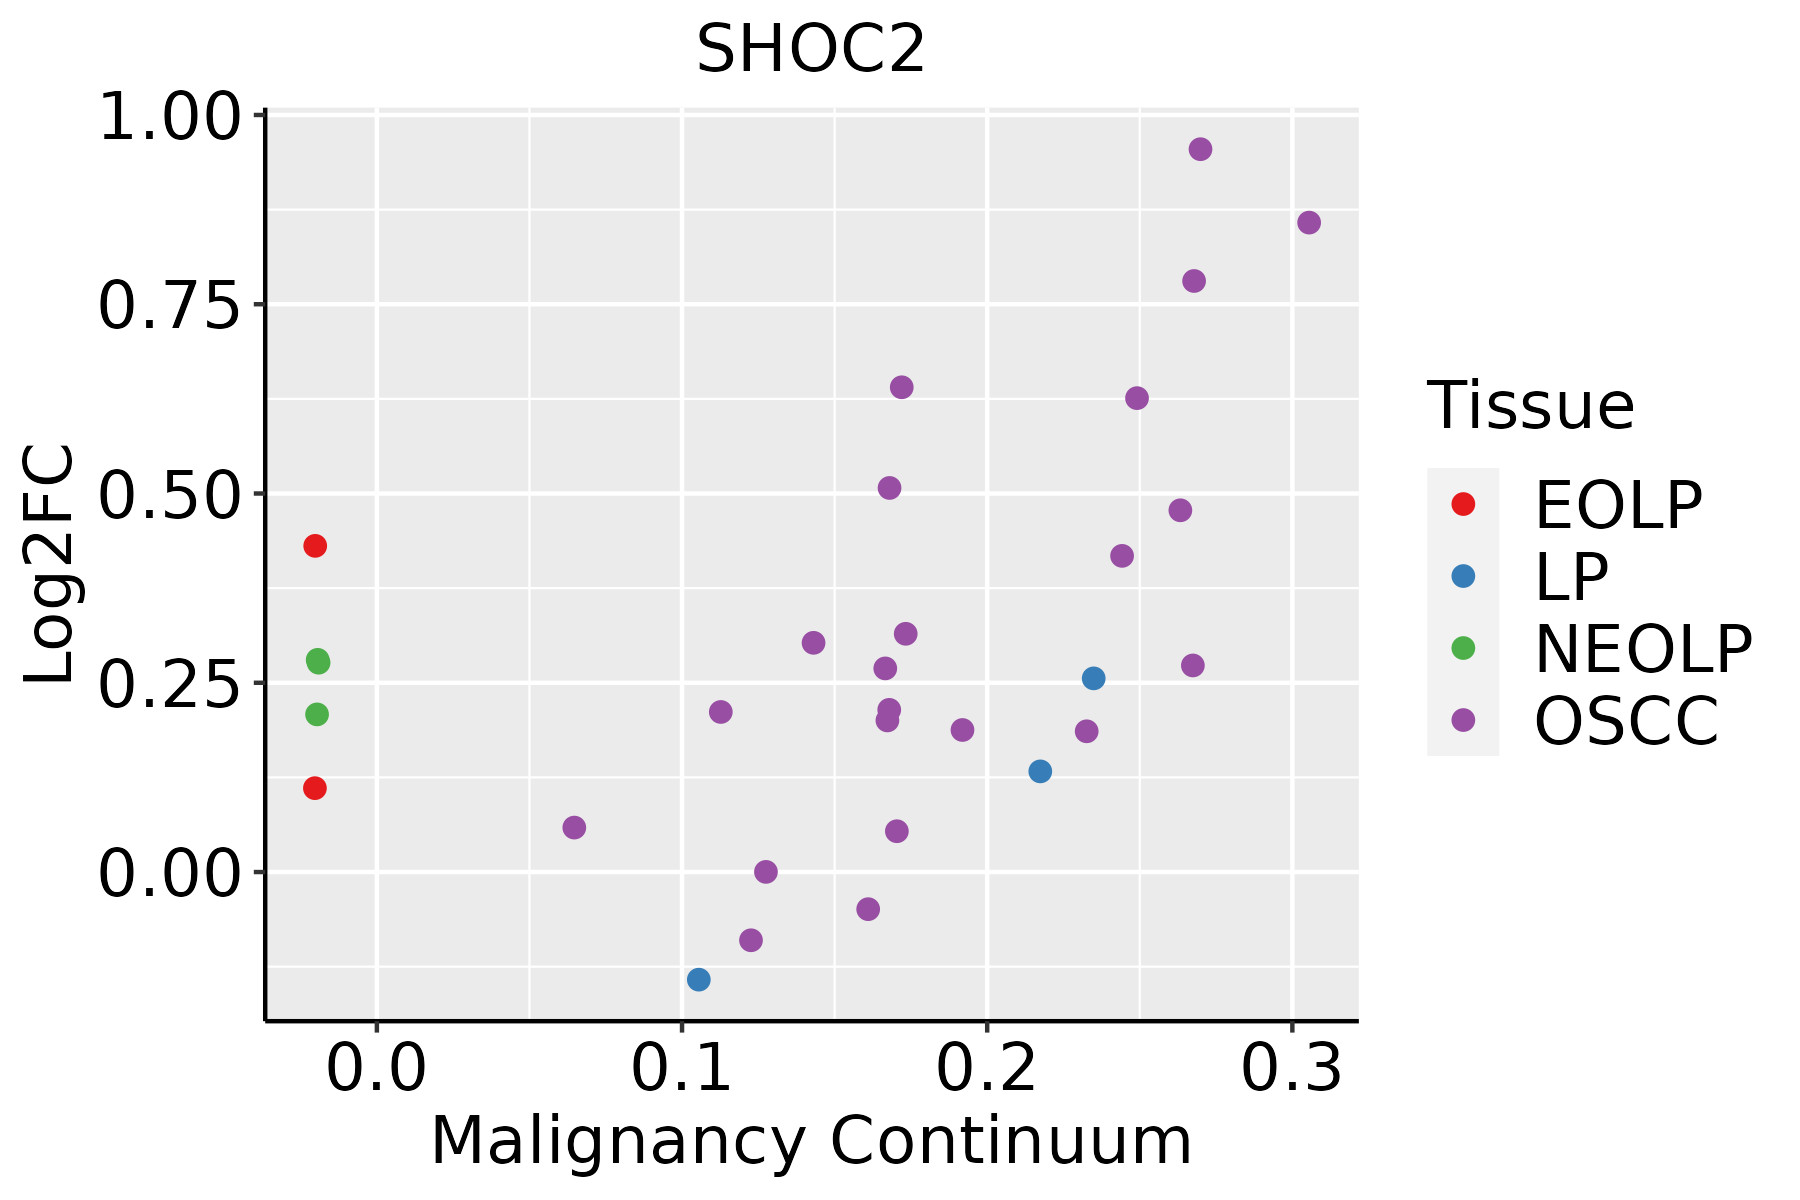
EOLP: Erosive Oral lichen planus
LP: leukoplakia
NEOLP: Non-erosive oral lichen planus
OSCC: Oral squamous cell carcinoma
SkinThe image shows the transcriptomic changes along malignancy continuum.log2FC in expression of this searched gene in stem-like cells from each diseased tissue sample relative to stem-like cells in normal samples in each tissue plotted against the malignancy continuum. Samples are colored based on if they are from different disease stage.
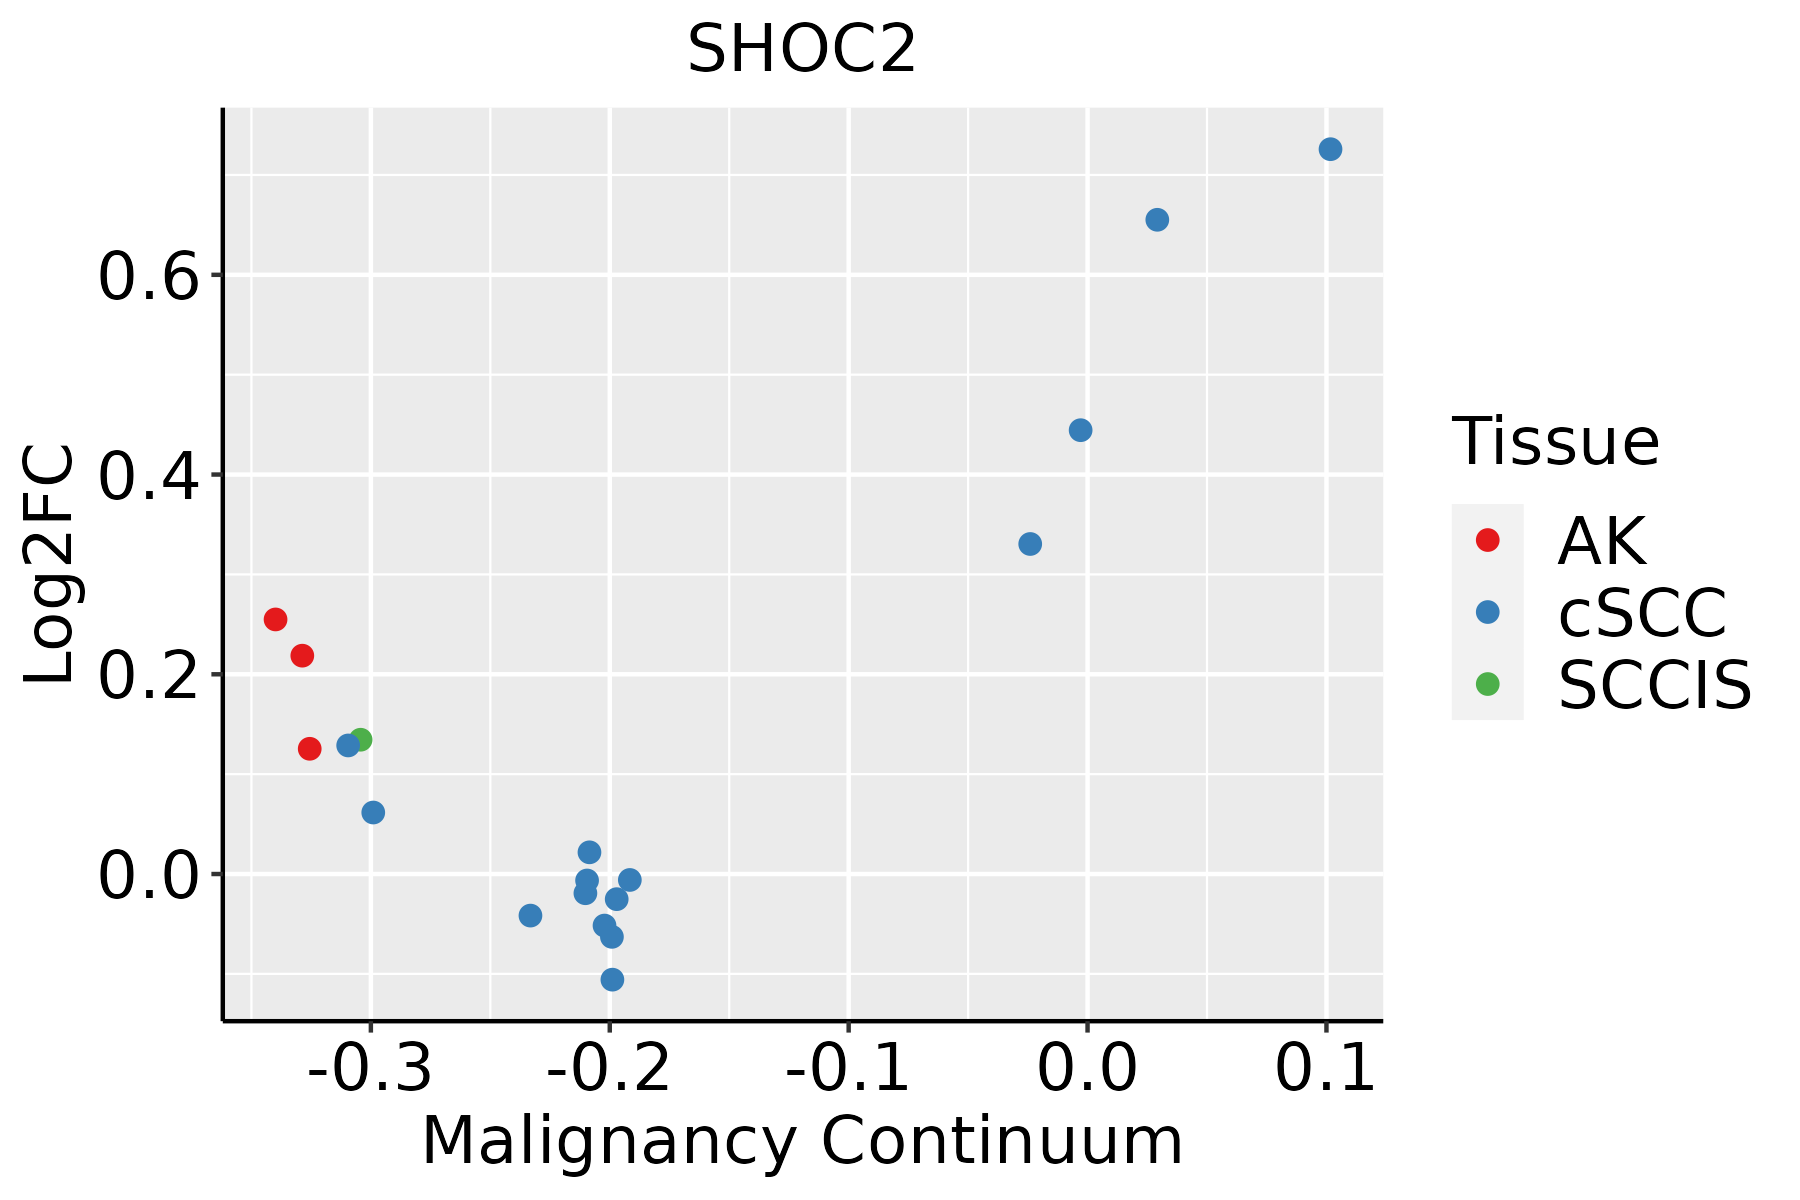
AK: Actinic keratosis
cSCC: Cutaneous squamous cell carcinoma
SCCIS:squamous cell carcinoma in situ
ThyroidThe image shows the transcriptomic changes along malignancy continuum.log2FC in expression of this searched gene in stem-like cells from each diseased tissue sample relative to stem-like cells in normal samples in each tissue plotted against the malignancy continuum. Samples are colored based on if they are from different disease stage.ATC: Anaplastic thyroid cancer
HT: Hashimoto's thyroiditis
PTC: Papillary thyroid cancer
∗log2FC in expression of this searched gene in stem-like cells from each diseased tissue sample relative to stem-like cells in normal samples in each tissue plotted against the malignancy continuum. Samples are colored based on if they are from different disease stage.

Top

Malignant transformation related pathway analysis

check buttonFind out the enriched GO biological processes and KEGG pathways involved in transition from healthy to precancer to cancer
check button Figure of enriched GO biological processes.
TissueDisease StageEnriched GO biological Processes
ColorectumADGO analysis - Figure of enriched GO biological processes: Top 15 enriched GO BP terms are showed in the bar plot of each disease state in each tissue. Each row represents a significant GO biological process which is colored according to the -log10(p.adjust).
ColorectumSERGO analysis - Figure of enriched GO biological processes: Top 15 enriched GO BP terms are showed in the bar plot of each disease state in each tissue. Each row represents a significant GO biological process which is colored according to the -log10(p.adjust).
ColorectumMSSGO analysis - Figure of enriched GO biological processes: Top 15 enriched GO BP terms are showed in the bar plot of each disease state in each tissue. Each row represents a significant GO biological process which is colored according to the -log10(p.adjust).
ColorectumMSI-HGO analysis - Figure of enriched GO biological processes: Top 15 enriched GO BP terms are showed in the bar plot of each disease state in each tissue. Each row represents a significant GO biological process which is colored according to the -log10(p.adjust).
ColorectumFAPGO analysis - Figure of enriched GO biological processes: Top 15 enriched GO BP terms are showed in the bar plot of each disease state in each tissue. Each row represents a significant GO biological process which is colored according to the -log10(p.adjust).
∗Top 15 enriched GO BP terms are showed in the bar plot of each disease state in each tissue. Each row represents a significant GO biological process which is colored according to the -log10(p.adjust).
Page: 1 2 3 4 5 6 7 8 9 

check button Enriched GO biological processes.
GO IDTissueDisease StageDescriptionGene RatioBg Ratiopvaluep.adjustCount
GO:000726510EsophagusESCCRas protein signal transduction201/8552337/187231.44e-072.30e-06201
GO:00465789EsophagusESCCregulation of Ras protein signal transduction106/8552189/187232.49e-031.08e-02106
GO:005105610EsophagusESCCregulation of small GTPase mediated signal transduction157/8552302/187231.55e-024.98e-02157
GO:000726511LiverCirrhoticRas protein signal transduction119/4634337/187238.16e-061.22e-04119
GO:000726521LiverHCCRas protein signal transduction187/7958337/187238.89e-071.35e-05187
GO:004657811LiverHCCregulation of Ras protein signal transduction100/7958189/187232.42e-031.18e-02100
GO:00072659Oral cavityOSCCRas protein signal transduction185/7305337/187231.95e-094.60e-08185
GO:00465788Oral cavityOSCCregulation of Ras protein signal transduction90/7305189/187239.58e-033.40e-0290
GO:000726522Oral cavityEOLPRas protein signal transduction74/2218337/187238.76e-083.09e-0674
GO:00510569Oral cavityEOLPregulation of small GTPase mediated signal transduction51/2218302/187235.67e-032.92e-0251
GO:000726531Oral cavityNEOLPRas protein signal transduction71/2005337/187231.60e-087.27e-0771
GO:004657815Oral cavityNEOLPregulation of Ras protein signal transduction36/2005189/187234.30e-043.92e-0336
GO:005105614Oral cavityNEOLPregulation of small GTPase mediated signal transduction49/2005302/187232.04e-031.36e-0249
GO:000726523SkincSCCRas protein signal transduction132/4864337/187236.17e-081.57e-06132
GO:000726519ThyroidPTCRas protein signal transduction162/5968337/187233.16e-101.02e-08162
GO:005105617ThyroidPTCregulation of small GTPase mediated signal transduction132/5968302/187239.26e-061.04e-04132
GO:004657817ThyroidPTCregulation of Ras protein signal transduction88/5968189/187231.62e-051.70e-0488
GO:000726524ThyroidATCRas protein signal transduction172/6293337/187232.25e-117.96e-10172
GO:005105618ThyroidATCregulation of small GTPase mediated signal transduction141/6293302/187231.43e-061.77e-05141
GO:004657818ThyroidATCregulation of Ras protein signal transduction94/6293189/187233.12e-063.55e-0594
Page: 1 

check button Enriched KEGG pathways.
Pathway IDTissueDisease StageDescriptionGene RatioBg Ratiopvaluep.adjustqvalueCount
Page: 1 

Top

Cell-cell communication analysis

check buttonIdentification of potential cell-cell interactions between two cell types and their ligand-receptor pairs for different disease states
LigandReceptorLRpairPathwayTissueDisease Stage
Page: 1 

Top

Single-cell gene regulatory network inference analysis

check buttonFind out the significant the regulons (TFs) and the target genes of each regulon across cell types for different disease states
TFCell TypeTissueDisease StageTarget GeneRSSRegulon Activity
∗The dot plots of a searched regulon are shown for all cell subpopulations in each disease state of each tissue based on the regulon specific score inferred using pySCENIC and by calculating the average expression.
Page: 1 

Top

Somatic mutation of malignant transformation related genes

check buttonAnnotation of somatic variants for genes involved in malignant transformation
Hugo SymbolVariant ClassVariant ClassificationdbSNP RSHGVScHGVSpHGVSp ShortSWISSPROTBIOTYPESIFTPolyPhenTumor Sample BarcodeTissueHistologySexAgeStageTherapy TypesDrugsOutcome
SHOC2SNVMissense_Mutationc.1522C>Tp.His508Tyrp.H508YQ9UQ13protein_codingtolerated(1)benign(0.003)TCGA-AC-A23H-01Breastbreast invasive carcinomaFemale>=65I/IIUnknownUnknownPD
SHOC2SNVMissense_Mutationnovelc.539N>Cp.Lys180Thrp.K180TQ9UQ13protein_codingdeleterious(0)probably_damaging(0.998)TCGA-AN-A046-01Breastbreast invasive carcinomaFemale>=65I/IIUnknownUnknownSD
SHOC2SNVMissense_Mutationnovelc.1677N>Tp.Gln559Hisp.Q559HQ9UQ13protein_codingdeleterious(0.01)benign(0.012)TCGA-AN-A046-01Breastbreast invasive carcinomaFemale>=65I/IIUnknownUnknownSD
SHOC2SNVMissense_Mutationnovelc.692N>Tp.Pro231Leup.P231LQ9UQ13protein_codingdeleterious(0)probably_damaging(0.985)TCGA-B6-A0RG-01Breastbreast invasive carcinomaFemale<65I/IIUnknownUnknownSD
SHOC2SNVMissense_Mutationnovelc.1064N>Gp.Ser355Cysp.S355CQ9UQ13protein_codingtolerated(0.26)benign(0)TCGA-C8-A8HQ-01Breastbreast invasive carcinomaFemale<65I/IIUnknownUnknownSD
SHOC2SNVMissense_Mutationc.788T>Cp.Ile263Thrp.I263TQ9UQ13protein_codingdeleterious(0)possibly_damaging(0.534)TCGA-E9-A22G-01Breastbreast invasive carcinomaFemale<65I/IIChemotherapydoxorubicinSD
SHOC2insertionFrame_Shift_Insnovelc.129dupTp.Lys44Terp.K44*Q9UQ13protein_codingTCGA-A8-A08J-01Breastbreast invasive carcinomaFemale<65III/IVUnknownUnknownPD
SHOC2SNVMissense_Mutationnovelc.863G>Ap.Arg288Hisp.R288HQ9UQ13protein_codingdeleterious(0.03)possibly_damaging(0.9)TCGA-2W-A8YY-01Cervixcervical & endocervical cancerFemale<65I/IIChemotherapycisplatinCR
SHOC2SNVMissense_Mutationnovelc.1509G>Tp.Glu503Aspp.E503DQ9UQ13protein_codingdeleterious(0.05)possibly_damaging(0.469)TCGA-2W-A8YY-01Cervixcervical & endocervical cancerFemale<65I/IIChemotherapycisplatinCR
SHOC2SNVMissense_Mutationnovelc.1638N>Ap.Met546Ilep.M546IQ9UQ13protein_codingdeleterious(0.01)possibly_damaging(0.576)TCGA-DG-A2KJ-01Cervixcervical & endocervical cancerFemale<65III/IVChemotherapycisplatinSD
Page: 1 2 3 4 5 6 

Top

Related drugs of malignant transformation related genes

check buttonIdentification of chemicals and drugs interact with genes involved in malignant transfromation
(DGIdb 4.0)
Entrez IDSymbolCategoryInteraction TypesDrug Claim NameDrug NamePMIDs
Page: 1