| Tissue | Expression Dynamics | Abbreviation |
| Colorectum (GSE201348) |  | FAP: Familial adenomatous polyposis |
| CRC: Colorectal cancer |
| Colorectum (HTA11) |  | AD: Adenomas |
| SER: Sessile serrated lesions |
| MSI-H: Microsatellite-high colorectal cancer |
| MSS: Microsatellite stable colorectal cancer |
| Esophagus |  | ESCC: Esophageal squamous cell carcinoma |
| HGIN: High-grade intraepithelial neoplasias |
| LGIN: Low-grade intraepithelial neoplasias |
| Liver | 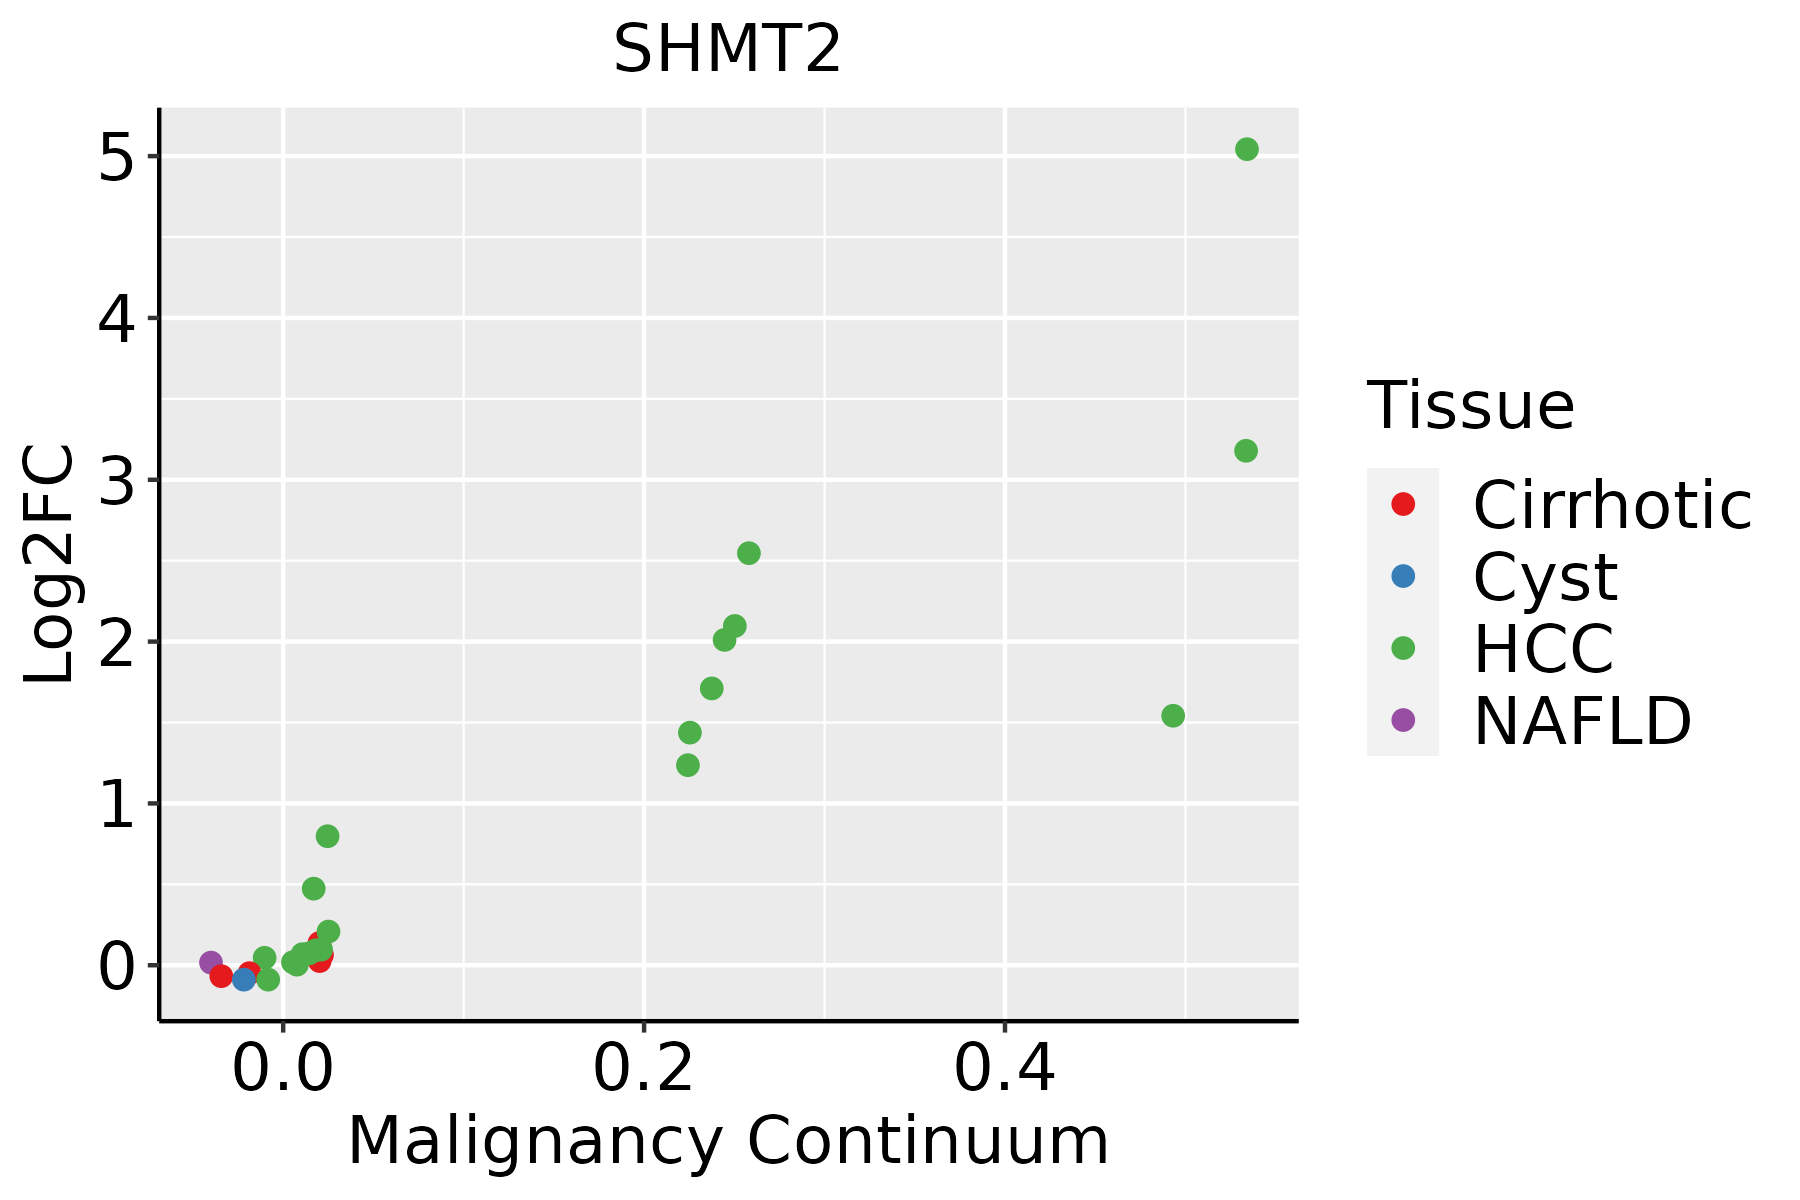 | HCC: Hepatocellular carcinoma |
| NAFLD: Non-alcoholic fatty liver disease |
| Oral Cavity |  | EOLP: Erosive Oral lichen planus |
| LP: leukoplakia |
| NEOLP: Non-erosive oral lichen planus |
| OSCC: Oral squamous cell carcinoma |
| Skin |  | AK: Actinic keratosis |
| cSCC: Cutaneous squamous cell carcinoma |
| SCCIS:squamous cell carcinoma in situ |
| Thyroid |  | ATC: Anaplastic thyroid cancer |
| HT: Hashimoto's thyroiditis |
| PTC: Papillary thyroid cancer |
| GO ID | Tissue | Disease Stage | Description | Gene Ratio | Bg Ratio | pvalue | p.adjust | Count |
| GO:0046034 | Colorectum | AD | ATP metabolic process | 142/3918 | 277/18723 | 2.64e-29 | 8.26e-26 | 142 |
| GO:0006091 | Colorectum | AD | generation of precursor metabolites and energy | 209/3918 | 490/18723 | 3.17e-28 | 6.61e-25 | 209 |
| GO:0009060 | Colorectum | AD | aerobic respiration | 108/3918 | 189/18723 | 9.14e-28 | 1.43e-24 | 108 |
| GO:0045333 | Colorectum | AD | cellular respiration | 119/3918 | 230/18723 | 3.21e-25 | 4.02e-22 | 119 |
| GO:0006119 | Colorectum | AD | oxidative phosphorylation | 83/3918 | 141/18723 | 7.95e-23 | 8.30e-20 | 83 |
| GO:0015980 | Colorectum | AD | energy derivation by oxidation of organic compounds | 143/3918 | 318/18723 | 2.78e-22 | 2.49e-19 | 143 |
| GO:0072521 | Colorectum | AD | purine-containing compound metabolic process | 153/3918 | 416/18723 | 4.34e-14 | 1.01e-11 | 153 |
| GO:0044282 | Colorectum | AD | small molecule catabolic process | 118/3918 | 376/18723 | 1.05e-06 | 3.55e-05 | 118 |
| GO:0006417 | Colorectum | AD | regulation of translation | 141/3918 | 468/18723 | 1.32e-06 | 4.22e-05 | 141 |
| GO:0043467 | Colorectum | AD | regulation of generation of precursor metabolites and energy | 49/3918 | 130/18723 | 8.33e-06 | 1.99e-04 | 49 |
| GO:0072522 | Colorectum | AD | purine-containing compound biosynthetic process | 68/3918 | 200/18723 | 1.12e-05 | 2.55e-04 | 68 |
| GO:1903578 | Colorectum | AD | regulation of ATP metabolic process | 34/3918 | 87/18723 | 8.30e-05 | 1.30e-03 | 34 |
| GO:0016054 | Colorectum | AD | organic acid catabolic process | 73/3918 | 240/18723 | 3.20e-04 | 3.81e-03 | 73 |
| GO:0006575 | Colorectum | AD | cellular modified amino acid metabolic process | 59/3918 | 188/18723 | 4.80e-04 | 5.27e-03 | 59 |
| GO:0006730 | Colorectum | AD | one-carbon metabolic process | 18/3918 | 40/18723 | 5.36e-04 | 5.74e-03 | 18 |
| GO:0043648 | Colorectum | AD | dicarboxylic acid metabolic process | 34/3918 | 96/18723 | 7.22e-04 | 7.28e-03 | 34 |
| GO:0046395 | Colorectum | AD | carboxylic acid catabolic process | 70/3918 | 236/18723 | 9.06e-04 | 8.71e-03 | 70 |
| GO:0043457 | Colorectum | AD | regulation of cellular respiration | 20/3918 | 49/18723 | 1.23e-03 | 1.09e-02 | 20 |
| GO:1903715 | Colorectum | AD | regulation of aerobic respiration | 15/3918 | 33/18723 | 1.36e-03 | 1.18e-02 | 15 |
| GO:0006520 | Colorectum | AD | cellular amino acid metabolic process | 81/3918 | 284/18723 | 1.37e-03 | 1.19e-02 | 81 |
| Pathway ID | Tissue | Disease Stage | Description | Gene Ratio | Bg Ratio | pvalue | p.adjust | qvalue | Count |
| hsa01200 | Colorectum | AD | Carbon metabolism | 55/2092 | 115/8465 | 5.53e-08 | 8.42e-07 | 5.37e-07 | 55 |
| hsa00630 | Colorectum | AD | Glyoxylate and dicarboxylate metabolism | 14/2092 | 30/8465 | 7.25e-03 | 2.97e-02 | 1.89e-02 | 14 |
| hsa01230 | Colorectum | AD | Biosynthesis of amino acids | 28/2092 | 75/8465 | 9.99e-03 | 3.89e-02 | 2.48e-02 | 28 |
| hsa012001 | Colorectum | AD | Carbon metabolism | 55/2092 | 115/8465 | 5.53e-08 | 8.42e-07 | 5.37e-07 | 55 |
| hsa006301 | Colorectum | AD | Glyoxylate and dicarboxylate metabolism | 14/2092 | 30/8465 | 7.25e-03 | 2.97e-02 | 1.89e-02 | 14 |
| hsa012301 | Colorectum | AD | Biosynthesis of amino acids | 28/2092 | 75/8465 | 9.99e-03 | 3.89e-02 | 2.48e-02 | 28 |
| hsa012002 | Colorectum | SER | Carbon metabolism | 40/1580 | 115/8465 | 2.77e-05 | 3.41e-04 | 2.47e-04 | 40 |
| hsa012302 | Colorectum | SER | Biosynthesis of amino acids | 23/1580 | 75/8465 | 8.11e-03 | 4.14e-02 | 3.01e-02 | 23 |
| hsa012003 | Colorectum | SER | Carbon metabolism | 40/1580 | 115/8465 | 2.77e-05 | 3.41e-04 | 2.47e-04 | 40 |
| hsa012303 | Colorectum | SER | Biosynthesis of amino acids | 23/1580 | 75/8465 | 8.11e-03 | 4.14e-02 | 3.01e-02 | 23 |
| hsa012004 | Colorectum | MSS | Carbon metabolism | 43/1875 | 115/8465 | 1.37e-04 | 1.17e-03 | 7.19e-04 | 43 |
| hsa012005 | Colorectum | MSS | Carbon metabolism | 43/1875 | 115/8465 | 1.37e-04 | 1.17e-03 | 7.19e-04 | 43 |
| hsa00670 | Colorectum | MSI-H | One carbon pool by folate | 7/797 | 20/8465 | 1.65e-03 | 1.73e-02 | 1.45e-02 | 7 |
| hsa006701 | Colorectum | MSI-H | One carbon pool by folate | 7/797 | 20/8465 | 1.65e-03 | 1.73e-02 | 1.45e-02 | 7 |
| hsa0120023 | Esophagus | ESCC | Carbon metabolism | 79/4205 | 115/8465 | 2.50e-05 | 1.21e-04 | 6.22e-05 | 79 |
| hsa012405 | Esophagus | ESCC | Biosynthesis of cofactors | 97/4205 | 153/8465 | 3.88e-04 | 1.35e-03 | 6.94e-04 | 97 |
| hsa0123023 | Esophagus | ESCC | Biosynthesis of amino acids | 49/4205 | 75/8465 | 4.35e-03 | 1.12e-02 | 5.74e-03 | 49 |
| hsa015232 | Esophagus | ESCC | Antifolate resistance | 22/4205 | 30/8465 | 7.23e-03 | 1.76e-02 | 8.99e-03 | 22 |
| hsa006306 | Esophagus | ESCC | Glyoxylate and dicarboxylate metabolism | 21/4205 | 30/8465 | 1.95e-02 | 4.35e-02 | 2.23e-02 | 21 |
| hsa0120033 | Esophagus | ESCC | Carbon metabolism | 79/4205 | 115/8465 | 2.50e-05 | 1.21e-04 | 6.22e-05 | 79 |
| Hugo Symbol | Variant Class | Variant Classification | dbSNP RS | HGVSc | HGVSp | HGVSp Short | SWISSPROT | BIOTYPE | SIFT | PolyPhen | Tumor Sample Barcode | Tissue | Histology | Sex | Age | Stage | Therapy Types | Drugs | Outcome |
| SHMT2 | SNV | Missense_Mutation | | c.1442G>T | p.Arg481Leu | p.R481L | P34897 | protein_coding | deleterious(0.05) | benign(0.035) | TCGA-AQ-A54N-01 | Breast | breast invasive carcinoma | Female | <65 | I/II | Unknown | Unknown | SD |
| SHMT2 | SNV | Missense_Mutation | | c.814G>A | p.Asp272Asn | p.D272N | P34897 | protein_coding | deleterious(0) | probably_damaging(0.975) | TCGA-BH-A0B9-01 | Breast | breast invasive carcinoma | Female | <65 | I/II | Chemotherapy | cyclophosphamide | SD |
| SHMT2 | SNV | Missense_Mutation | | c.799N>G | p.Pro267Ala | p.P267A | P34897 | protein_coding | deleterious(0) | probably_damaging(0.999) | TCGA-D8-A1J9-01 | Breast | breast invasive carcinoma | Female | <65 | I/II | Unknown | Unknown | SD |
| SHMT2 | SNV | Missense_Mutation | | c.711N>A | p.Met237Ile | p.M237I | P34897 | protein_coding | tolerated(0.24) | benign(0.005) | TCGA-D8-A1JN-01 | Breast | breast invasive carcinoma | Female | >=65 | III/IV | Hormone Therapy | anastrozolum | SD |
| SHMT2 | insertion | Nonsense_Mutation | novel | c.771_772insGTCCATCTTCTTCGAGTCTATGCCCTATAAG | p.Leu258ValfsTer10 | p.L258Vfs*10 | P34897 | protein_coding | | | TCGA-A8-A09W-01 | Breast | breast invasive carcinoma | Female | >=65 | III/IV | Unknown | Unknown | SD |
| SHMT2 | deletion | Frame_Shift_Del | | c.601delA | p.Thr201LeufsTer11 | p.T201Lfs*11 | P34897 | protein_coding | | | TCGA-BH-A0HA-01 | Breast | breast invasive carcinoma | Female | <65 | I/II | Unknown | Unknown | SD |
| SHMT2 | SNV | Missense_Mutation | novel | c.266G>T | p.Gly89Val | p.G89V | P34897 | protein_coding | deleterious(0) | probably_damaging(0.998) | TCGA-EK-A2PL-01 | Cervix | cervical & endocervical cancer | Female | <65 | III/IV | Unknown | Unknown | SD |
| SHMT2 | SNV | Missense_Mutation | | c.328N>C | p.Glu110Gln | p.E110Q | P34897 | protein_coding | tolerated(0.14) | benign(0.21) | TCGA-Q1-A73O-01 | Cervix | cervical & endocervical cancer | Female | <65 | I/II | Chemotherapy | cisplatin | CR |
| SHMT2 | SNV | Missense_Mutation | novel | c.523N>A | p.Gly175Ser | p.G175S | P34897 | protein_coding | deleterious(0) | probably_damaging(1) | TCGA-AA-3877-01 | Colorectum | colon adenocarcinoma | Female | >=65 | I/II | Unknown | Unknown | SD |
| SHMT2 | SNV | Missense_Mutation | | c.1075C>T | p.Arg359Trp | p.R359W | P34897 | protein_coding | deleterious(0) | possibly_damaging(0.609) | TCGA-CK-4951-01 | Colorectum | colon adenocarcinoma | Female | >=65 | I/II | Unknown | Unknown | PD |


