Schematic overview of the cellular and molecular mechanisms involved in the cancer progression, including the proposed cellular and molecular mechanisms in cancer cells trajectory. AT1: alveolar type 1 cells; AT2: alveolar type 2 cells; AAH: atypical adenomatous hyperplasia; AIS: adenocarcinoma in situ; MIA: minimally invasive adenocarcinoma; IA: invasive adenocarcinoma; EMT: epithelial-mesenchymal transition

Home

Download

Statistics

Help

Contact

Center for Computational Systems Medicine
leaf

Gene summary

leaf

Malignant transformation analysis

leaf

Malignant transformation related pathway analysis

leaf

Cell-cell communication analysis

leaf

Single-cell gene regulatory network inference analysis

leaf

Somatic mutation of malignant transformation related genes

leaf

Related drugs of malignant transformation related genes

Gene: SHKBP1

Gene summary for SHKBP1

check button Gene summary.

Gene informationSpeciesHuman
Gene symbol

SHKBP1

Gene ID

92799

Gene nameSH3KBP1 binding protein 1
Gene AliasPP203
Cytomap19q13.2
Gene Typeprotein-coding
GO ID

GO:0007154

UniProtAcc

Q8TBC3


Top

Malignant transformation analysis

check button Identification of the aberrant gene expression in precancerous and cancerous lesions by comparing the gene expression of stem-like cells in diseased tissues with normal stem cells
check button Malignant transformation involving gene list.
Entrez IDSymbolReplicatesSpeciesOrganTissueAdj P-valueLog2FCMalignancy
92799SHKBP1LZE2THumanEsophagusESCC2.43e-044.67e-010.082
92799SHKBP1LZE4THumanEsophagusESCC5.48e-123.32e-010.0811
92799SHKBP1LZE7THumanEsophagusESCC1.01e-185.85e-010.0667
92799SHKBP1LZE8THumanEsophagusESCC6.21e-133.95e-010.067
92799SHKBP1LZE20THumanEsophagusESCC3.43e-062.03e-010.0662
92799SHKBP1LZE22THumanEsophagusESCC3.27e-085.60e-010.068
92799SHKBP1LZE24THumanEsophagusESCC2.21e-337.49e-010.0596
92799SHKBP1LZE6THumanEsophagusESCC6.63e-165.91e-010.0845
92799SHKBP1P1T-EHumanEsophagusESCC4.42e-157.41e-010.0875
92799SHKBP1P2T-EHumanEsophagusESCC4.32e-254.52e-010.1177
92799SHKBP1P4T-EHumanEsophagusESCC6.22e-295.07e-010.1323
92799SHKBP1P5T-EHumanEsophagusESCC1.54e-234.67e-010.1327
92799SHKBP1P8T-EHumanEsophagusESCC5.31e-681.30e+000.0889
92799SHKBP1P9T-EHumanEsophagusESCC1.18e-172.67e-010.1131
92799SHKBP1P10T-EHumanEsophagusESCC2.81e-427.14e-010.116
92799SHKBP1P11T-EHumanEsophagusESCC4.63e-267.10e-010.1426
92799SHKBP1P12T-EHumanEsophagusESCC7.61e-315.23e-010.1122
92799SHKBP1P15T-EHumanEsophagusESCC1.37e-387.53e-010.1149
92799SHKBP1P16T-EHumanEsophagusESCC3.26e-141.89e-010.1153
92799SHKBP1P17T-EHumanEsophagusESCC1.30e-218.47e-010.1278
Page: 1 2 3 4 5 6 

check button Transcriptomic changes along malignancy continuum.
TissueExpression DynamicsAbbreviation
EsophagusThe image shows the transcriptomic changes along malignancy continuum.log2FC in expression of this searched gene in stem-like cells from each diseased tissue sample relative to stem-like cells in normal samples in each tissue plotted against the malignancy continuum. Samples are colored based on if they are from different disease stage.
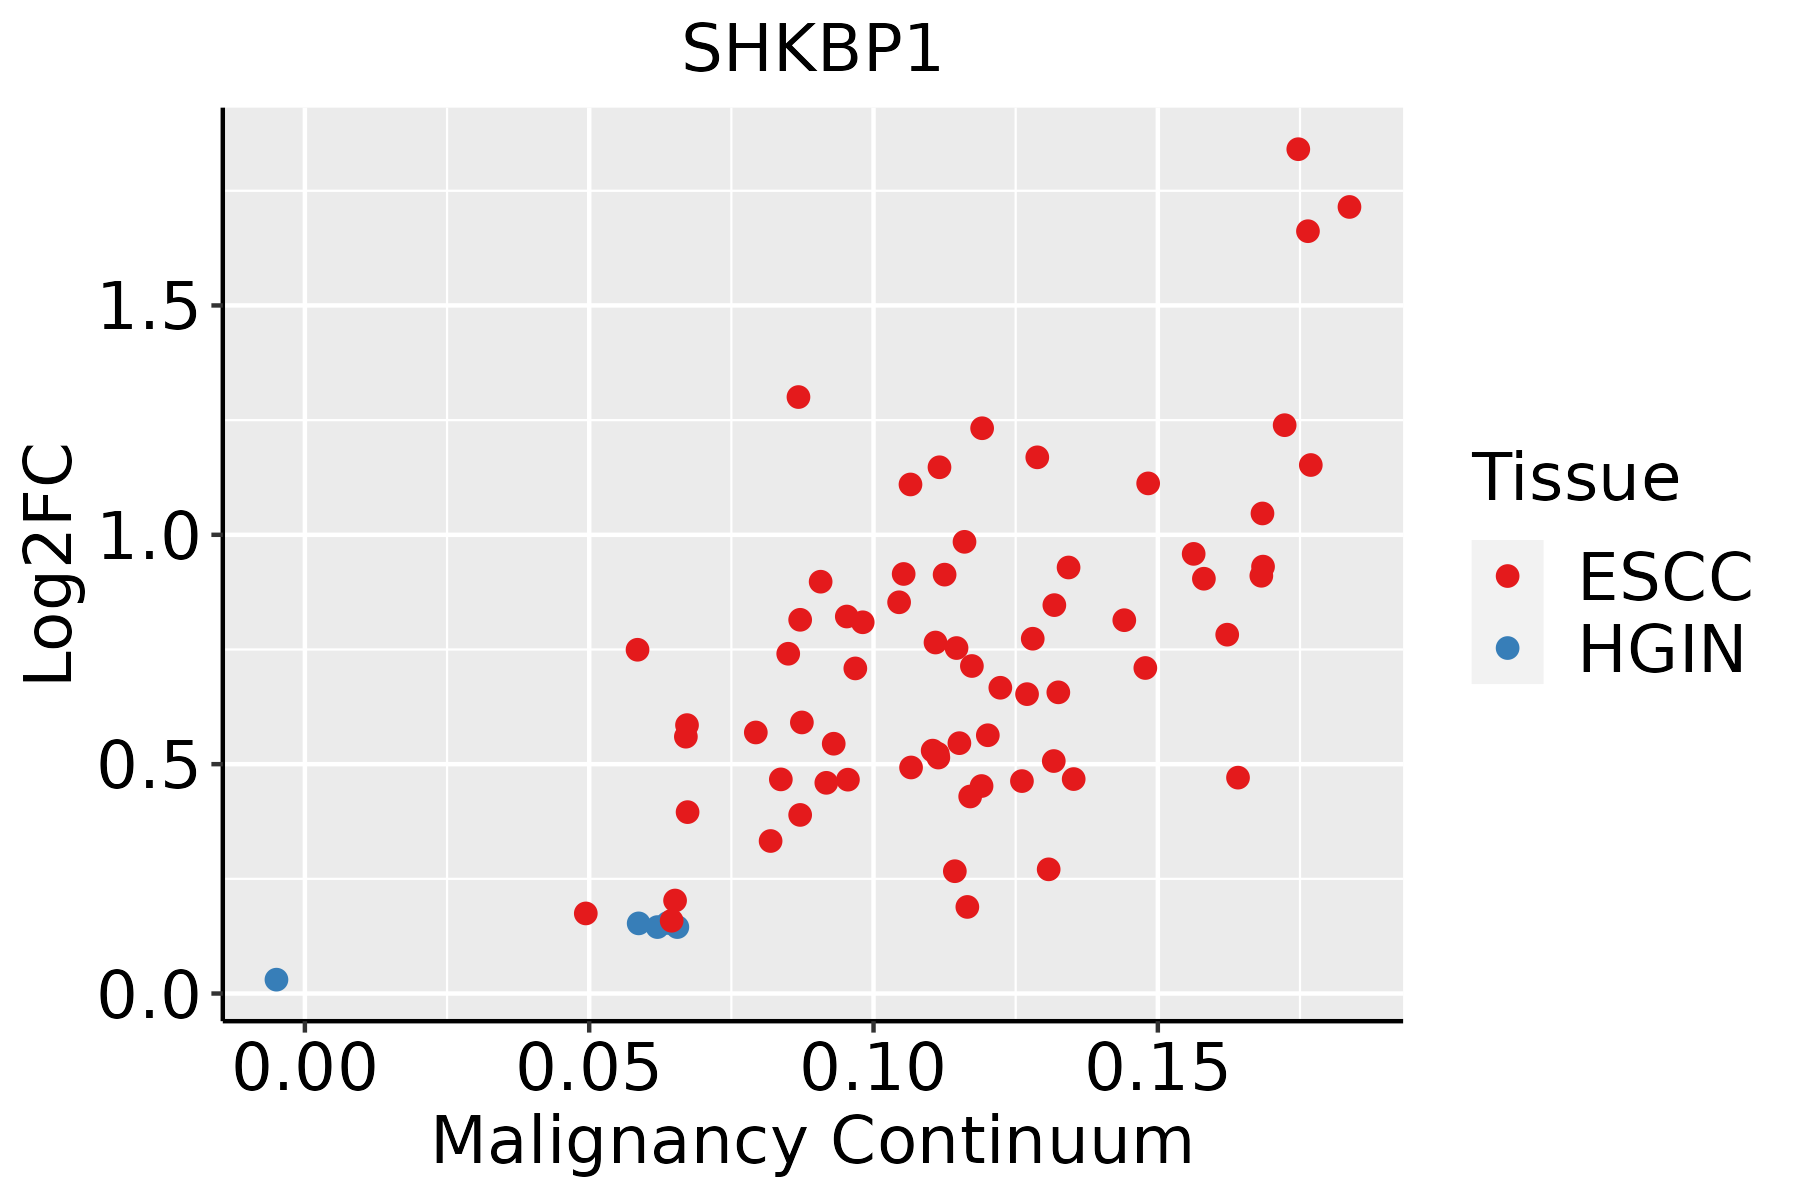
ESCC: Esophageal squamous cell carcinoma
HGIN: High-grade intraepithelial neoplasias
LGIN: Low-grade intraepithelial neoplasias
LiverThe image shows the transcriptomic changes along malignancy continuum.log2FC in expression of this searched gene in stem-like cells from each diseased tissue sample relative to stem-like cells in normal samples in each tissue plotted against the malignancy continuum. Samples are colored based on if they are from different disease stage.
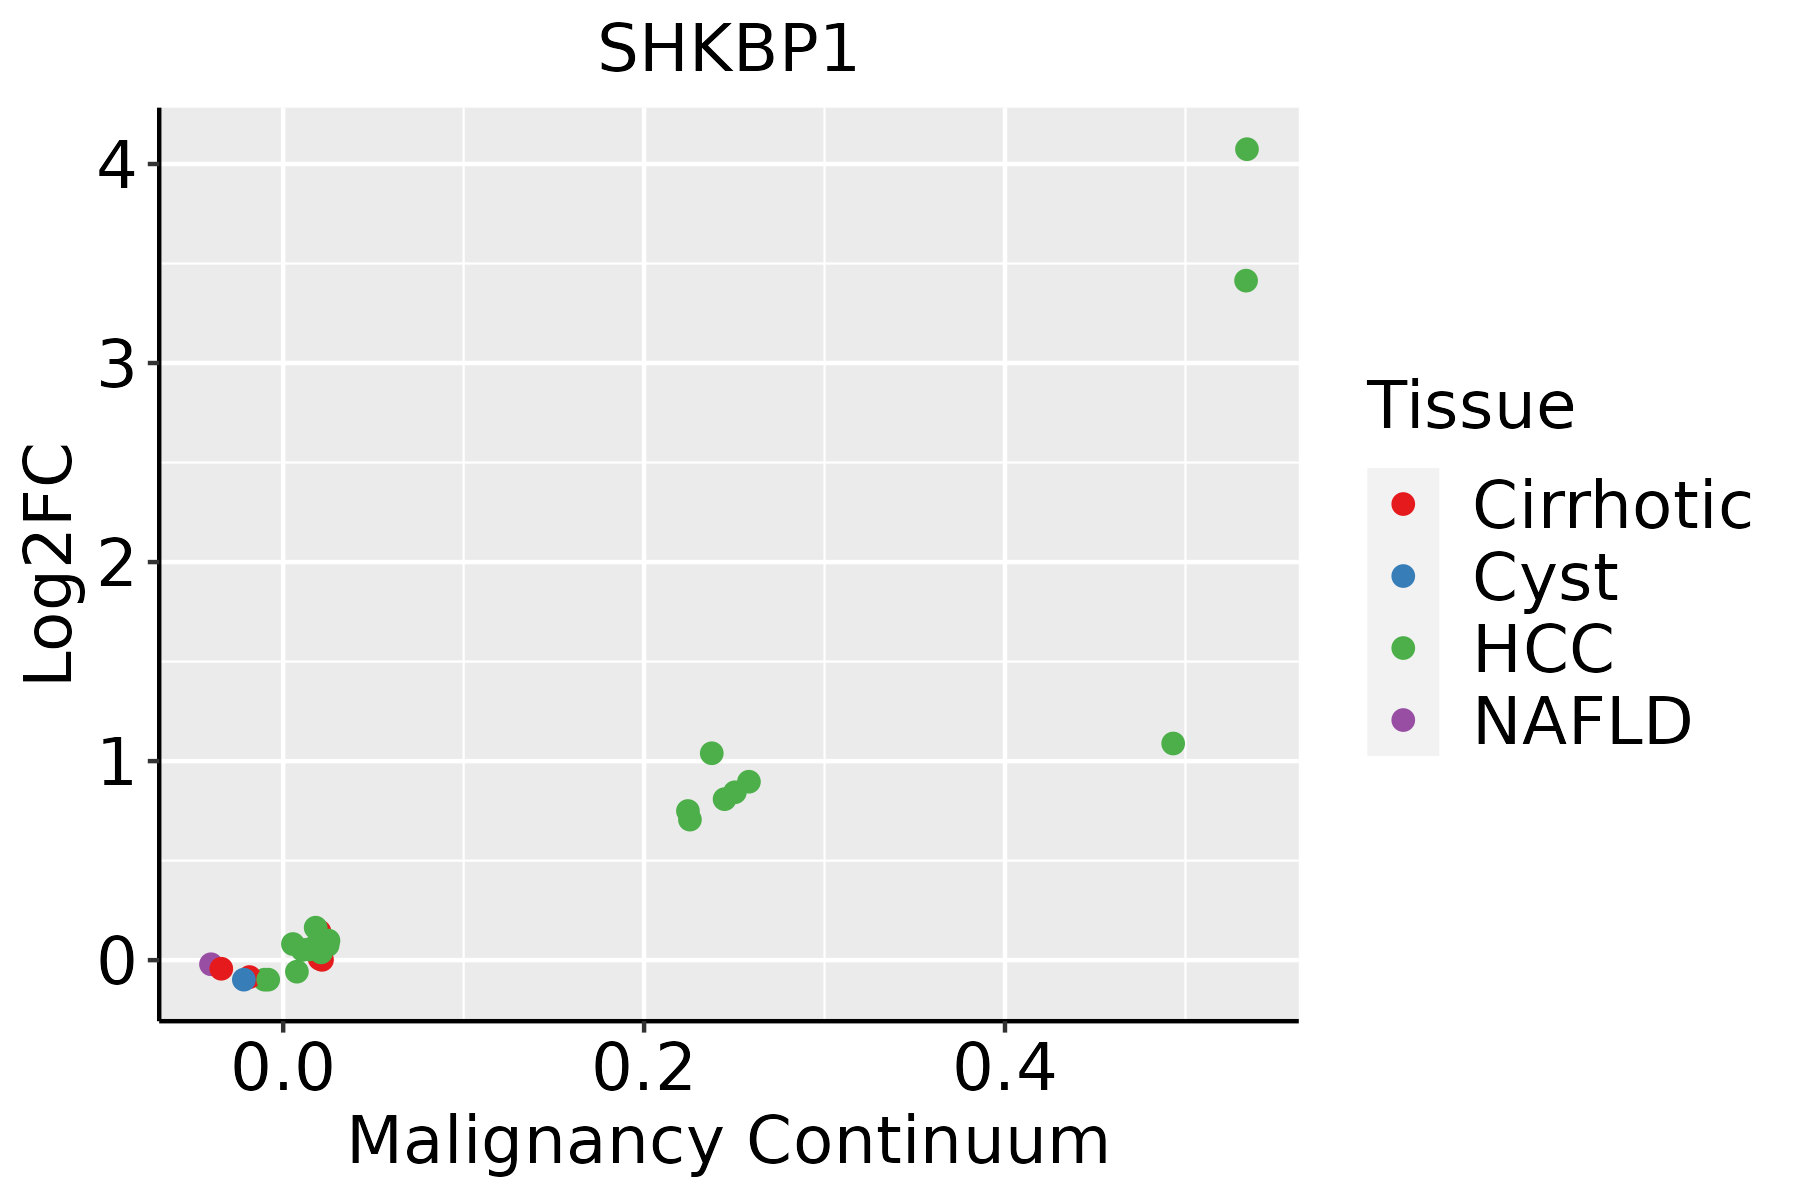
HCC: Hepatocellular carcinoma
NAFLD: Non-alcoholic fatty liver disease
Oral CavityThe image shows the transcriptomic changes along malignancy continuum.log2FC in expression of this searched gene in stem-like cells from each diseased tissue sample relative to stem-like cells in normal samples in each tissue plotted against the malignancy continuum. Samples are colored based on if they are from different disease stage.EOLP: Erosive Oral lichen planus
LP: leukoplakia
NEOLP: Non-erosive oral lichen planus
OSCC: Oral squamous cell carcinoma
SkinThe image shows the transcriptomic changes along malignancy continuum.log2FC in expression of this searched gene in stem-like cells from each diseased tissue sample relative to stem-like cells in normal samples in each tissue plotted against the malignancy continuum. Samples are colored based on if they are from different disease stage.
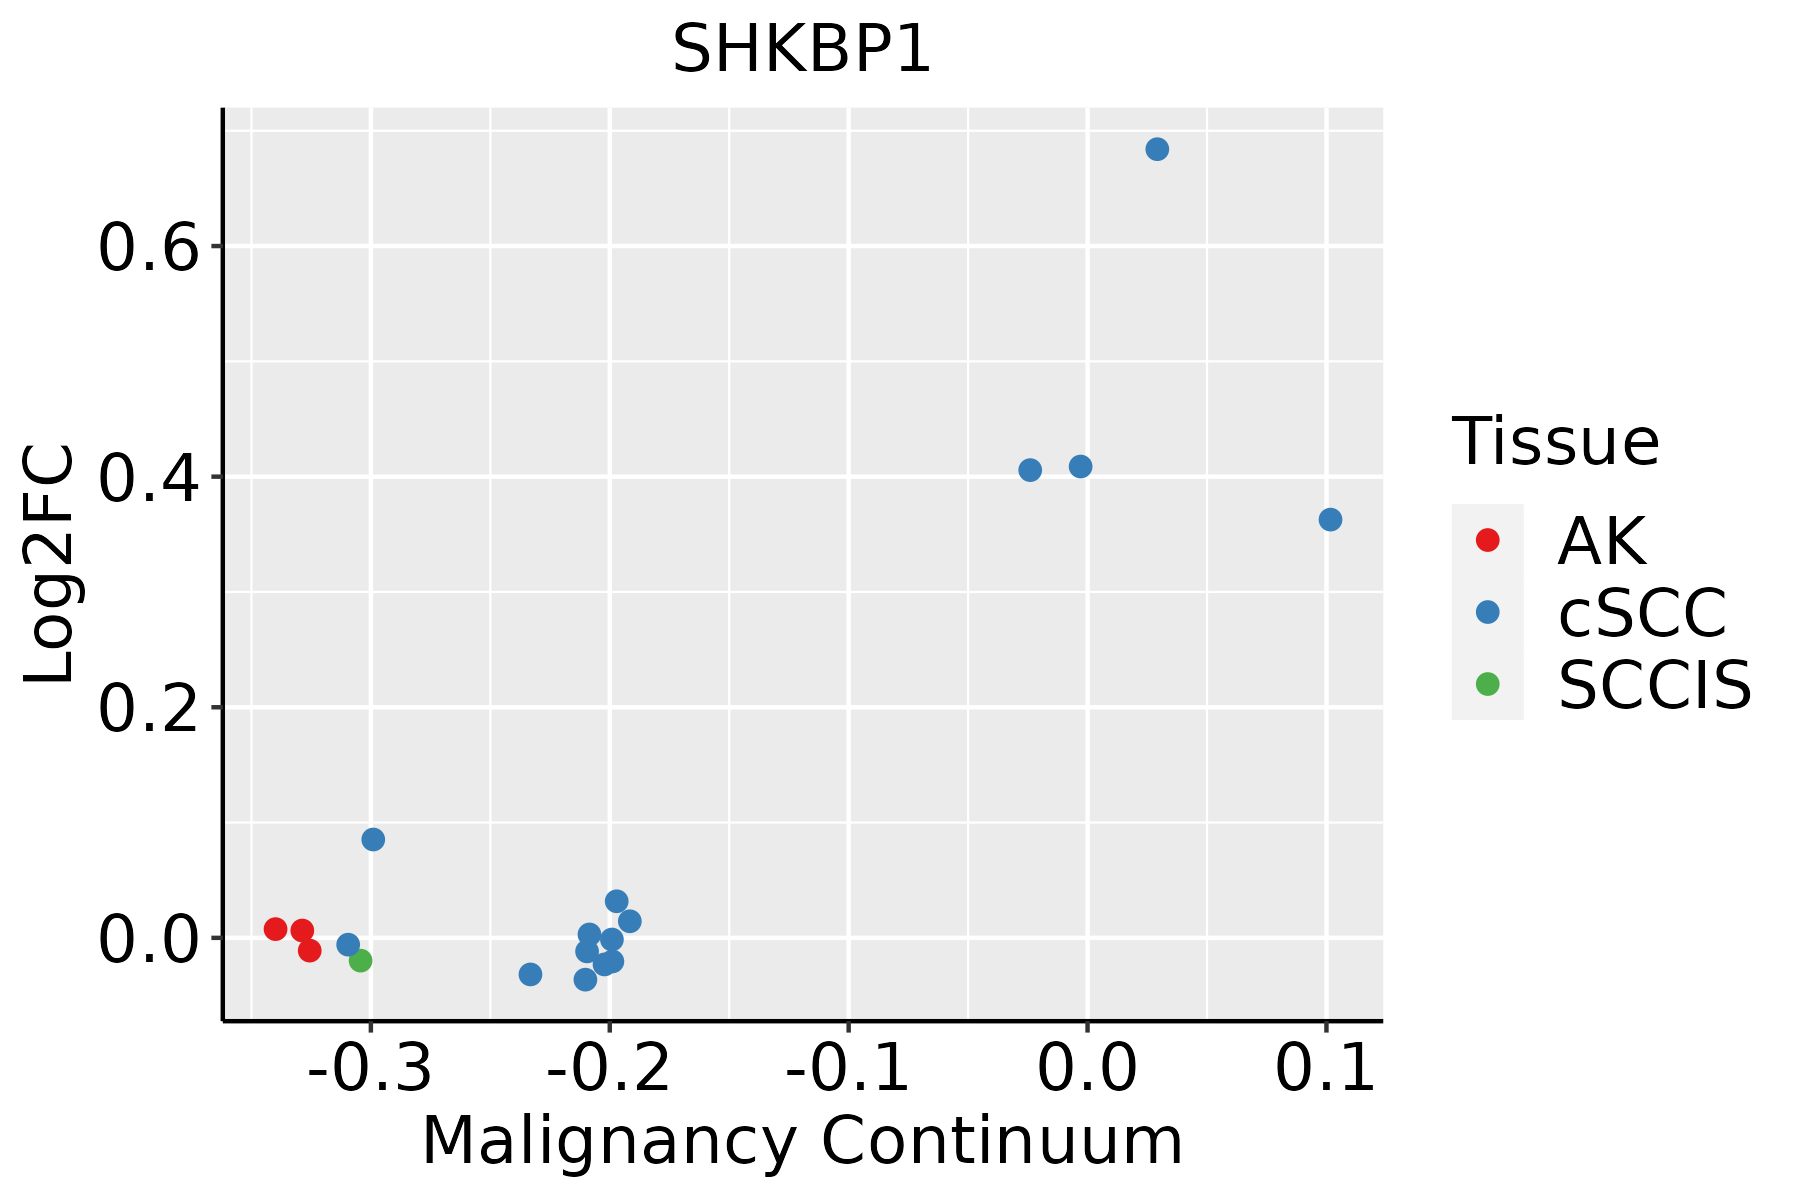
AK: Actinic keratosis
cSCC: Cutaneous squamous cell carcinoma
SCCIS:squamous cell carcinoma in situ
ThyroidThe image shows the transcriptomic changes along malignancy continuum.log2FC in expression of this searched gene in stem-like cells from each diseased tissue sample relative to stem-like cells in normal samples in each tissue plotted against the malignancy continuum. Samples are colored based on if they are from different disease stage.
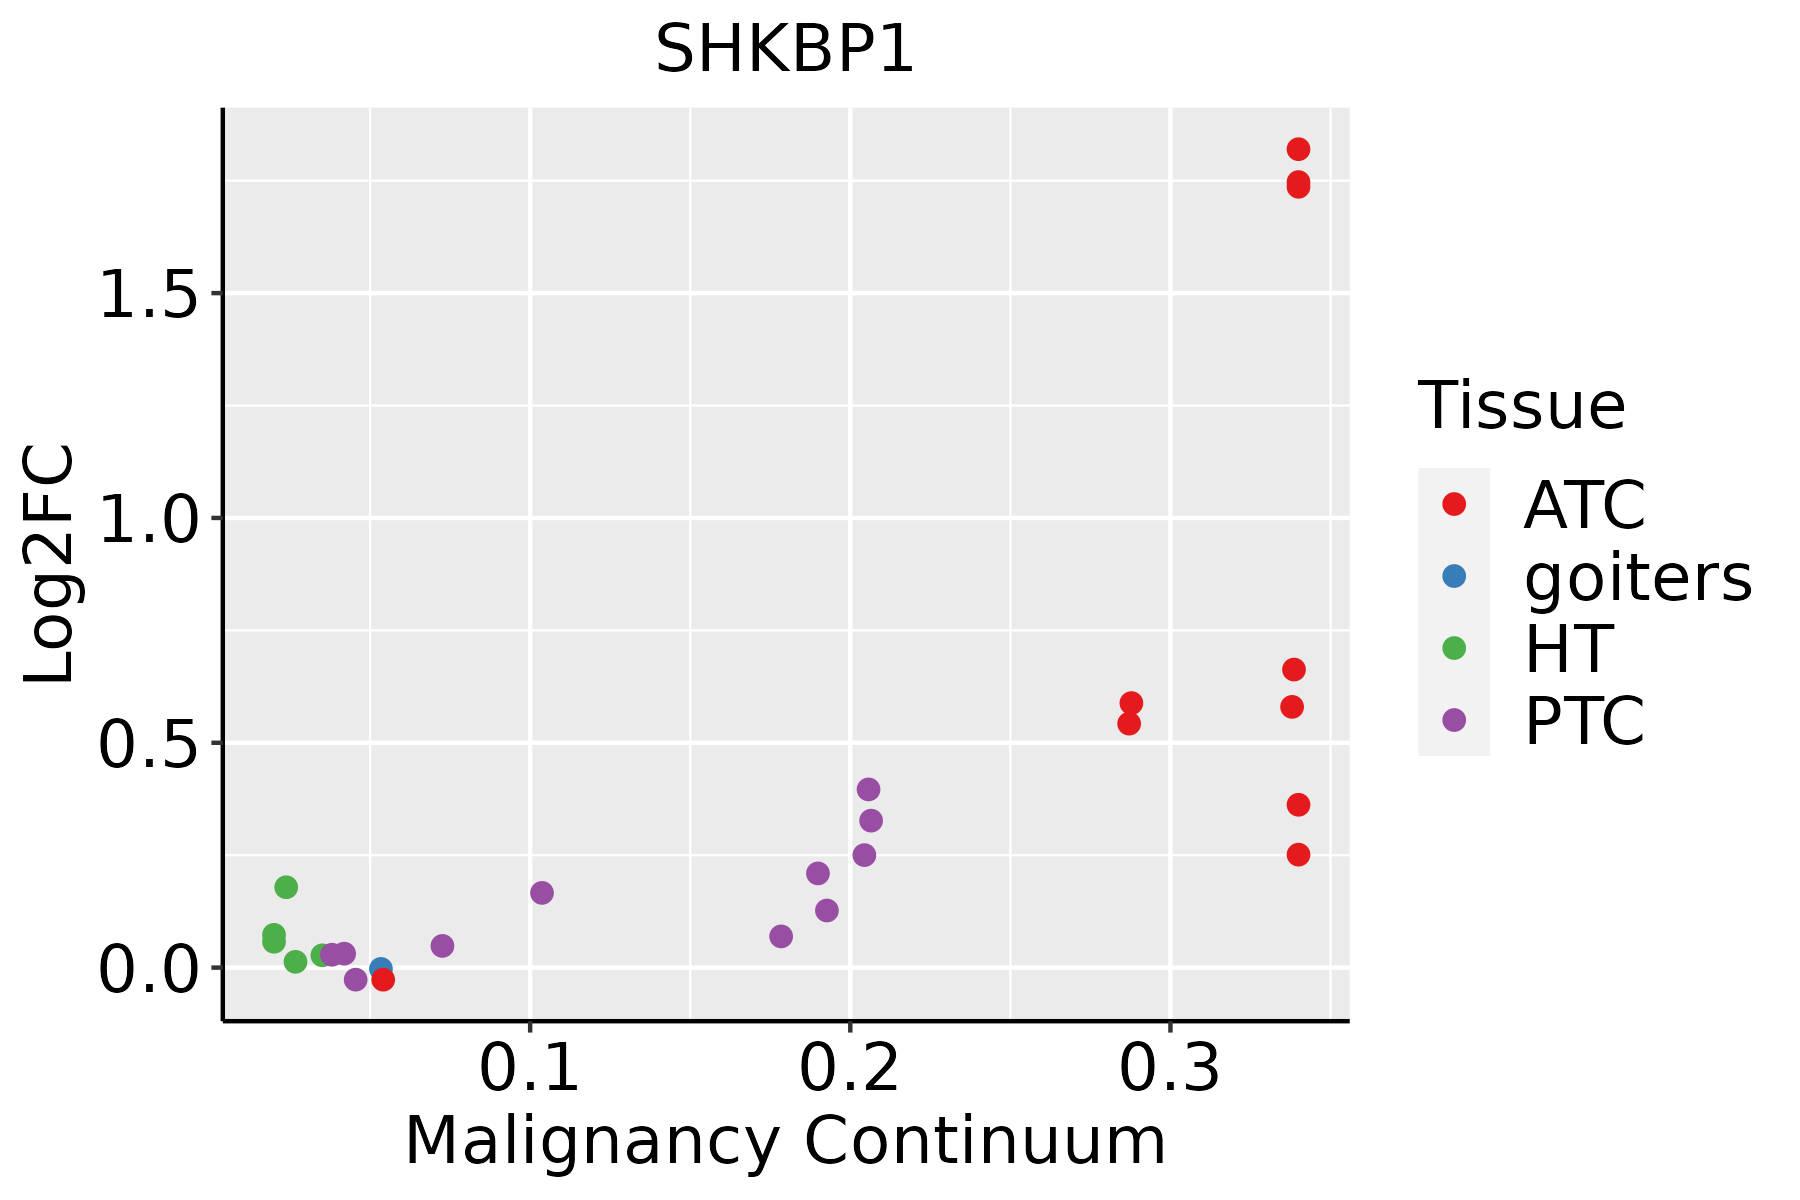
ATC: Anaplastic thyroid cancer
HT: Hashimoto's thyroiditis
PTC: Papillary thyroid cancer
∗log2FC in expression of this searched gene in stem-like cells from each diseased tissue sample relative to stem-like cells in normal samples in each tissue plotted against the malignancy continuum. Samples are colored based on if they are from different disease stage.

Top

Malignant transformation related pathway analysis

check buttonFind out the enriched GO biological processes and KEGG pathways involved in transition from healthy to precancer to cancer
check button Figure of enriched GO biological processes.
TissueDisease StageEnriched GO biological Processes
ColorectumADGO analysis - Figure of enriched GO biological processes: Top 15 enriched GO BP terms are showed in the bar plot of each disease state in each tissue. Each row represents a significant GO biological process which is colored according to the -log10(p.adjust).
ColorectumSERGO analysis - Figure of enriched GO biological processes: Top 15 enriched GO BP terms are showed in the bar plot of each disease state in each tissue. Each row represents a significant GO biological process which is colored according to the -log10(p.adjust).
ColorectumMSSGO analysis - Figure of enriched GO biological processes: Top 15 enriched GO BP terms are showed in the bar plot of each disease state in each tissue. Each row represents a significant GO biological process which is colored according to the -log10(p.adjust).
ColorectumMSI-HGO analysis - Figure of enriched GO biological processes: Top 15 enriched GO BP terms are showed in the bar plot of each disease state in each tissue. Each row represents a significant GO biological process which is colored according to the -log10(p.adjust).
ColorectumFAPGO analysis - Figure of enriched GO biological processes: Top 15 enriched GO BP terms are showed in the bar plot of each disease state in each tissue. Each row represents a significant GO biological process which is colored according to the -log10(p.adjust).
∗Top 15 enriched GO BP terms are showed in the bar plot of each disease state in each tissue. Each row represents a significant GO biological process which is colored according to the -log10(p.adjust).
Page: 1 2 3 4 5 6 7 8 9 

check button Enriched GO biological processes.
GO IDTissueDisease StageDescriptionGene RatioBg Ratiopvaluep.adjustCount
GO:003812718EsophagusESCCERBB signaling pathway82/8552121/187237.23e-079.40e-0682
GO:000717318EsophagusESCCepidermal growth factor receptor signaling pathway73/8552108/187233.36e-063.73e-0573
GO:190118413EsophagusESCCregulation of ERBB signaling pathway54/855279/187233.81e-053.08e-0454
GO:00420588EsophagusESCCregulation of epidermal growth factor receptor signaling pathway50/855273/187236.75e-055.12e-0450
GO:00512592EsophagusESCCprotein complex oligomerization130/8552238/187233.29e-031.36e-02130
GO:003812711LiverCirrhoticERBB signaling pathway46/4634121/187238.08e-045.93e-0346
GO:000717311LiverCirrhoticepidermal growth factor receptor signaling pathway39/4634108/187235.49e-032.79e-0239
GO:003812721LiverHCCERBB signaling pathway73/7958121/187235.65e-055.26e-0473
GO:000717321LiverHCCepidermal growth factor receptor signaling pathway65/7958108/187231.56e-041.25e-0365
GO:19011844LiverHCCregulation of ERBB signaling pathway47/795879/187231.71e-038.91e-0347
GO:00420584LiverHCCregulation of epidermal growth factor receptor signaling pathway43/795873/187233.43e-031.55e-0243
GO:003812715Oral cavityOSCCERBB signaling pathway76/7305121/187239.59e-081.66e-0676
GO:000717315Oral cavityOSCCepidermal growth factor receptor signaling pathway67/7305108/187231.04e-061.40e-0567
GO:19011847Oral cavityOSCCregulation of ERBB signaling pathway50/730579/187231.06e-051.12e-0450
GO:00420587Oral cavityOSCCregulation of epidermal growth factor receptor signaling pathway46/730573/187232.80e-052.59e-0446
GO:0051259Oral cavityOSCCprotein complex oligomerization121/7305238/187231.29e-049.21e-04121
GO:00512591Oral cavityLPprotein complex oligomerization85/4623238/187238.81e-051.11e-0385
GO:190118412Oral cavityLPregulation of ERBB signaling pathway30/462379/187235.97e-033.54e-0230
GO:003812716Oral cavityLPERBB signaling pathway42/4623121/187238.53e-034.61e-0242
GO:003812724SkincSCCERBB signaling pathway55/4864121/187232.77e-064.38e-0555
Page: 1 2 

check button Enriched KEGG pathways.
Pathway IDTissueDisease StageDescriptionGene RatioBg Ratiopvaluep.adjustqvalueCount
Page: 1 

Top

Cell-cell communication analysis

check buttonIdentification of potential cell-cell interactions between two cell types and their ligand-receptor pairs for different disease states
LigandReceptorLRpairPathwayTissueDisease Stage
Page: 1 

Top

Single-cell gene regulatory network inference analysis

check buttonFind out the significant the regulons (TFs) and the target genes of each regulon across cell types for different disease states
TFCell TypeTissueDisease StageTarget GeneRSSRegulon Activity
∗The dot plots of a searched regulon are shown for all cell subpopulations in each disease state of each tissue based on the regulon specific score inferred using pySCENIC and by calculating the average expression.
Page: 1 

Top

Somatic mutation of malignant transformation related genes

check buttonAnnotation of somatic variants for genes involved in malignant transformation
Hugo SymbolVariant ClassVariant ClassificationdbSNP RSHGVScHGVSpHGVSp ShortSWISSPROTBIOTYPESIFTPolyPhenTumor Sample BarcodeTissueHistologySexAgeStageTherapy TypesDrugsOutcome
SHKBP1SNVMissense_Mutationrs201616547c.1588N>Tp.Arg530Trpp.R530WQ8TBC3protein_codingdeleterious(0)probably_damaging(0.985)TCGA-D8-A1XK-01Breastbreast invasive carcinomaFemale<65I/IIChemotherapydoxorubicine+cyclophosphamideSD
SHKBP1SNVMissense_Mutationc.1871N>Tp.Ser624Leup.S624LQ8TBC3protein_codingdeleterious_low_confidence(0.04)benign(0.054)TCGA-D8-A27G-01Breastbreast invasive carcinomaFemale>=65I/IIUnknownUnknownSD
SHKBP1SNVMissense_Mutationrs761519156c.1242G>Tp.Glu414Aspp.E414DQ8TBC3protein_codingdeleterious(0)possibly_damaging(0.584)TCGA-E2-A15I-01Breastbreast invasive carcinomaFemale<65I/IIHormone TherapytamoxiphenSD
SHKBP1SNVMissense_Mutationnovelc.1651N>Ap.Glu551Lysp.E551KQ8TBC3protein_codingdeleterious(0)probably_damaging(0.972)TCGA-C5-A7CK-01Cervixcervical & endocervical cancerFemale<65I/IIChemotherapycisplatinSD
SHKBP1SNVMissense_Mutationc.1437N>Gp.Ile479Metp.I479MQ8TBC3protein_codingdeleterious(0.01)probably_damaging(0.986)TCGA-UC-A7PF-01Cervixcervical & endocervical cancerFemale<65I/IIUnknownUnknownSD
SHKBP1SNVMissense_Mutationnovelc.177G>Cp.Glu59Aspp.E59DQ8TBC3protein_codingtolerated(0.06)probably_damaging(0.983)TCGA-ZJ-AAXB-01Cervixcervical & endocervical cancerFemale<65I/IIUnknownUnknownSD
SHKBP1SNVMissense_Mutationc.1069N>Tp.Arg357Cysp.R357CQ8TBC3protein_codingdeleterious(0)possibly_damaging(0.732)TCGA-A6-2686-01Colorectumcolon adenocarcinomaFemale>=65I/IIUnknownUnknownSD
SHKBP1SNVMissense_Mutationc.919G>Tp.Gly307Trpp.G307WQ8TBC3protein_codingdeleterious(0)probably_damaging(1)TCGA-AA-3833-01Colorectumcolon adenocarcinomaFemale<65I/IIUnknownUnknownSD
SHKBP1SNVMissense_Mutationrs750766482c.2014C>Tp.Arg672Trpp.R672WQ8TBC3protein_codingdeleterious_low_confidence(0)benign(0.336)TCGA-AA-A010-01Colorectumcolon adenocarcinomaFemale<65I/IIChemotherapyfolinicCR
SHKBP1SNVMissense_Mutationnovelc.2001C>Gp.Cys667Trpp.C667WQ8TBC3protein_codingdeleterious_low_confidence(0)benign(0.286)TCGA-AA-A022-01Colorectumcolon adenocarcinomaFemale>=65I/IIUnknownUnknownSD
Page: 1 2 3 4 5 6 7 

Top

Related drugs of malignant transformation related genes

check buttonIdentification of chemicals and drugs interact with genes involved in malignant transfromation
(DGIdb 4.0)
Entrez IDSymbolCategoryInteraction TypesDrug Claim NameDrug NamePMIDs
Page: 1