
|
|||||
|
 | |
| |
| |
| |
| |
| |
|
Gene: SHISA5 |
Gene summary for SHISA5 |
| Gene information | Species | Human | Gene symbol | SHISA5 | Gene ID | 51246 |
| Gene name | shisa family member 5 | |
| Gene Alias | SCOTIN | |
| Cytomap | 3p21.31 | |
| Gene Type | protein-coding | GO ID | GO:0006915 | UniProtAcc | Q8N114 |
Top |
Malignant transformation analysis |
| Identification of the aberrant gene expression in precancerous and cancerous lesions by comparing the gene expression of stem-like cells in diseased tissues with normal stem cells |
| Entrez ID | Symbol | Replicates | Species | Organ | Tissue | Adj P-value | Log2FC | Malignancy |
| 51246 | SHISA5 | HTA11_3410_2000001011 | Human | Colorectum | AD | 2.35e-14 | 4.14e-01 | 0.0155 |
| 51246 | SHISA5 | HTA11_2487_2000001011 | Human | Colorectum | SER | 9.61e-13 | 5.46e-01 | -0.1808 |
| 51246 | SHISA5 | HTA11_1938_2000001011 | Human | Colorectum | AD | 1.86e-21 | 7.59e-01 | -0.0811 |
| 51246 | SHISA5 | HTA11_78_2000001011 | Human | Colorectum | AD | 8.27e-11 | 4.61e-01 | -0.1088 |
| 51246 | SHISA5 | HTA11_347_2000001011 | Human | Colorectum | AD | 1.36e-14 | 4.47e-01 | -0.1954 |
| 51246 | SHISA5 | HTA11_411_2000001011 | Human | Colorectum | SER | 3.12e-09 | 1.09e+00 | -0.2602 |
| 51246 | SHISA5 | HTA11_2112_2000001011 | Human | Colorectum | SER | 5.29e-05 | 6.64e-01 | -0.2196 |
| 51246 | SHISA5 | HTA11_3361_2000001011 | Human | Colorectum | AD | 4.16e-09 | 5.63e-01 | -0.1207 |
| 51246 | SHISA5 | HTA11_696_2000001011 | Human | Colorectum | AD | 1.65e-29 | 7.28e-01 | -0.1464 |
| 51246 | SHISA5 | HTA11_866_2000001011 | Human | Colorectum | AD | 6.76e-22 | 5.19e-01 | -0.1001 |
| 51246 | SHISA5 | HTA11_1391_2000001011 | Human | Colorectum | AD | 8.40e-33 | 1.01e+00 | -0.059 |
| 51246 | SHISA5 | HTA11_546_2000001011 | Human | Colorectum | AD | 7.10e-07 | 5.12e-01 | -0.0842 |
| 51246 | SHISA5 | HTA11_7862_2000001011 | Human | Colorectum | AD | 2.74e-04 | 3.93e-01 | -0.0179 |
| 51246 | SHISA5 | HTA11_866_3004761011 | Human | Colorectum | AD | 6.27e-36 | 8.84e-01 | 0.096 |
| 51246 | SHISA5 | HTA11_4255_2000001011 | Human | Colorectum | SER | 9.37e-05 | 6.94e-01 | 0.0446 |
| 51246 | SHISA5 | HTA11_8622_2000001021 | Human | Colorectum | SER | 1.86e-03 | 4.67e-01 | 0.0528 |
| 51246 | SHISA5 | HTA11_7663_2000001011 | Human | Colorectum | SER | 6.68e-06 | 5.00e-01 | 0.0131 |
| 51246 | SHISA5 | HTA11_10623_2000001011 | Human | Colorectum | AD | 1.24e-05 | 5.35e-01 | -0.0177 |
| 51246 | SHISA5 | HTA11_6801_2000001011 | Human | Colorectum | SER | 1.18e-04 | 6.49e-01 | 0.0171 |
| 51246 | SHISA5 | HTA11_10711_2000001011 | Human | Colorectum | AD | 3.27e-11 | 5.17e-01 | 0.0338 |
| Page: 1 2 3 4 5 6 7 8 9 |
| Tissue | Expression Dynamics | Abbreviation |
| Colorectum (GSE201348) |  | FAP: Familial adenomatous polyposis |
| CRC: Colorectal cancer | ||
| Colorectum (HTA11) |  | AD: Adenomas |
| SER: Sessile serrated lesions | ||
| MSI-H: Microsatellite-high colorectal cancer | ||
| MSS: Microsatellite stable colorectal cancer | ||
| Esophagus | 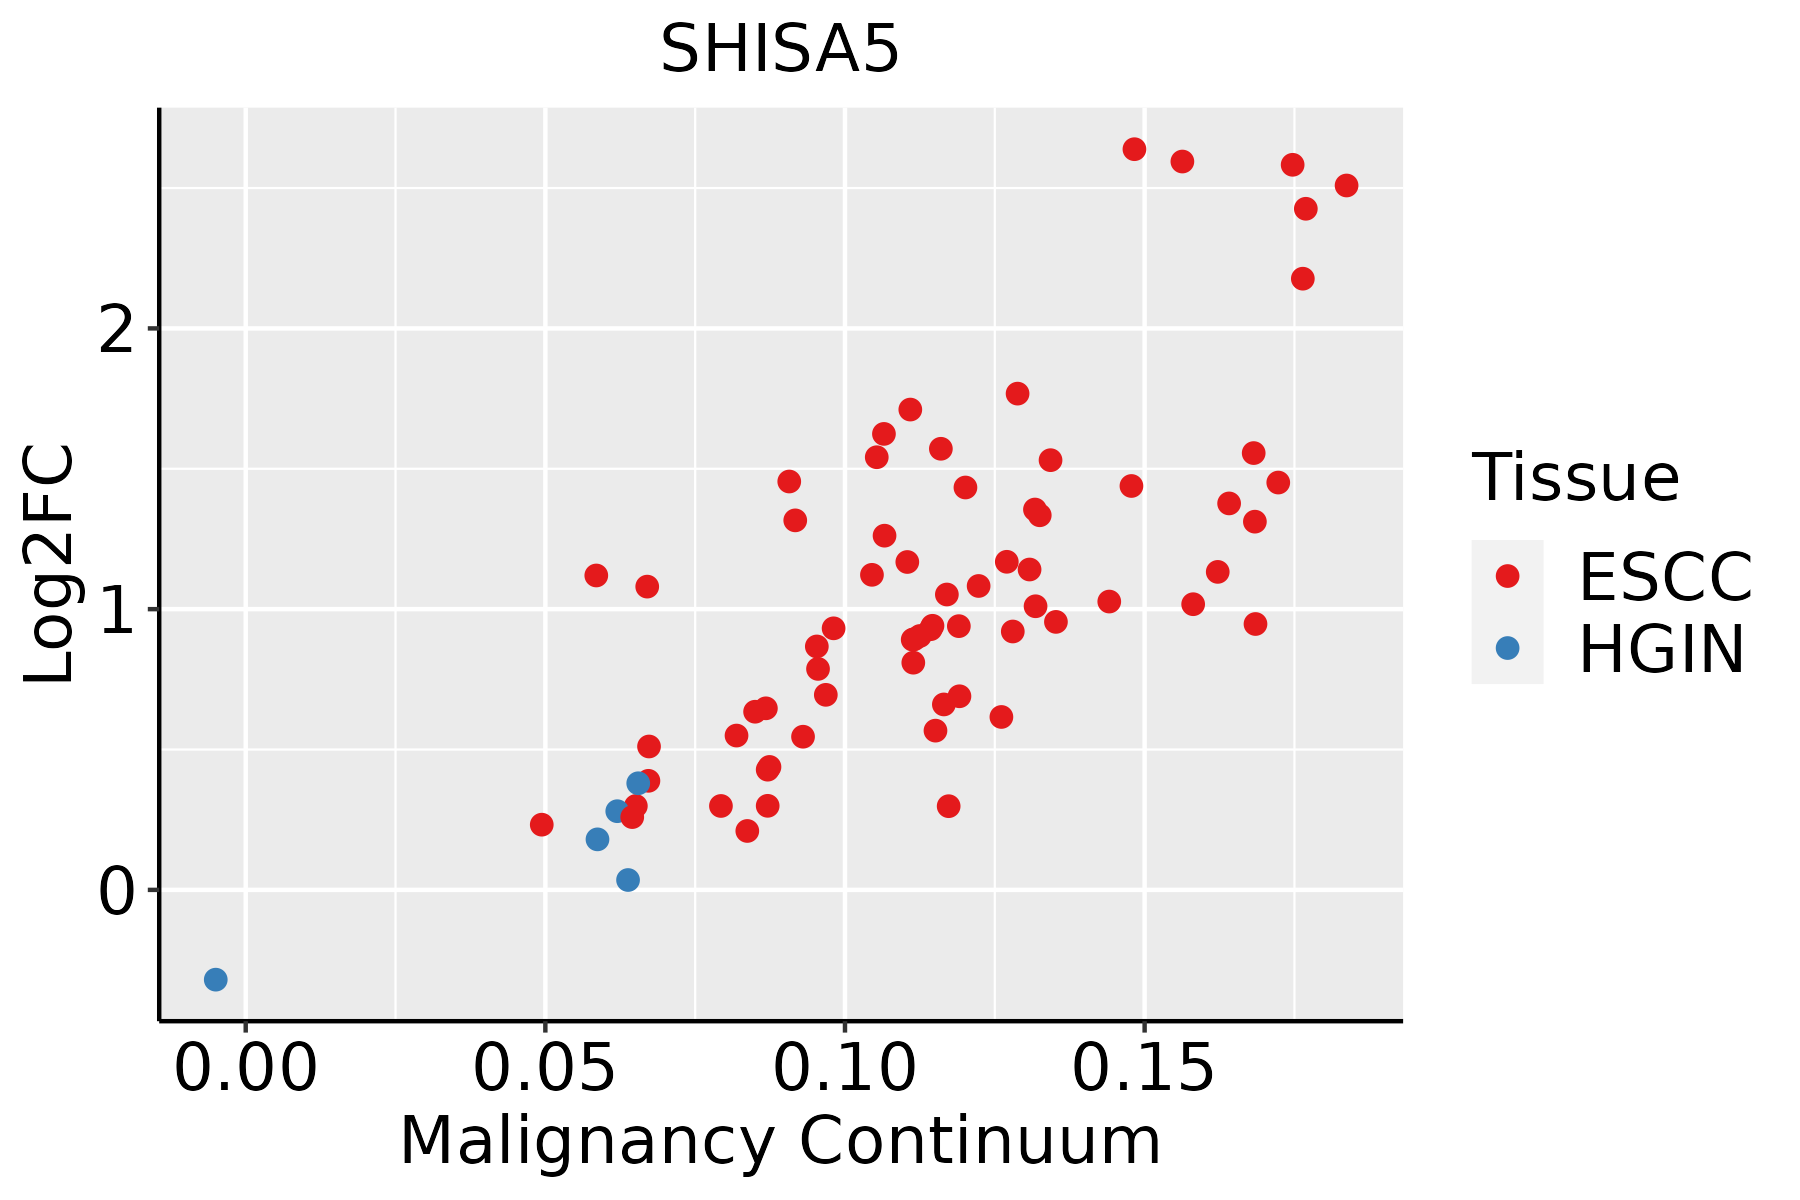 | ESCC: Esophageal squamous cell carcinoma |
| HGIN: High-grade intraepithelial neoplasias | ||
| LGIN: Low-grade intraepithelial neoplasias | ||
| Liver |  | HCC: Hepatocellular carcinoma |
| NAFLD: Non-alcoholic fatty liver disease | ||
| Oral Cavity | 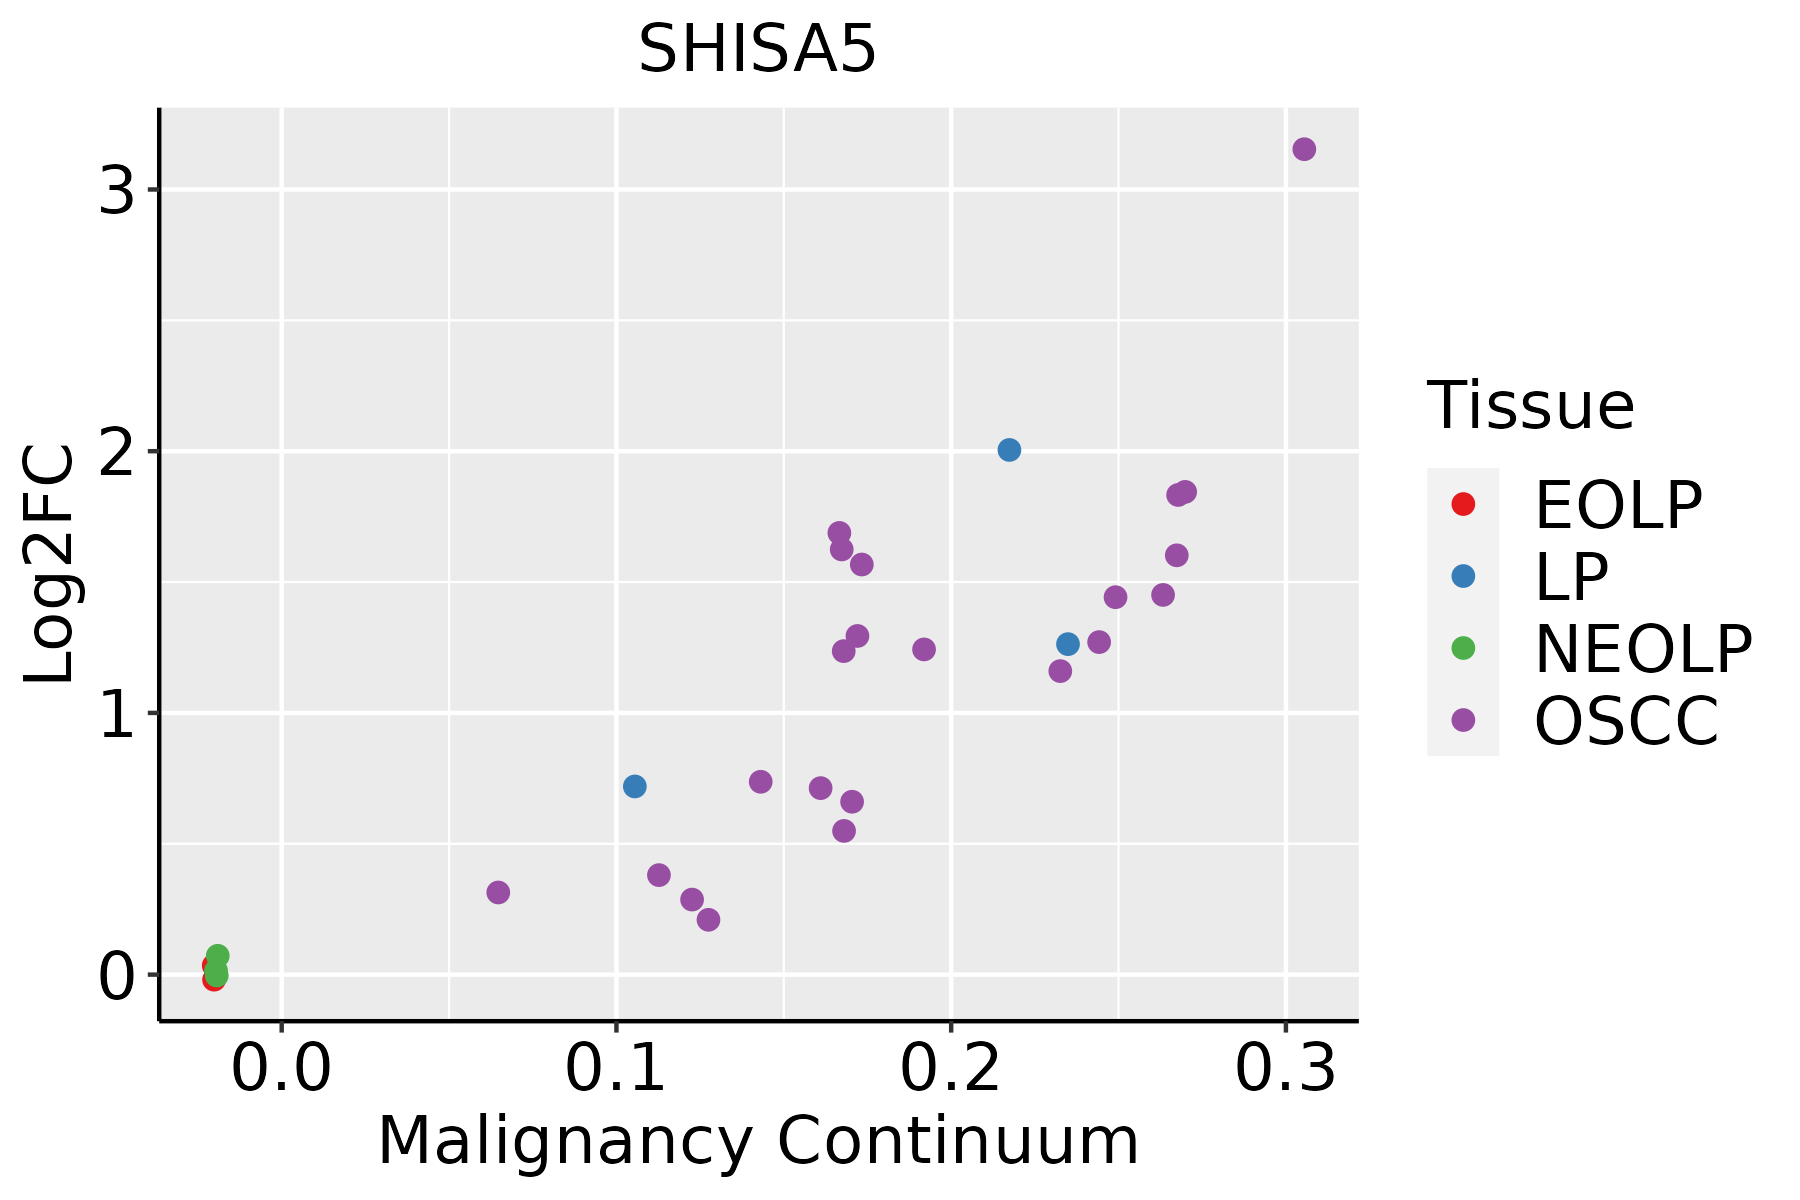 | EOLP: Erosive Oral lichen planus |
| LP: leukoplakia | ||
| NEOLP: Non-erosive oral lichen planus | ||
| OSCC: Oral squamous cell carcinoma | ||
| Prostate |  | BPH: Benign Prostatic Hyperplasia |
| Skin |  | AK: Actinic keratosis |
| cSCC: Cutaneous squamous cell carcinoma | ||
| SCCIS:squamous cell carcinoma in situ | ||
| Thyroid | 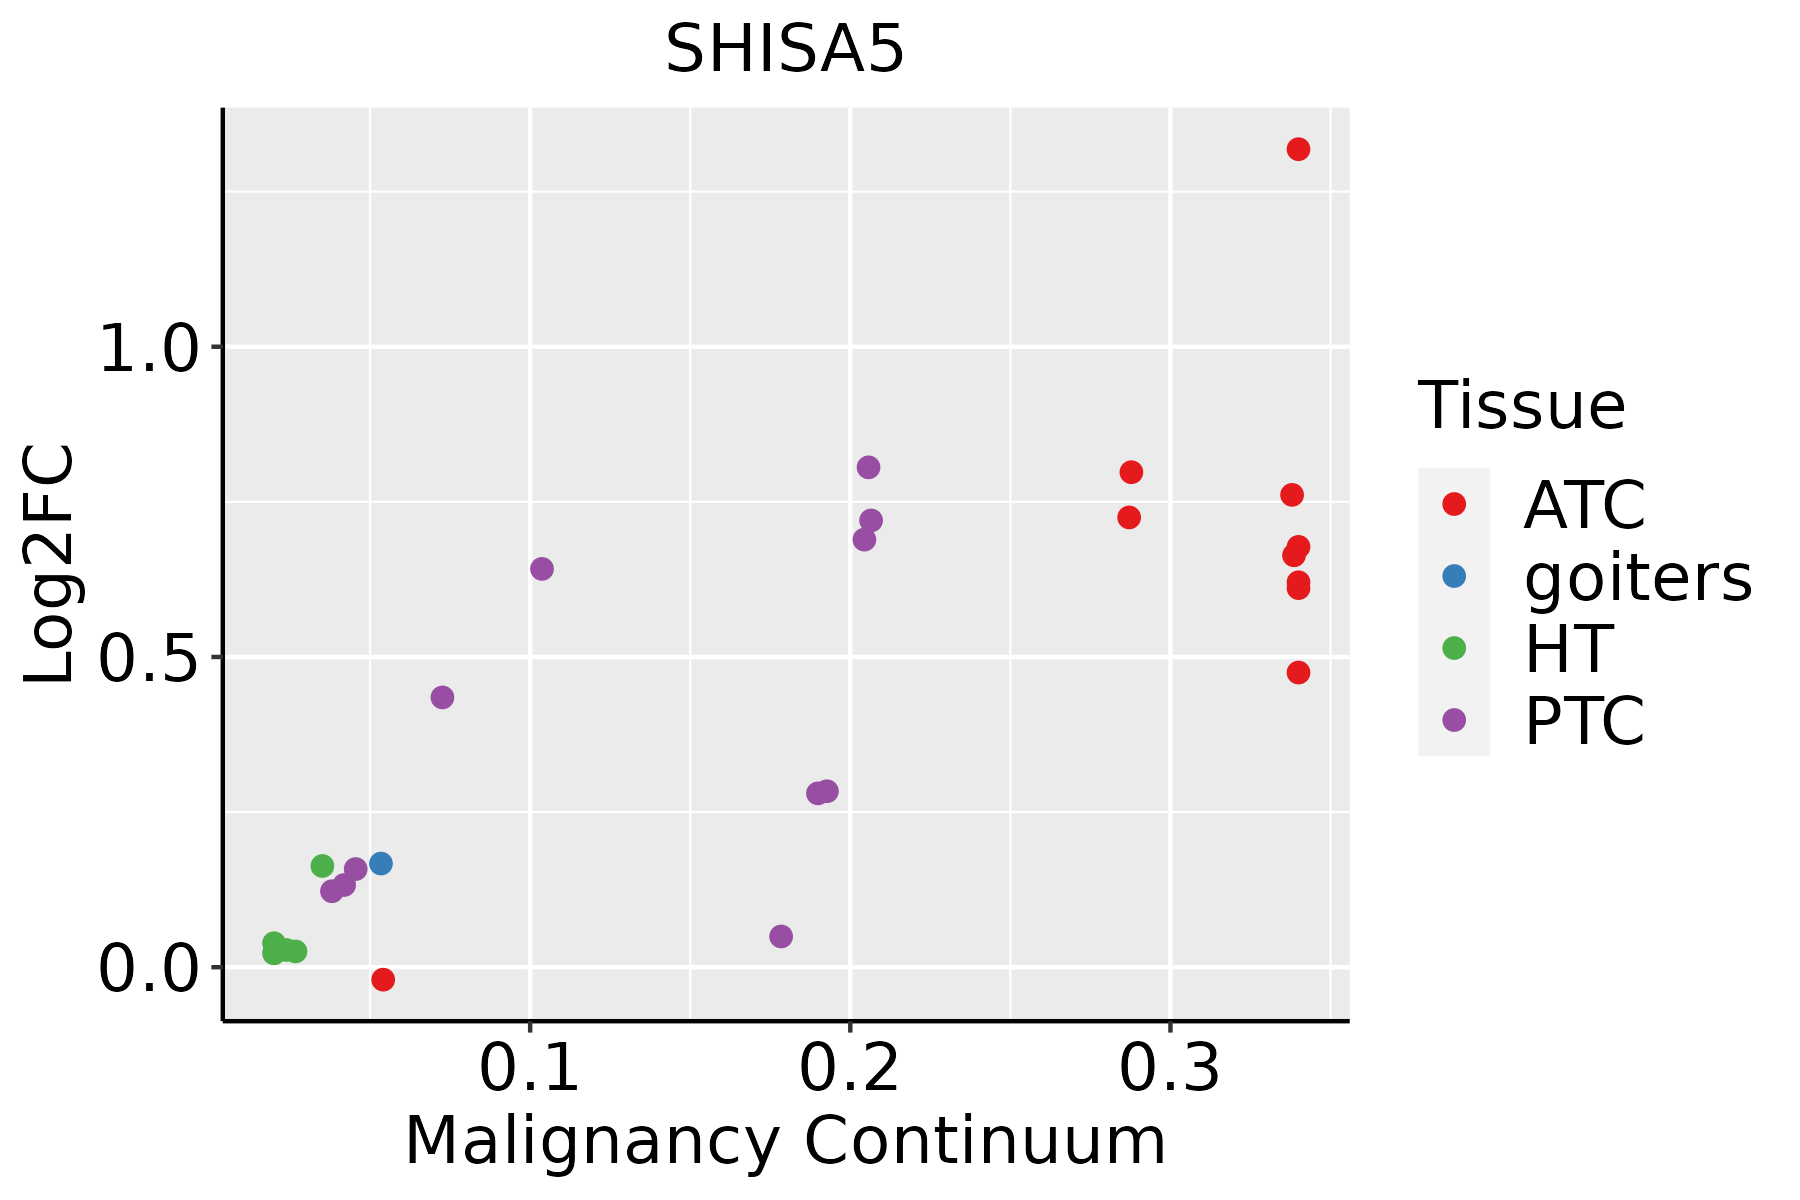 | ATC: Anaplastic thyroid cancer |
| HT: Hashimoto's thyroiditis | ||
| PTC: Papillary thyroid cancer |
| ∗log2FC in expression of this searched gene in stem-like cells from each diseased tissue sample relative to stem-like cells in normal samples in each tissue plotted against the malignancy continuum. Samples are colored based on if they are from different disease stage. |
Top |
Malignant transformation related pathway analysis |
| Find out the enriched GO biological processes and KEGG pathways involved in transition from healthy to precancer to cancer |
| Tissue | Disease Stage | Enriched GO biological Processes |
| Colorectum | AD |  |
| Colorectum | SER |  |
| Colorectum | MSS |  |
| Colorectum | MSI-H |  |
| Colorectum | FAP |  |
| ∗Top 15 enriched GO BP terms are showed in the bar plot of each disease state in each tissue. Each row represents a significant GO biological process which is colored according to the -log10(p.adjust). |
| Page: 1 2 3 4 5 6 7 8 9 |
| GO ID | Tissue | Disease Stage | Description | Gene Ratio | Bg Ratio | pvalue | p.adjust | Count |
| GO:0097193 | Colorectum | AD | intrinsic apoptotic signaling pathway | 108/3918 | 288/18723 | 6.25e-11 | 6.41e-09 | 108 |
| GO:0072331 | Colorectum | AD | signal transduction by p53 class mediator | 58/3918 | 163/18723 | 1.04e-05 | 2.40e-04 | 58 |
| GO:0072332 | Colorectum | AD | intrinsic apoptotic signaling pathway by p53 class mediator | 30/3918 | 76/18723 | 1.72e-04 | 2.33e-03 | 30 |
| GO:0043123 | Colorectum | AD | positive regulation of I-kappaB kinase/NF-kappaB signaling | 60/3918 | 186/18723 | 1.91e-04 | 2.56e-03 | 60 |
| GO:0043122 | Colorectum | AD | regulation of I-kappaB kinase/NF-kappaB signaling | 76/3918 | 249/18723 | 2.17e-04 | 2.85e-03 | 76 |
| GO:0007249 | Colorectum | AD | I-kappaB kinase/NF-kappaB signaling | 82/3918 | 281/18723 | 6.09e-04 | 6.40e-03 | 82 |
| GO:0008630 | Colorectum | AD | intrinsic apoptotic signaling pathway in response to DNA damage | 33/3918 | 99/18723 | 2.71e-03 | 2.05e-02 | 33 |
| GO:00971931 | Colorectum | SER | intrinsic apoptotic signaling pathway | 87/2897 | 288/18723 | 1.67e-10 | 2.32e-08 | 87 |
| GO:00723311 | Colorectum | SER | signal transduction by p53 class mediator | 43/2897 | 163/18723 | 2.22e-04 | 3.90e-03 | 43 |
| GO:00723321 | Colorectum | SER | intrinsic apoptotic signaling pathway by p53 class mediator | 24/2897 | 76/18723 | 3.29e-04 | 5.22e-03 | 24 |
| GO:00971932 | Colorectum | MSS | intrinsic apoptotic signaling pathway | 102/3467 | 288/18723 | 6.06e-12 | 9.82e-10 | 102 |
| GO:00431221 | Colorectum | MSS | regulation of I-kappaB kinase/NF-kappaB signaling | 71/3467 | 249/18723 | 7.12e-05 | 1.21e-03 | 71 |
| GO:00072491 | Colorectum | MSS | I-kappaB kinase/NF-kappaB signaling | 77/3467 | 281/18723 | 1.51e-04 | 2.19e-03 | 77 |
| GO:00431231 | Colorectum | MSS | positive regulation of I-kappaB kinase/NF-kappaB signaling | 55/3467 | 186/18723 | 1.60e-04 | 2.29e-03 | 55 |
| GO:00723312 | Colorectum | MSS | signal transduction by p53 class mediator | 49/3467 | 163/18723 | 2.30e-04 | 3.19e-03 | 49 |
| GO:00723322 | Colorectum | MSS | intrinsic apoptotic signaling pathway by p53 class mediator | 27/3467 | 76/18723 | 3.31e-04 | 4.24e-03 | 27 |
| GO:00971933 | Colorectum | MSI-H | intrinsic apoptotic signaling pathway | 52/1319 | 288/18723 | 2.82e-10 | 4.23e-08 | 52 |
| GO:00723323 | Colorectum | MSI-H | intrinsic apoptotic signaling pathway by p53 class mediator | 19/1319 | 76/18723 | 9.03e-07 | 6.52e-05 | 19 |
| GO:00723313 | Colorectum | MSI-H | signal transduction by p53 class mediator | 29/1319 | 163/18723 | 3.27e-06 | 1.82e-04 | 29 |
| GO:009719327 | Esophagus | HGIN | intrinsic apoptotic signaling pathway | 90/2587 | 288/18723 | 1.50e-14 | 2.80e-12 | 90 |
| Page: 1 2 3 4 5 6 |
| Pathway ID | Tissue | Disease Stage | Description | Gene Ratio | Bg Ratio | pvalue | p.adjust | qvalue | Count |
| hsa0411510 | Esophagus | HGIN | p53 signaling pathway | 21/1383 | 74/8465 | 6.25e-03 | 4.25e-02 | 3.37e-02 | 21 |
| hsa0411515 | Esophagus | HGIN | p53 signaling pathway | 21/1383 | 74/8465 | 6.25e-03 | 4.25e-02 | 3.37e-02 | 21 |
| hsa0411524 | Esophagus | ESCC | p53 signaling pathway | 65/4205 | 74/8465 | 3.88e-12 | 6.50e-11 | 3.33e-11 | 65 |
| hsa0411534 | Esophagus | ESCC | p53 signaling pathway | 65/4205 | 74/8465 | 3.88e-12 | 6.50e-11 | 3.33e-11 | 65 |
| hsa041156 | Liver | HCC | p53 signaling pathway | 46/4020 | 74/8465 | 7.64e-03 | 2.08e-02 | 1.16e-02 | 46 |
| hsa0411511 | Liver | HCC | p53 signaling pathway | 46/4020 | 74/8465 | 7.64e-03 | 2.08e-02 | 1.16e-02 | 46 |
| hsa041159 | Oral cavity | OSCC | p53 signaling pathway | 57/3704 | 74/8465 | 4.99e-09 | 5.07e-08 | 2.58e-08 | 57 |
| hsa0411514 | Oral cavity | OSCC | p53 signaling pathway | 57/3704 | 74/8465 | 4.99e-09 | 5.07e-08 | 2.58e-08 | 57 |
| hsa0411523 | Oral cavity | LP | p53 signaling pathway | 38/2418 | 74/8465 | 2.82e-05 | 1.92e-04 | 1.24e-04 | 38 |
| hsa0411533 | Oral cavity | LP | p53 signaling pathway | 38/2418 | 74/8465 | 2.82e-05 | 1.92e-04 | 1.24e-04 | 38 |
| hsa0411522 | Prostate | Tumor | p53 signaling pathway | 29/1791 | 74/8465 | 2.99e-04 | 1.65e-03 | 1.02e-03 | 29 |
| hsa0411532 | Prostate | Tumor | p53 signaling pathway | 29/1791 | 74/8465 | 2.99e-04 | 1.65e-03 | 1.02e-03 | 29 |
| Page: 1 |
Top |
Cell-cell communication analysis |
| Identification of potential cell-cell interactions between two cell types and their ligand-receptor pairs for different disease states |
| Ligand | Receptor | LRpair | Pathway | Tissue | Disease Stage |
| Page: 1 |
Top |
Single-cell gene regulatory network inference analysis |
| Find out the significant the regulons (TFs) and the target genes of each regulon across cell types for different disease states |
| TF | Cell Type | Tissue | Disease Stage | Target Gene | RSS | Regulon Activity |
| ∗The dot plots of a searched regulon are shown for all cell subpopulations in each disease state of each tissue based on the regulon specific score inferred using pySCENIC and by calculating the average expression. |
| Page: 1 |
Top |
Somatic mutation of malignant transformation related genes |
| Annotation of somatic variants for genes involved in malignant transformation |
| Hugo Symbol | Variant Class | Variant Classification | dbSNP RS | HGVSc | HGVSp | HGVSp Short | SWISSPROT | BIOTYPE | SIFT | PolyPhen | Tumor Sample Barcode | Tissue | Histology | Sex | Age | Stage | Therapy Types | Drugs | Outcome |
| SHISA5 | SNV | Missense_Mutation | novel | c.596N>C | p.Tyr199Ser | p.Y199S | Q8N114 | protein_coding | deleterious(0.01) | probably_damaging(0.999) | TCGA-A8-A06R-01 | Breast | breast invasive carcinoma | Female | >=65 | I/II | Chemotherapy | 5-fluorouracil | CR |
| SHISA5 | SNV | Missense_Mutation | rs375027466 | c.124N>A | p.Glu42Lys | p.E42K | Q8N114 | protein_coding | tolerated(0.99) | benign(0.003) | TCGA-AC-A5EH-01 | Breast | breast invasive carcinoma | Female | >=65 | I/II | Unknown | Unknown | SD |
| SHISA5 | SNV | Missense_Mutation | c.226N>A | p.Glu76Lys | p.E76K | Q8N114 | protein_coding | tolerated(0.59) | benign(0.007) | TCGA-AR-A250-01 | Breast | breast invasive carcinoma | Female | <65 | I/II | Chemotherapy | doxorubicin | SD | |
| SHISA5 | SNV | Missense_Mutation | rs140407949 | c.497C>T | p.Pro166Leu | p.P166L | Q8N114 | protein_coding | deleterious(0) | possibly_damaging(0.87) | TCGA-A6-6653-01 | Colorectum | colon adenocarcinoma | Male | >=65 | I/II | Unknown | Unknown | SD |
| SHISA5 | SNV | Missense_Mutation | c.80G>A | p.Arg27His | p.R27H | Q8N114 | protein_coding | tolerated(0.61) | benign(0) | TCGA-AA-3678-01 | Colorectum | colon adenocarcinoma | Female | <65 | III/IV | Chemotherapy | folinic | CR | |
| SHISA5 | SNV | Missense_Mutation | rs751472414 | c.428N>A | p.Arg143His | p.R143H | Q8N114 | protein_coding | deleterious(0) | probably_damaging(0.923) | TCGA-D5-6540-01 | Colorectum | colon adenocarcinoma | Male | >=65 | I/II | Unknown | Unknown | SD |
| SHISA5 | SNV | Missense_Mutation | rs775250358 | c.286N>T | p.Arg96Cys | p.R96C | Q8N114 | protein_coding | deleterious(0.04) | benign(0.003) | TCGA-G4-6304-01 | Colorectum | colon adenocarcinoma | Female | >=65 | I/II | Chemotherapy | fluorouracil | PD |
| SHISA5 | SNV | Missense_Mutation | rs199734268 | c.716C>T | p.Ala239Val | p.A239V | Q8N114 | protein_coding | deleterious_low_confidence(0.03) | benign(0) | TCGA-G4-6586-01 | Colorectum | colon adenocarcinoma | Female | >=65 | I/II | Unknown | Unknown | SD |
| SHISA5 | SNV | Missense_Mutation | rs201303918 | c.655N>A | p.Ala219Thr | p.A219T | Q8N114 | protein_coding | tolerated(0.22) | benign(0) | TCGA-G4-6628-01 | Colorectum | colon adenocarcinoma | Male | >=65 | I/II | Unknown | Unknown | SD |
| SHISA5 | SNV | Missense_Mutation | rs201243667 | c.254N>T | p.Pro85Leu | p.P85L | Q8N114 | protein_coding | tolerated(0.27) | benign(0.105) | TCGA-WS-AB45-01 | Colorectum | colon adenocarcinoma | Female | <65 | I/II | Unknown | Unknown | SD |
| Page: 1 2 3 |
Top |
Related drugs of malignant transformation related genes |
| Identification of chemicals and drugs interact with genes involved in malignant transfromation |
| (DGIdb 4.0) |
| Entrez ID | Symbol | Category | Interaction Types | Drug Claim Name | Drug Name | PMIDs |
| Page: 1 |

Copyright 2023-Present -The University of Texas Health Science Center at Houston |