Schematic overview of the cellular and molecular mechanisms involved in the cancer progression, including the proposed cellular and molecular mechanisms in cancer cells trajectory. AT1: alveolar type 1 cells; AT2: alveolar type 2 cells; AAH: atypical adenomatous hyperplasia; AIS: adenocarcinoma in situ; MIA: minimally invasive adenocarcinoma; IA: invasive adenocarcinoma; EMT: epithelial-mesenchymal transition

Home

Download

Statistics

Help

Contact

Center for Computational Systems Medicine
leaf

Gene summary

leaf

Malignant transformation analysis

leaf

Malignant transformation related pathway analysis

leaf

Cell-cell communication analysis

leaf

Single-cell gene regulatory network inference analysis

leaf

Somatic mutation of malignant transformation related genes

leaf

Related drugs of malignant transformation related genes

Gene: SHISA2

Gene summary for SHISA2

check button Gene summary.

Gene informationSpeciesHuman
Gene symbol

SHISA2

Gene ID

387914

Gene nameshisa family member 2
Gene AliasC13orf13
Cytomap13q12.13
Gene Typeprotein-coding
GO ID

GO:0007154

UniProtAcc

Q6UWI4


Top

Malignant transformation analysis

check button Identification of the aberrant gene expression in precancerous and cancerous lesions by comparing the gene expression of stem-like cells in diseased tissues with normal stem cells
check button Malignant transformation involving gene list.
Entrez IDSymbolReplicatesSpeciesOrganTissueAdj P-valueLog2FCMalignancy
387914SHISA2GSM4909293HumanBreastIDC1.23e-254.77e-010.1581
387914SHISA2GSM4909297HumanBreastIDC7.28e-145.43e-010.1517
387914SHISA2GSM4909298HumanBreastIDC6.52e-123.29e-010.1551
387914SHISA2GSM4909305HumanBreastIDC1.44e-053.33e-010.0436
387914SHISA2GSM4909306HumanBreastIDC3.70e-103.70e-010.1564
387914SHISA2GSM4909317HumanBreastIDC6.38e-246.62e-010.1355
387914SHISA2P2T-EHumanEsophagusESCC6.62e-204.17e-010.1177
387914SHISA2P8T-EHumanEsophagusESCC3.50e-029.53e-020.0889
387914SHISA2P10T-EHumanEsophagusESCC2.55e-082.38e-010.116
387914SHISA2P12T-EHumanEsophagusESCC1.88e-041.43e-010.1122
387914SHISA2P16T-EHumanEsophagusESCC9.11e-409.08e-010.1153
387914SHISA2P22T-EHumanEsophagusESCC3.60e-132.75e-010.1236
387914SHISA2P26T-EHumanEsophagusESCC1.85e-183.86e-010.1276
387914SHISA2P30T-EHumanEsophagusESCC5.16e-033.11e-010.137
387914SHISA2P32T-EHumanEsophagusESCC3.75e-038.35e-020.1666
387914SHISA2P37T-EHumanEsophagusESCC1.47e-041.64e-010.1371
387914SHISA2P48T-EHumanEsophagusESCC2.65e-063.10e-010.0959
387914SHISA2P52T-EHumanEsophagusESCC6.64e-104.50e-010.1555
387914SHISA2P56T-EHumanEsophagusESCC6.45e-091.91e+000.1613
387914SHISA2P61T-EHumanEsophagusESCC3.24e-052.56e-010.099
Page: 1 2 3 

check button Transcriptomic changes along malignancy continuum.
TissueExpression DynamicsAbbreviation
BreastThe image shows the transcriptomic changes along malignancy continuum.log2FC in expression of this searched gene in stem-like cells from each diseased tissue sample relative to stem-like cells in normal samples in each tissue plotted against the malignancy continuum. Samples are colored based on if they are from different disease stage.IDC: Invasive ductal carcinoma
DCIS: Ductal carcinoma in situ
Precancer(BRCA1-mut): Precancerous lesion from BRCA1 mutation carriers
EsophagusThe image shows the transcriptomic changes along malignancy continuum.log2FC in expression of this searched gene in stem-like cells from each diseased tissue sample relative to stem-like cells in normal samples in each tissue plotted against the malignancy continuum. Samples are colored based on if they are from different disease stage.ESCC: Esophageal squamous cell carcinoma
HGIN: High-grade intraepithelial neoplasias
LGIN: Low-grade intraepithelial neoplasias
Oral CavityThe image shows the transcriptomic changes along malignancy continuum.log2FC in expression of this searched gene in stem-like cells from each diseased tissue sample relative to stem-like cells in normal samples in each tissue plotted against the malignancy continuum. Samples are colored based on if they are from different disease stage.
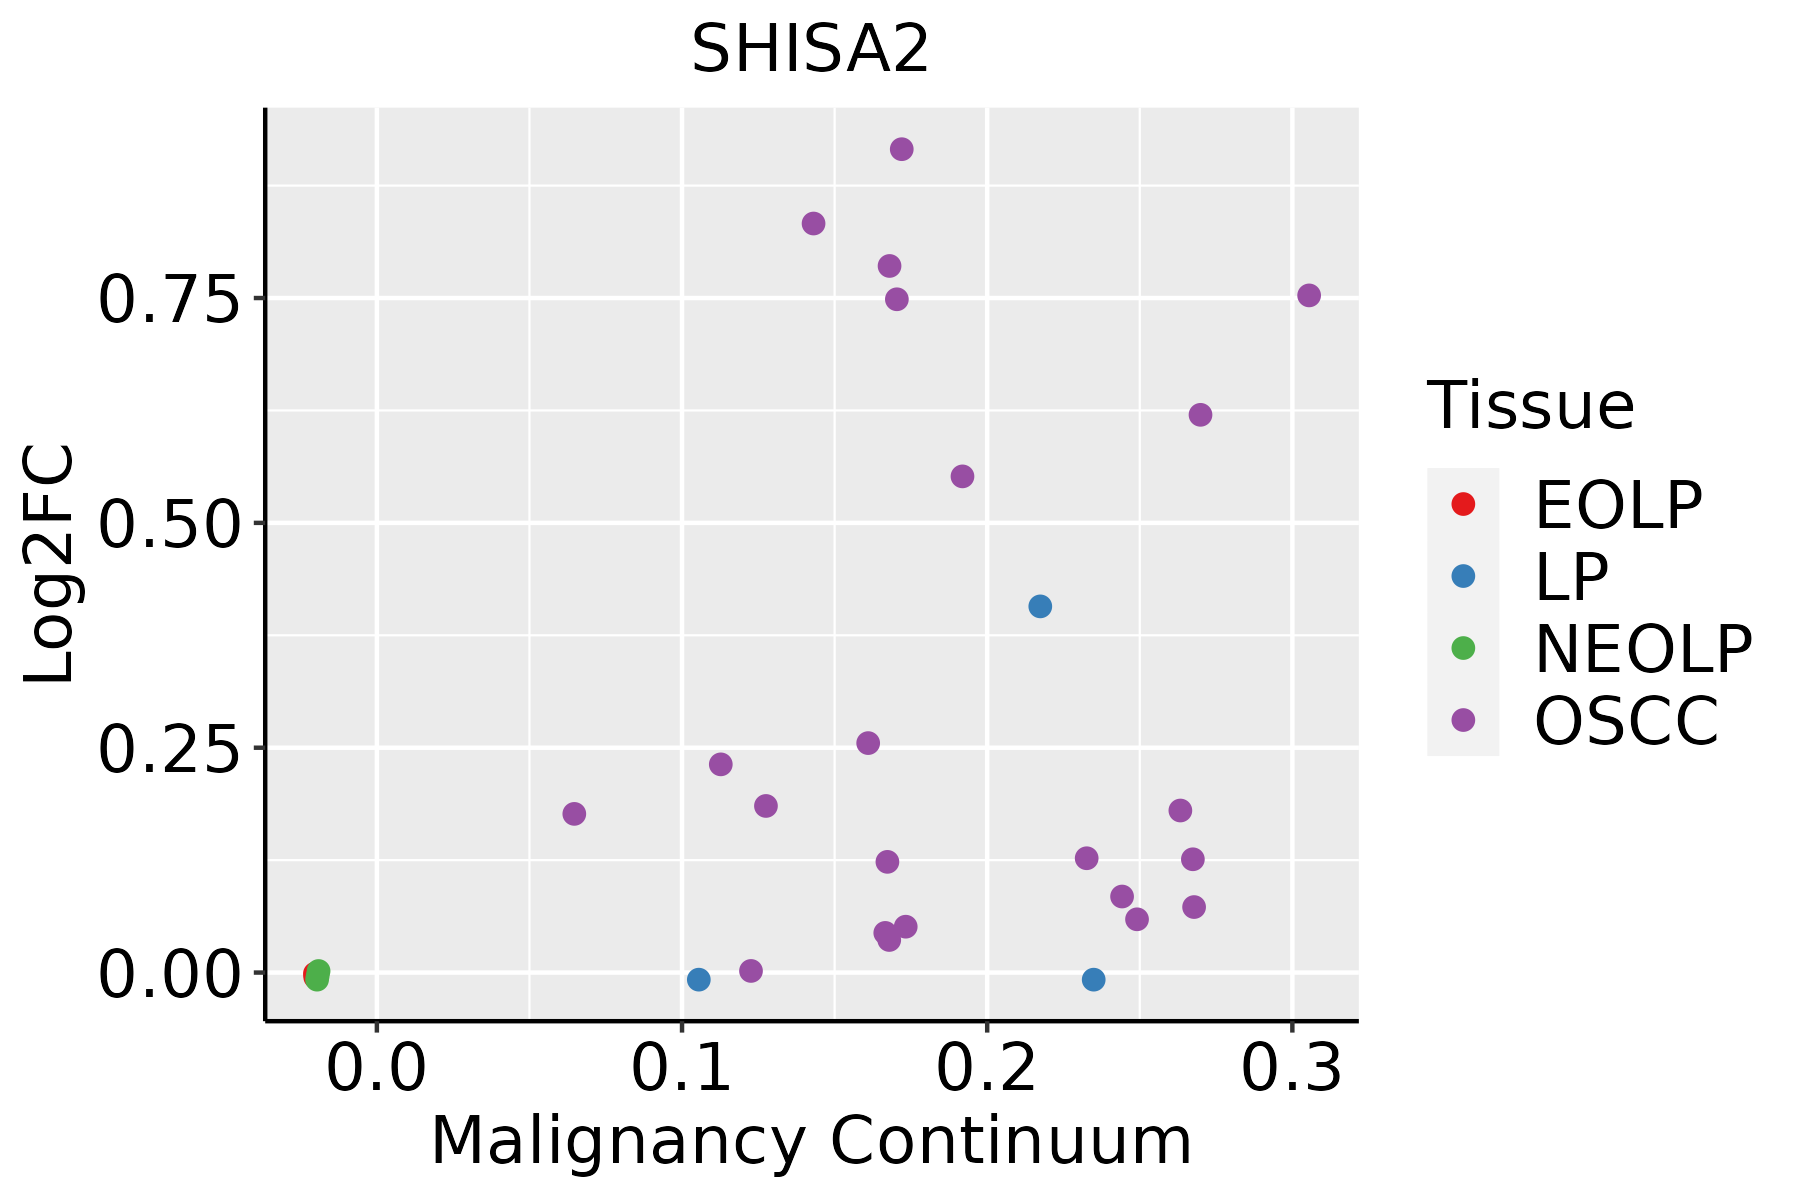
EOLP: Erosive Oral lichen planus
LP: leukoplakia
NEOLP: Non-erosive oral lichen planus
OSCC: Oral squamous cell carcinoma
ThyroidThe image shows the transcriptomic changes along malignancy continuum.log2FC in expression of this searched gene in stem-like cells from each diseased tissue sample relative to stem-like cells in normal samples in each tissue plotted against the malignancy continuum. Samples are colored based on if they are from different disease stage.
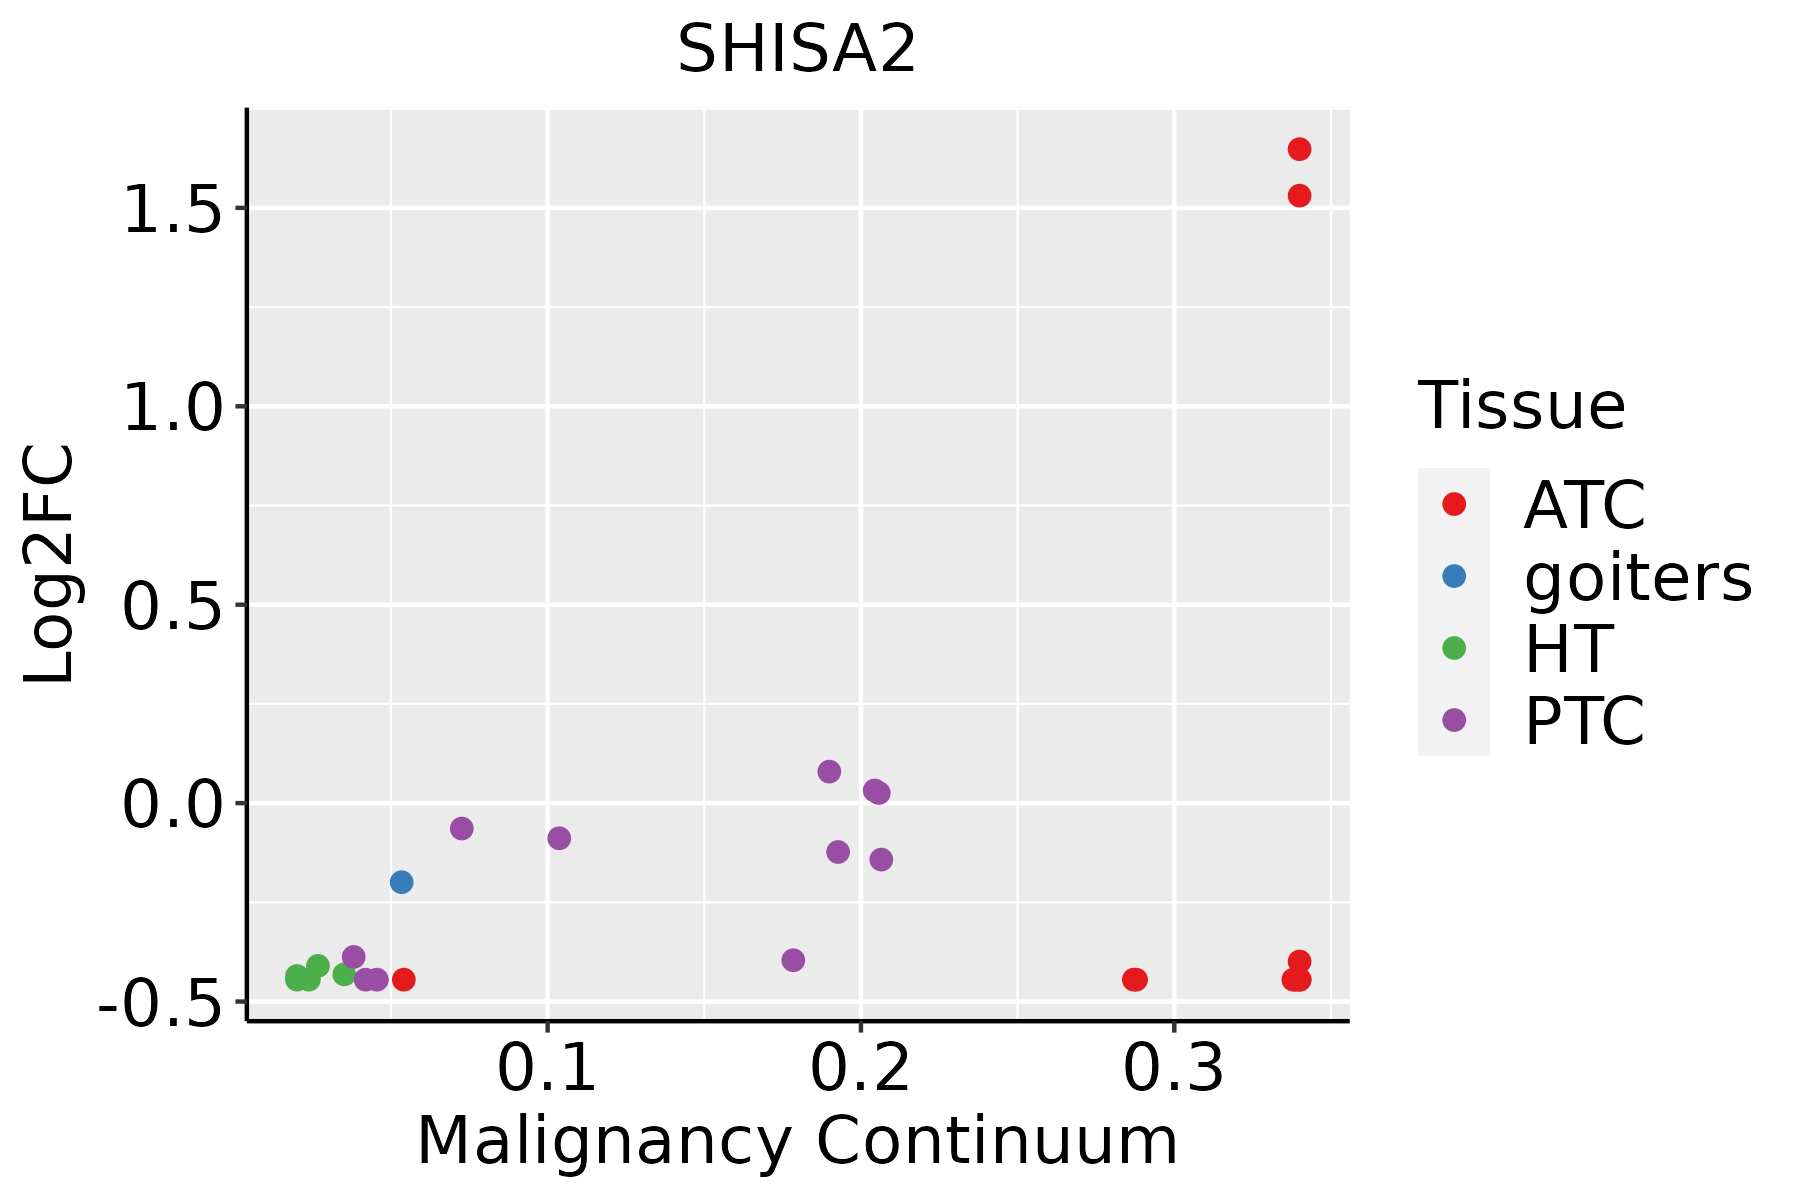
ATC: Anaplastic thyroid cancer
HT: Hashimoto's thyroiditis
PTC: Papillary thyroid cancer
∗log2FC in expression of this searched gene in stem-like cells from each diseased tissue sample relative to stem-like cells in normal samples in each tissue plotted against the malignancy continuum. Samples are colored based on if they are from different disease stage.

Top

Malignant transformation related pathway analysis

check buttonFind out the enriched GO biological processes and KEGG pathways involved in transition from healthy to precancer to cancer
check button Figure of enriched GO biological processes.
TissueDisease StageEnriched GO biological Processes
ColorectumADGO analysis - Figure of enriched GO biological processes: Top 15 enriched GO BP terms are showed in the bar plot of each disease state in each tissue. Each row represents a significant GO biological process which is colored according to the -log10(p.adjust).
ColorectumSERGO analysis - Figure of enriched GO biological processes: Top 15 enriched GO BP terms are showed in the bar plot of each disease state in each tissue. Each row represents a significant GO biological process which is colored according to the -log10(p.adjust).
ColorectumMSSGO analysis - Figure of enriched GO biological processes: Top 15 enriched GO BP terms are showed in the bar plot of each disease state in each tissue. Each row represents a significant GO biological process which is colored according to the -log10(p.adjust).
ColorectumMSI-HGO analysis - Figure of enriched GO biological processes: Top 15 enriched GO BP terms are showed in the bar plot of each disease state in each tissue. Each row represents a significant GO biological process which is colored according to the -log10(p.adjust).
ColorectumFAPGO analysis - Figure of enriched GO biological processes: Top 15 enriched GO BP terms are showed in the bar plot of each disease state in each tissue. Each row represents a significant GO biological process which is colored according to the -log10(p.adjust).
∗Top 15 enriched GO BP terms are showed in the bar plot of each disease state in each tissue. Each row represents a significant GO biological process which is colored according to the -log10(p.adjust).
Page: 1 2 3 4 5 6 7 8 9 

check button Enriched GO biological processes.
GO IDTissueDisease StageDescriptionGene RatioBg Ratiopvaluep.adjustCount
GO:001605517EsophagusESCCWnt signaling pathway268/8552444/187232.32e-106.58e-09268
GO:019873817EsophagusESCCcell-cell signaling by wnt269/8552446/187232.41e-106.79e-09269
GO:003011117EsophagusESCCregulation of Wnt signaling pathway194/8552328/187235.39e-077.14e-06194
GO:00301788EsophagusESCCnegative regulation of Wnt signaling pathway97/8552170/187231.81e-038.31e-0397
GO:001605510Oral cavityOSCCWnt signaling pathway227/7305444/187231.10e-071.87e-06227
GO:019873810Oral cavityOSCCcell-cell signaling by wnt227/7305446/187231.75e-072.86e-06227
GO:003011110Oral cavityOSCCregulation of Wnt signaling pathway165/7305328/187231.87e-051.80e-04165
GO:001605520ThyroidHTWnt signaling pathway48/1272444/187239.68e-049.93e-0348
GO:019873820ThyroidHTcell-cell signaling by wnt48/1272446/187231.07e-031.07e-0248
GO:00902874ThyroidHTregulation of cellular response to growth factor stimulus33/1272304/187235.25e-033.50e-0233
GO:003011120ThyroidHTregulation of Wnt signaling pathway35/1272328/187235.41e-033.58e-0235
GO:0016055110ThyroidPTCWnt signaling pathway217/5968444/187233.71e-142.30e-12217
GO:0198738110ThyroidPTCcell-cell signaling by wnt217/5968446/187236.68e-143.73e-12217
GO:0030111110ThyroidPTCregulation of Wnt signaling pathway163/5968328/187231.05e-114.29e-10163
GO:003017810ThyroidPTCnegative regulation of Wnt signaling pathway74/5968170/187238.99e-045.48e-0374
GO:009028712ThyroidPTCregulation of cellular response to growth factor stimulus120/5968304/187232.87e-031.42e-02120
GO:001605525ThyroidATCWnt signaling pathway234/6293444/187234.64e-174.31e-15234
GO:019873825ThyroidATCcell-cell signaling by wnt234/6293446/187239.26e-178.25e-15234
GO:003011125ThyroidATCregulation of Wnt signaling pathway177/6293328/187231.83e-141.05e-12177
GO:009028721ThyroidATCregulation of cellular response to growth factor stimulus140/6293304/187233.91e-064.33e-05140
Page: 1 2 

check button Enriched KEGG pathways.
Pathway IDTissueDisease StageDescriptionGene RatioBg Ratiopvaluep.adjustqvalueCount
Page: 1 

Top

Cell-cell communication analysis

check buttonIdentification of potential cell-cell interactions between two cell types and their ligand-receptor pairs for different disease states
LigandReceptorLRpairPathwayTissueDisease Stage
Page: 1 

Top

Single-cell gene regulatory network inference analysis

check buttonFind out the significant the regulons (TFs) and the target genes of each regulon across cell types for different disease states
TFCell TypeTissueDisease StageTarget GeneRSSRegulon Activity
∗The dot plots of a searched regulon are shown for all cell subpopulations in each disease state of each tissue based on the regulon specific score inferred using pySCENIC and by calculating the average expression.
Page: 1 

Top

Somatic mutation of malignant transformation related genes

check buttonAnnotation of somatic variants for genes involved in malignant transformation
Hugo SymbolVariant ClassVariant ClassificationdbSNP RSHGVScHGVSpHGVSp ShortSWISSPROTBIOTYPESIFTPolyPhenTumor Sample BarcodeTissueHistologySexAgeStageTherapy TypesDrugsOutcome
SHISA2insertionIn_Frame_Insnovelc.526_527insATGTTTCATCCAGGGTATCATTGATTTATGATGGAAAACp.Ser176delinsTyrValSerSerArgValSerLeuIleTyrAspGlyLysProp.S176delinsYVSSRVSLIYDGKPQ6UWI4protein_codingTCGA-AN-A0FY-01Breastbreast invasive carcinomaFemale<65I/IIUnknownUnknownSD
SHISA2SNVMissense_Mutationc.368N>Tp.Ser123Phep.S123FQ6UWI4protein_codingdeleterious(0)probably_damaging(0.993)TCGA-C5-A1BQ-01Cervixcervical & endocervical cancerFemale>=65III/IVChemotherapycisplatinCR
SHISA2SNVMissense_Mutationrs779132447c.379N>Ap.Ala127Thrp.A127TQ6UWI4protein_codingtolerated(0.06)probably_damaging(0.999)TCGA-A6-2681-01Colorectumcolon adenocarcinomaFemale>=65I/IIUnknownUnknownPD
SHISA2SNVMissense_Mutationc.649T>Cp.Tyr217Hisp.Y217HQ6UWI4protein_codingtolerated(0.11)probably_damaging(0.958)TCGA-A6-6780-01Colorectumcolon adenocarcinomaMale>=65I/IIUnknownUnknownSD
SHISA2SNVMissense_Mutationc.377N>Ap.Val126Aspp.V126DQ6UWI4protein_codingdeleterious(0)probably_damaging(0.998)TCGA-G4-6588-01Colorectumcolon adenocarcinomaFemale<65I/IIUnknownUnknownSD
SHISA2deletionFrame_Shift_Delc.495delNp.Met166Terp.M166*Q6UWI4protein_codingTCGA-AA-3811-01Colorectumcolon adenocarcinomaFemale>=65III/IVUnknownUnknownPD
SHISA2SNVMissense_Mutationnovelc.605N>Tp.Ser202Leup.S202LQ6UWI4protein_codingdeleterious(0.02)possibly_damaging(0.578)TCGA-A5-A0G2-01Endometriumuterine corpus endometrioid carcinomaFemale<65III/IVUnknownUnknownSD
SHISA2SNVMissense_Mutationrs372812470c.590N>Tp.Ala197Valp.A197VQ6UWI4protein_codingtolerated(0.16)benign(0.202)TCGA-AP-A051-01Endometriumuterine corpus endometrioid carcinomaFemale>=65I/IIUnknownUnknownSD
SHISA2SNVMissense_Mutationrs766262628c.752N>Tp.Thr251Metp.T251MQ6UWI4protein_codingdeleterious(0.02)benign(0.168)TCGA-AP-A1DK-01Endometriumuterine corpus endometrioid carcinomaFemale<65I/IIUnknownUnknownSD
SHISA2SNVMissense_Mutationc.406N>Tp.Ala136Serp.A136SQ6UWI4protein_codingtolerated(0.08)probably_damaging(0.997)TCGA-AP-A1DO-01Endometriumuterine corpus endometrioid carcinomaFemale<65I/IIUnknownUnknownSD
Page: 1 2 3 4 

Top

Related drugs of malignant transformation related genes

check buttonIdentification of chemicals and drugs interact with genes involved in malignant transfromation
(DGIdb 4.0)
Entrez IDSymbolCategoryInteraction TypesDrug Claim NameDrug NamePMIDs
Page: 1