
|
|||||
|
 | |
| |
| |
| |
| |
| |
|
Gene: SHE |
Gene summary for SHE |
| Gene information | Species | Human | Gene symbol | SHE | Gene ID | 126669 |
| Gene name | Src homology 2 domain containing E | |
| Gene Alias | SHE | |
| Cytomap | 1q21.3 | |
| Gene Type | protein-coding | GO ID | GO:0001784 | UniProtAcc | Q5VZ18 |
Top |
Malignant transformation analysis |
| Identification of the aberrant gene expression in precancerous and cancerous lesions by comparing the gene expression of stem-like cells in diseased tissues with normal stem cells |
| Entrez ID | Symbol | Replicates | Species | Organ | Tissue | Adj P-value | Log2FC | Malignancy |
| 126669 | SHE | HCC2 | Human | Liver | HCC | 1.20e-28 | 4.33e+00 | 0.5341 |
| 126669 | SHE | HCC5 | Human | Liver | HCC | 1.65e-07 | 7.07e-01 | 0.4932 |
| 126669 | SHE | S029 | Human | Liver | HCC | 7.50e-03 | 1.74e-01 | 0.2581 |
| 126669 | SHE | male-WTA | Human | Thyroid | PTC | 2.41e-46 | 4.45e-01 | 0.1037 |
| 126669 | SHE | PTC01 | Human | Thyroid | PTC | 2.73e-10 | 1.60e-01 | 0.1899 |
| 126669 | SHE | PTC03 | Human | Thyroid | PTC | 8.99e-08 | 2.73e-01 | 0.1784 |
| 126669 | SHE | PTC04 | Human | Thyroid | PTC | 3.48e-12 | 2.44e-01 | 0.1927 |
| 126669 | SHE | PTC05 | Human | Thyroid | PTC | 1.26e-14 | 4.39e-01 | 0.2065 |
| 126669 | SHE | PTC06 | Human | Thyroid | PTC | 1.07e-24 | 6.44e-01 | 0.2057 |
| 126669 | SHE | PTC07 | Human | Thyroid | PTC | 2.38e-25 | 5.37e-01 | 0.2044 |
| 126669 | SHE | ATC13 | Human | Thyroid | ATC | 2.64e-07 | 7.58e-02 | 0.34 |
| 126669 | SHE | ATC5 | Human | Thyroid | ATC | 2.16e-13 | 9.90e-02 | 0.34 |
| Page: 1 |
| Tissue | Expression Dynamics | Abbreviation |
| Liver | 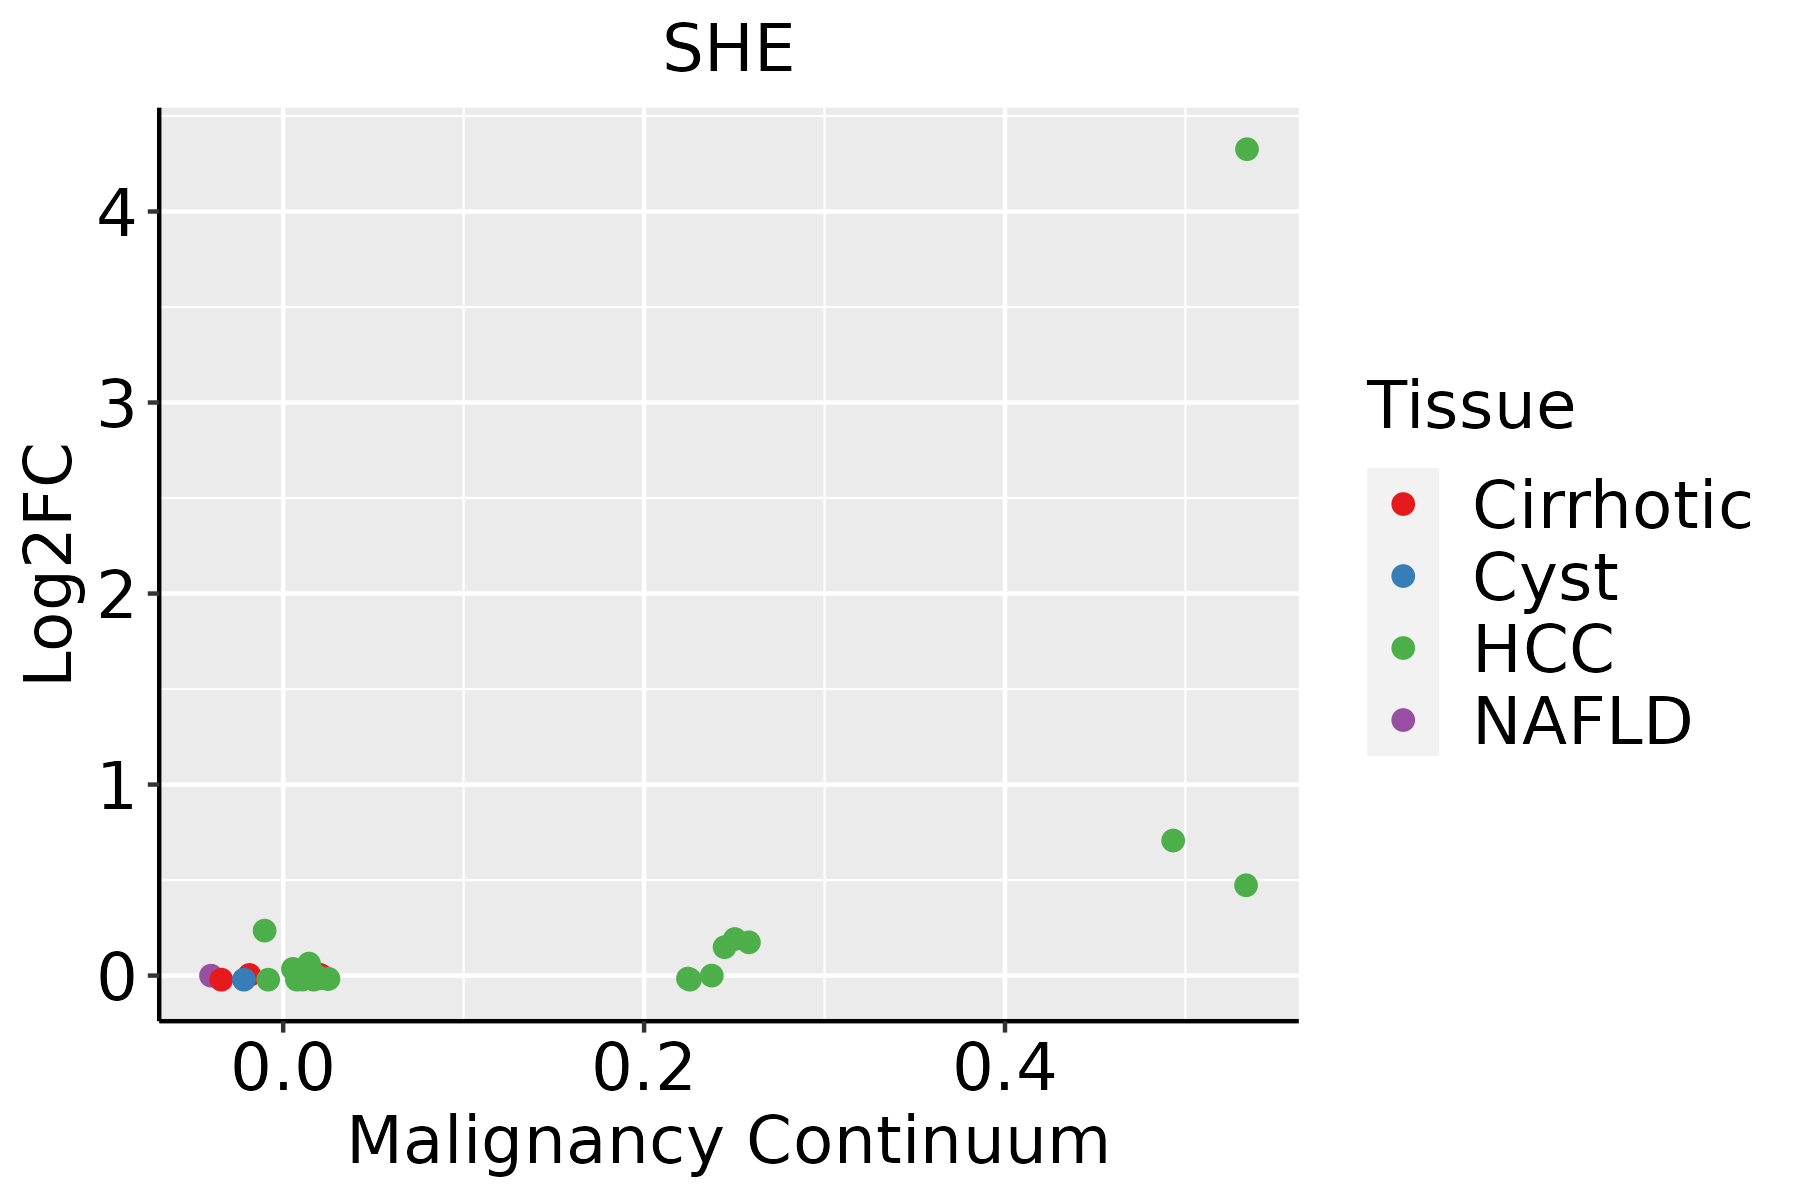 | HCC: Hepatocellular carcinoma |
| NAFLD: Non-alcoholic fatty liver disease | ||
| Thyroid | 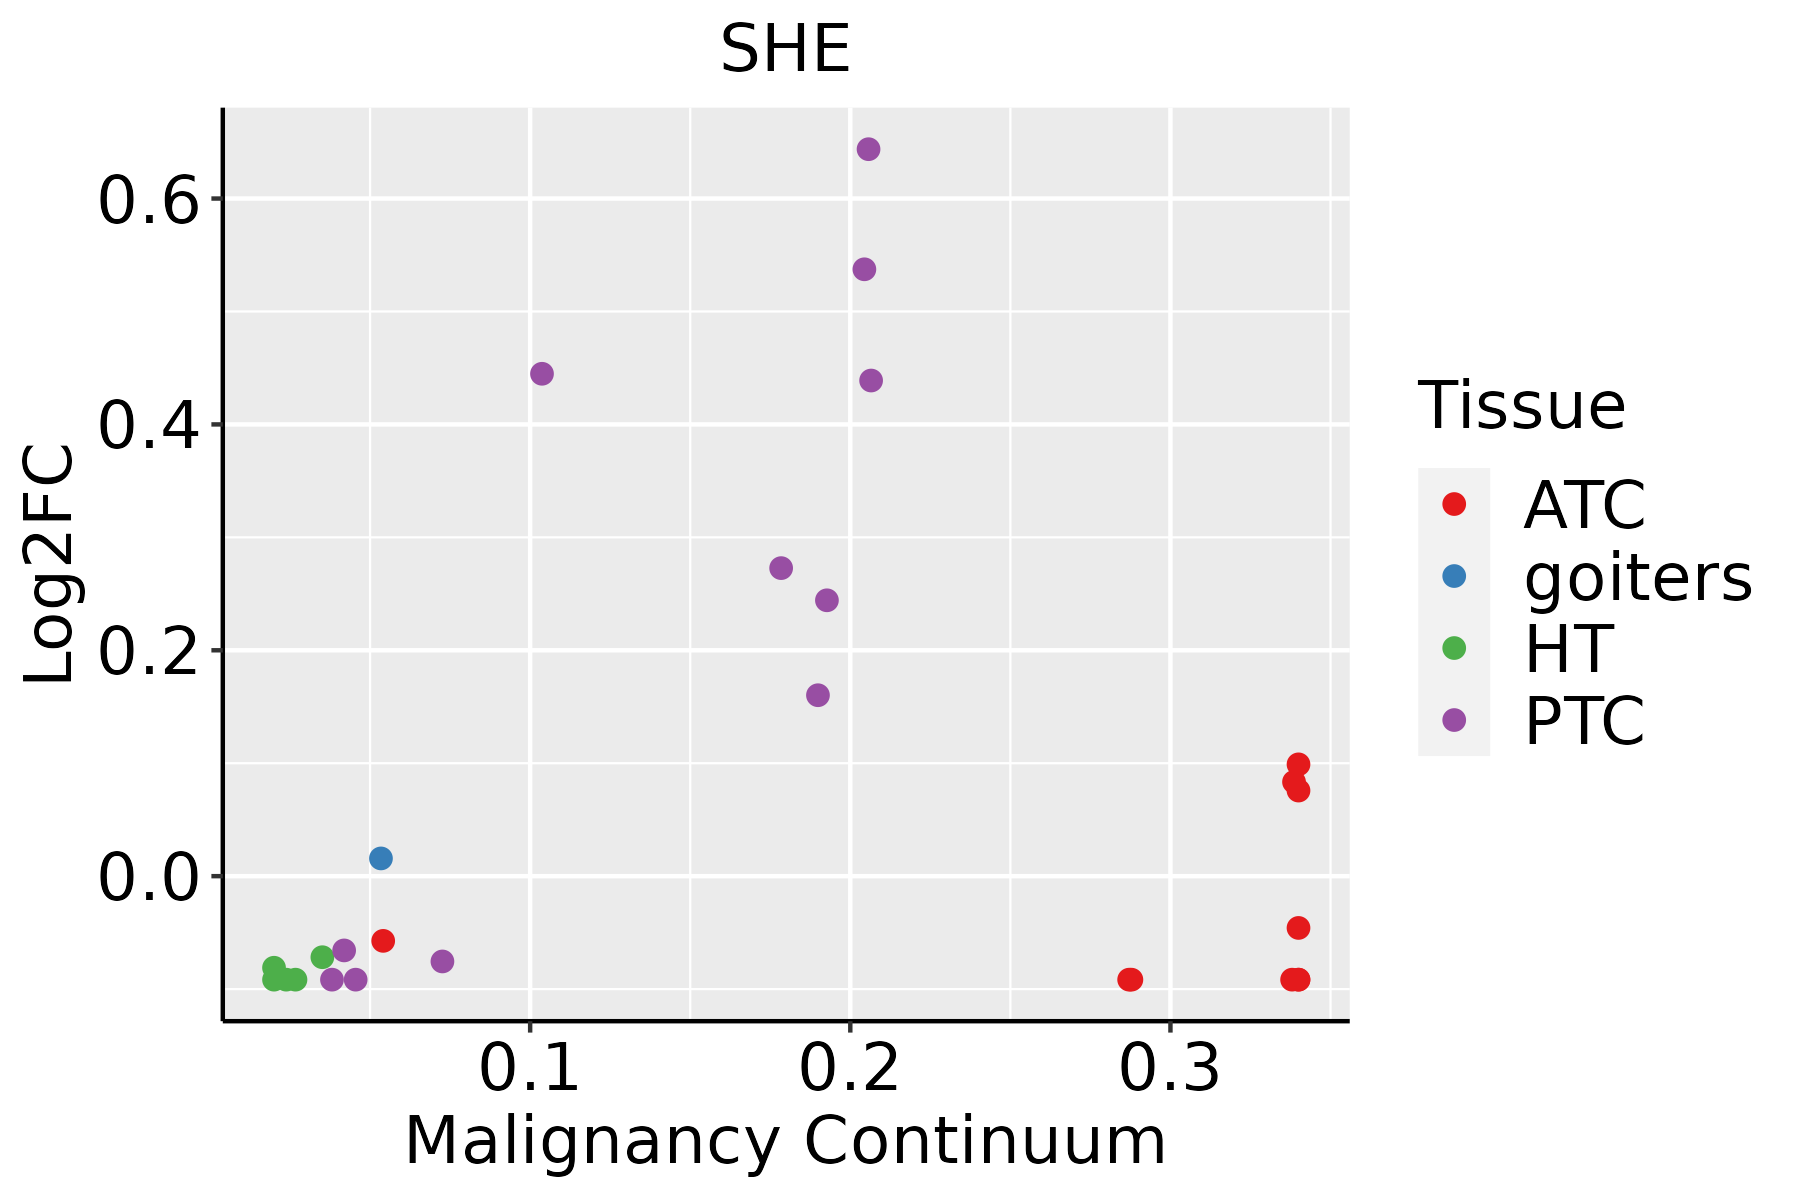 | ATC: Anaplastic thyroid cancer |
| HT: Hashimoto's thyroiditis | ||
| PTC: Papillary thyroid cancer |
| ∗log2FC in expression of this searched gene in stem-like cells from each diseased tissue sample relative to stem-like cells in normal samples in each tissue plotted against the malignancy continuum. Samples are colored based on if they are from different disease stage. |
Top |
Malignant transformation related pathway analysis |
| Find out the enriched GO biological processes and KEGG pathways involved in transition from healthy to precancer to cancer |
| Tissue | Disease Stage | Enriched GO biological Processes |
| Colorectum | AD |  |
| Colorectum | SER |  |
| Colorectum | MSS |  |
| Colorectum | MSI-H |  |
| Colorectum | FAP |  |
| ∗Top 15 enriched GO BP terms are showed in the bar plot of each disease state in each tissue. Each row represents a significant GO biological process which is colored according to the -log10(p.adjust). |
| Page: 1 2 3 4 5 6 7 8 9 |
| GO ID | Tissue | Disease Stage | Description | Gene Ratio | Bg Ratio | pvalue | p.adjust | Count |
| Page: 1 |
| Pathway ID | Tissue | Disease Stage | Description | Gene Ratio | Bg Ratio | pvalue | p.adjust | qvalue | Count |
| Page: 1 |
Top |
Cell-cell communication analysis |
| Identification of potential cell-cell interactions between two cell types and their ligand-receptor pairs for different disease states |
| Ligand | Receptor | LRpair | Pathway | Tissue | Disease Stage |
| Page: 1 |
Top |
Single-cell gene regulatory network inference analysis |
| Find out the significant the regulons (TFs) and the target genes of each regulon across cell types for different disease states |
| TF | Cell Type | Tissue | Disease Stage | Target Gene | RSS | Regulon Activity |
| ∗The dot plots of a searched regulon are shown for all cell subpopulations in each disease state of each tissue based on the regulon specific score inferred using pySCENIC and by calculating the average expression. |
| Page: 1 |
Top |
Somatic mutation of malignant transformation related genes |
| Annotation of somatic variants for genes involved in malignant transformation |
| Hugo Symbol | Variant Class | Variant Classification | dbSNP RS | HGVSc | HGVSp | HGVSp Short | SWISSPROT | BIOTYPE | SIFT | PolyPhen | Tumor Sample Barcode | Tissue | Histology | Sex | Age | Stage | Therapy Types | Drugs | Outcome |
| SHE | SNV | Missense_Mutation | c.829C>T | p.Arg277Trp | p.R277W | Q5VZ18 | protein_coding | deleterious(0) | benign(0.425) | TCGA-A2-A0EX-01 | Breast | breast invasive carcinoma | Female | <65 | I/II | Hormone Therapy | tamoxiphen | SD | |
| SHE | SNV | Missense_Mutation | novel | c.1360N>A | p.Leu454Met | p.L454M | Q5VZ18 | protein_coding | deleterious(0) | probably_damaging(0.993) | TCGA-AC-A2BK-01 | Breast | breast invasive carcinoma | Female | >=65 | III/IV | Chemotherapy | cytoxan | CR |
| SHE | SNV | Missense_Mutation | rs762087743 | c.1295N>T | p.Ala432Val | p.A432V | Q5VZ18 | protein_coding | deleterious(0) | probably_damaging(0.999) | TCGA-AO-A124-01 | Breast | breast invasive carcinoma | Female | <65 | I/II | Chemotherapy | doxorubicin | SD |
| SHE | SNV | Missense_Mutation | c.1309N>G | p.Gln437Glu | p.Q437E | Q5VZ18 | protein_coding | deleterious(0) | possibly_damaging(0.891) | TCGA-D8-A1JA-01 | Breast | breast invasive carcinoma | Female | <65 | III/IV | Chemotherapy | adriamycin | PD | |
| SHE | SNV | Missense_Mutation | c.553N>A | p.Glu185Lys | p.E185K | Q5VZ18 | protein_coding | deleterious(0.04) | possibly_damaging(0.692) | TCGA-EW-A1PB-01 | Breast | breast invasive carcinoma | Female | >=65 | III/IV | Unknown | Unknown | SD | |
| SHE | insertion | Nonsense_Mutation | novel | c.367_368insATGTTATTCAGTGGTCCACCTGACTGTGTGAC | p.Ser123TyrfsTer8 | p.S123Yfs*8 | Q5VZ18 | protein_coding | TCGA-A2-A0D2-01 | Breast | breast invasive carcinoma | Female | <65 | I/II | Chemotherapy | adriamycin | SD | ||
| SHE | insertion | In_Frame_Ins | novel | c.481_482insTTGTTAGCAGTTTAGGAGAGTCGTTGAATG | p.Tyr161delinsPheValSerSerLeuGlyGluSerLeuAsnAsp | p.Y161delinsFVSSLGESLND | Q5VZ18 | protein_coding | TCGA-A8-A07R-01 | Breast | breast invasive carcinoma | Female | >=65 | III/IV | Ancillary | zoledronic | SD | ||
| SHE | insertion | Frame_Shift_Ins | novel | c.1112_1113insTCGGCCTCCCACAGTGCTGGGATACAGGCGTGAGC | p.Lys372ArgfsTer74 | p.K372Rfs*74 | Q5VZ18 | protein_coding | TCGA-A8-A09N-01 | Breast | breast invasive carcinoma | Female | <65 | III/IV | Unknown | Unknown | SD | ||
| SHE | insertion | Nonsense_Mutation | novel | c.1036_1037insAATGCAAAATTGGTATTGGGTAAAT | p.Gly346GlufsTer8 | p.G346Efs*8 | Q5VZ18 | protein_coding | TCGA-A8-A09X-01 | Breast | breast invasive carcinoma | Female | <65 | III/IV | Unknown | Unknown | SD | ||
| SHE | insertion | Frame_Shift_Ins | novel | c.1034_1035insTG | p.Glu345AspfsTer14 | p.E345Dfs*14 | Q5VZ18 | protein_coding | TCGA-A8-A09X-01 | Breast | breast invasive carcinoma | Female | <65 | III/IV | Unknown | Unknown | SD |
| Page: 1 2 3 4 5 6 |
Top |
Related drugs of malignant transformation related genes |
| Identification of chemicals and drugs interact with genes involved in malignant transfromation |
| (DGIdb 4.0) |
| Entrez ID | Symbol | Category | Interaction Types | Drug Claim Name | Drug Name | PMIDs |
| Page: 1 |

Copyright 2023-Present -The University of Texas Health Science Center at Houston |