
|
|||||
|
 | |
| |
| |
| |
| |
| |
|
Gene: SHB |
Gene summary for SHB |
| Gene information | Species | Human | Gene symbol | SHB | Gene ID | 6461 |
| Gene name | SH2 domain containing adaptor protein B | |
| Gene Alias | bA3J10.2 | |
| Cytomap | 9p13.1 | |
| Gene Type | protein-coding | GO ID | GO:0001525 | UniProtAcc | Q15464 |
Top |
Malignant transformation analysis |
| Identification of the aberrant gene expression in precancerous and cancerous lesions by comparing the gene expression of stem-like cells in diseased tissues with normal stem cells |
| Entrez ID | Symbol | Replicates | Species | Organ | Tissue | Adj P-value | Log2FC | Malignancy |
| 6461 | SHB | HCC1_Meng | Human | Liver | HCC | 2.58e-16 | -2.50e-02 | 0.0246 |
| 6461 | SHB | HCC2_Meng | Human | Liver | HCC | 6.71e-21 | 1.07e-01 | 0.0107 |
| 6461 | SHB | cirrhotic2 | Human | Liver | Cirrhotic | 5.51e-03 | 3.90e-02 | 0.0201 |
| 6461 | SHB | S027 | Human | Liver | HCC | 1.16e-12 | 8.74e-01 | 0.2446 |
| 6461 | SHB | S028 | Human | Liver | HCC | 2.79e-18 | 8.60e-01 | 0.2503 |
| 6461 | SHB | S029 | Human | Liver | HCC | 8.16e-10 | 4.72e-01 | 0.2581 |
| 6461 | SHB | RNA-P17T-P17T-2 | Human | Lung | IAC | 5.20e-03 | 5.32e-01 | 0.3371 |
| 6461 | SHB | RNA-P17T-P17T-8 | Human | Lung | IAC | 5.87e-04 | 5.04e-01 | 0.3329 |
| 6461 | SHB | C04 | Human | Oral cavity | OSCC | 3.87e-06 | 5.10e-01 | 0.2633 |
| 6461 | SHB | C21 | Human | Oral cavity | OSCC | 1.68e-03 | 3.04e-01 | 0.2678 |
| 6461 | SHB | C30 | Human | Oral cavity | OSCC | 4.24e-42 | 1.99e+00 | 0.3055 |
| 6461 | SHB | C43 | Human | Oral cavity | OSCC | 9.56e-33 | 6.39e-01 | 0.1704 |
| 6461 | SHB | C46 | Human | Oral cavity | OSCC | 6.61e-11 | 3.13e-01 | 0.1673 |
| 6461 | SHB | C51 | Human | Oral cavity | OSCC | 9.72e-11 | 6.92e-01 | 0.2674 |
| 6461 | SHB | C57 | Human | Oral cavity | OSCC | 3.06e-05 | 2.90e-01 | 0.1679 |
| 6461 | SHB | C08 | Human | Oral cavity | OSCC | 3.86e-24 | 5.09e-01 | 0.1919 |
| 6461 | SHB | C09 | Human | Oral cavity | OSCC | 4.22e-06 | 3.58e-01 | 0.1431 |
| 6461 | SHB | LN46 | Human | Oral cavity | OSCC | 5.70e-09 | 6.13e-01 | 0.1666 |
| 6461 | SHB | SYSMH1 | Human | Oral cavity | OSCC | 2.28e-08 | 2.07e-01 | 0.1127 |
| 6461 | SHB | SYSMH2 | Human | Oral cavity | OSCC | 1.40e-14 | 3.23e-01 | 0.2326 |
| Page: 1 2 3 |
| Tissue | Expression Dynamics | Abbreviation |
| Liver |  | HCC: Hepatocellular carcinoma |
| NAFLD: Non-alcoholic fatty liver disease | ||
| Lung |  | AAH: Atypical adenomatous hyperplasia |
| AIS: Adenocarcinoma in situ | ||
| IAC: Invasive lung adenocarcinoma | ||
| MIA: Minimally invasive adenocarcinoma | ||
| Oral Cavity | 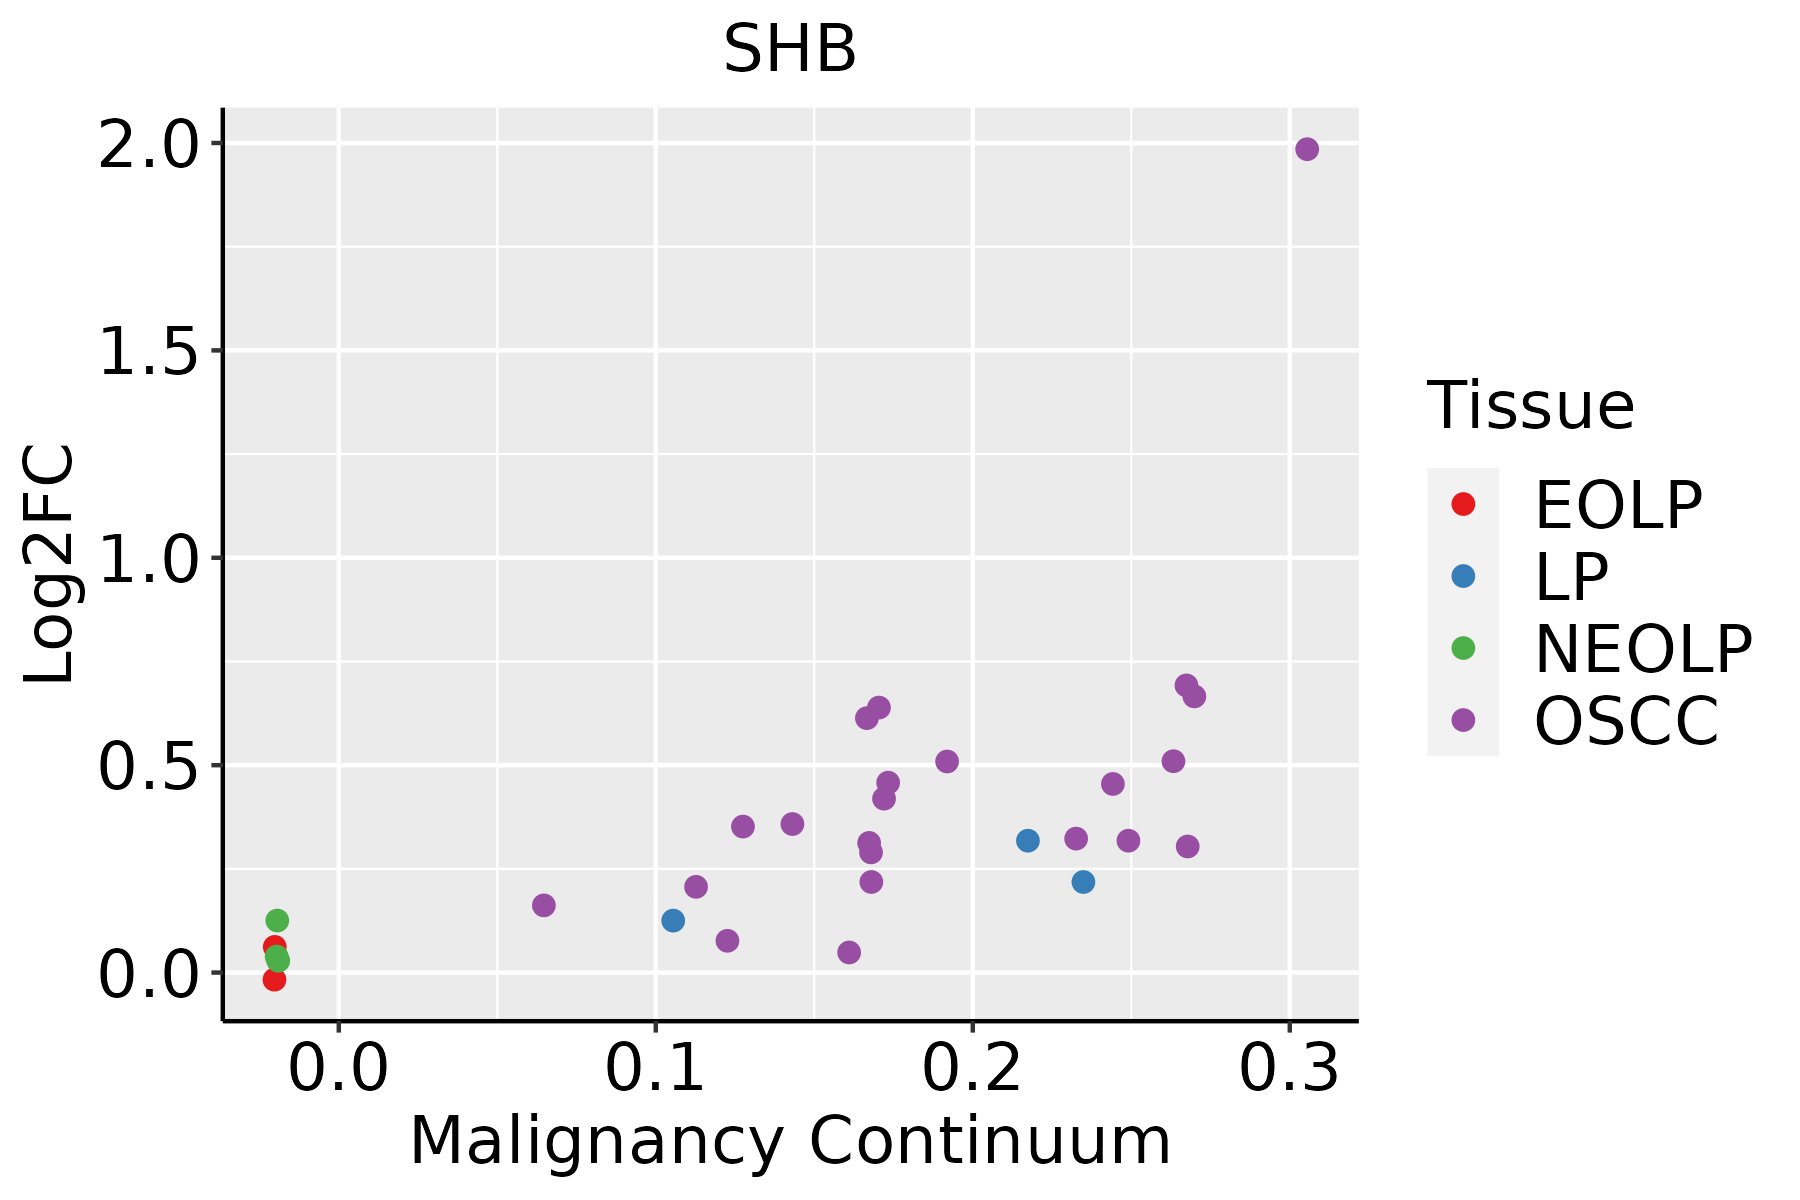 | EOLP: Erosive Oral lichen planus |
| LP: leukoplakia | ||
| NEOLP: Non-erosive oral lichen planus | ||
| OSCC: Oral squamous cell carcinoma | ||
| Prostate | 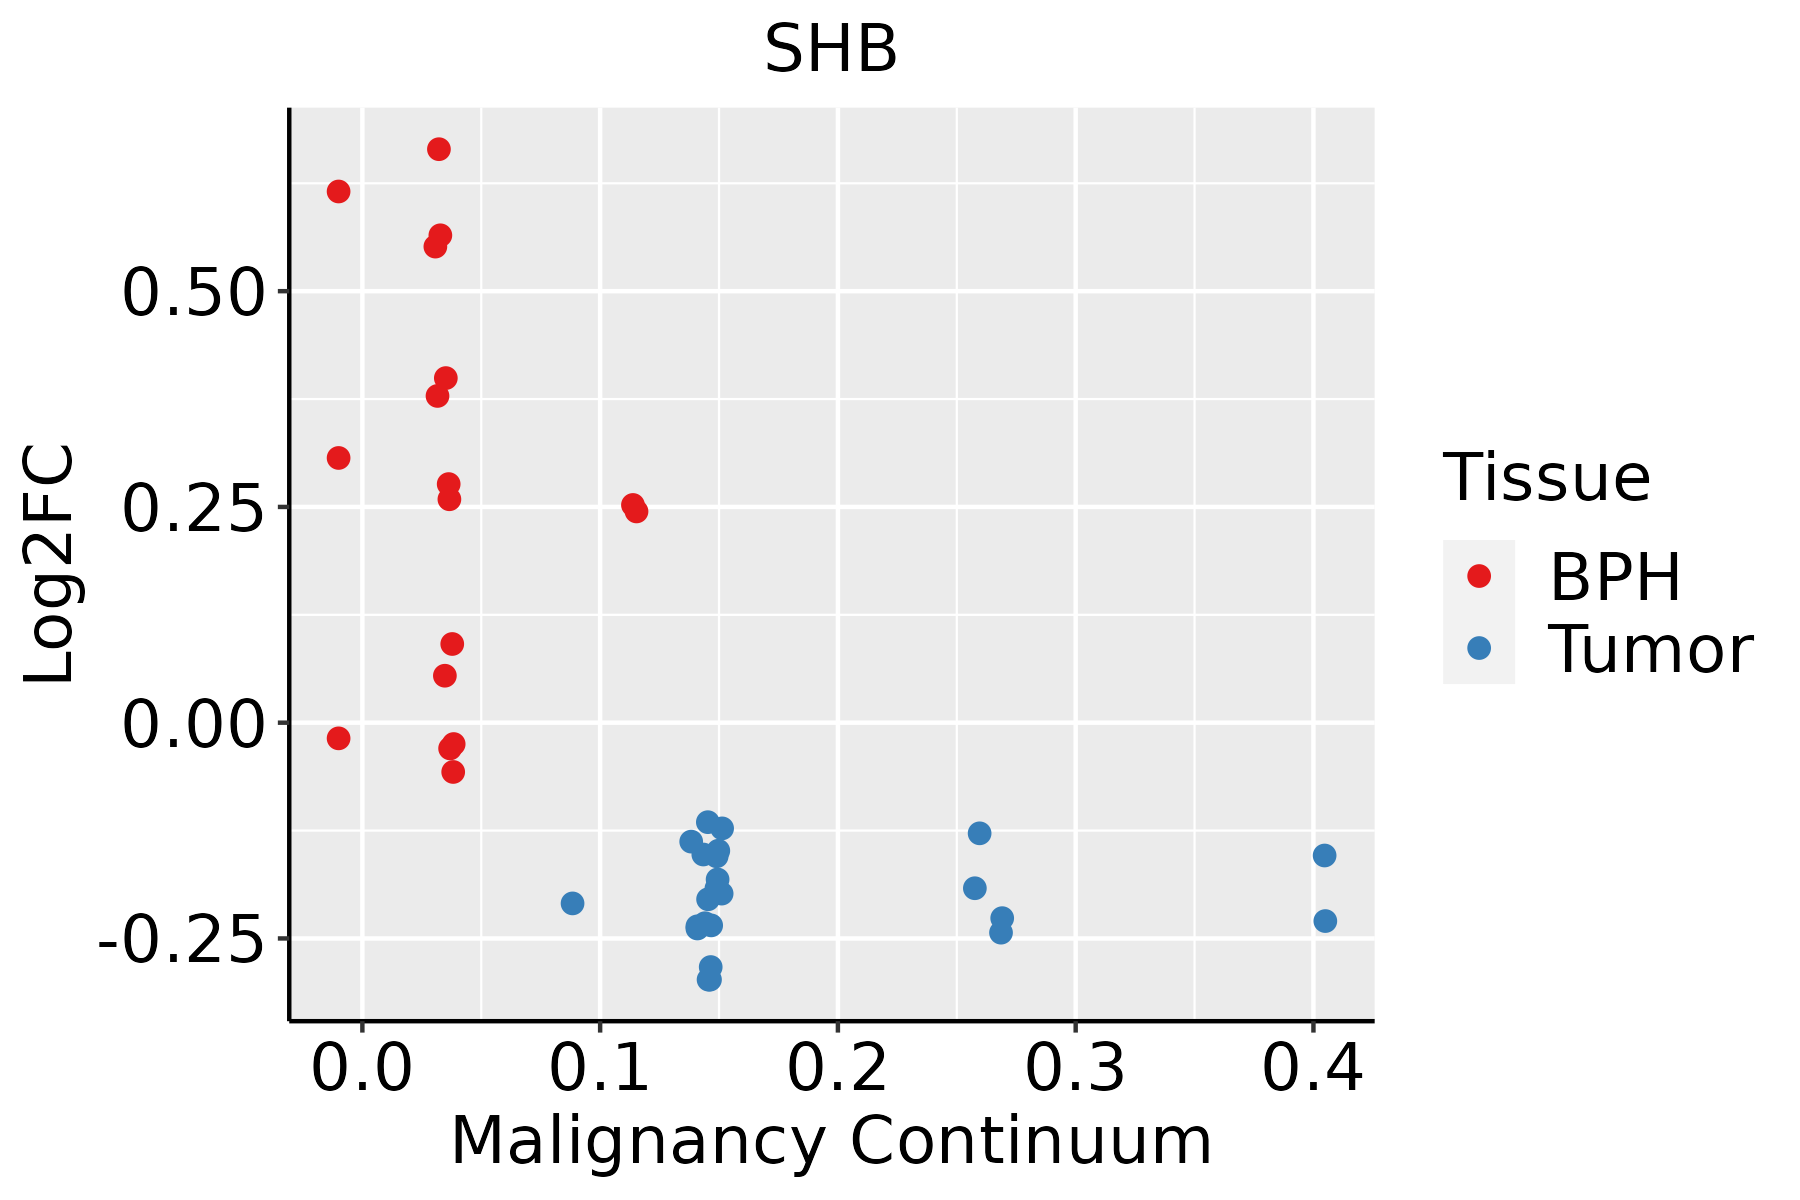 | BPH: Benign Prostatic Hyperplasia |
| Skin | 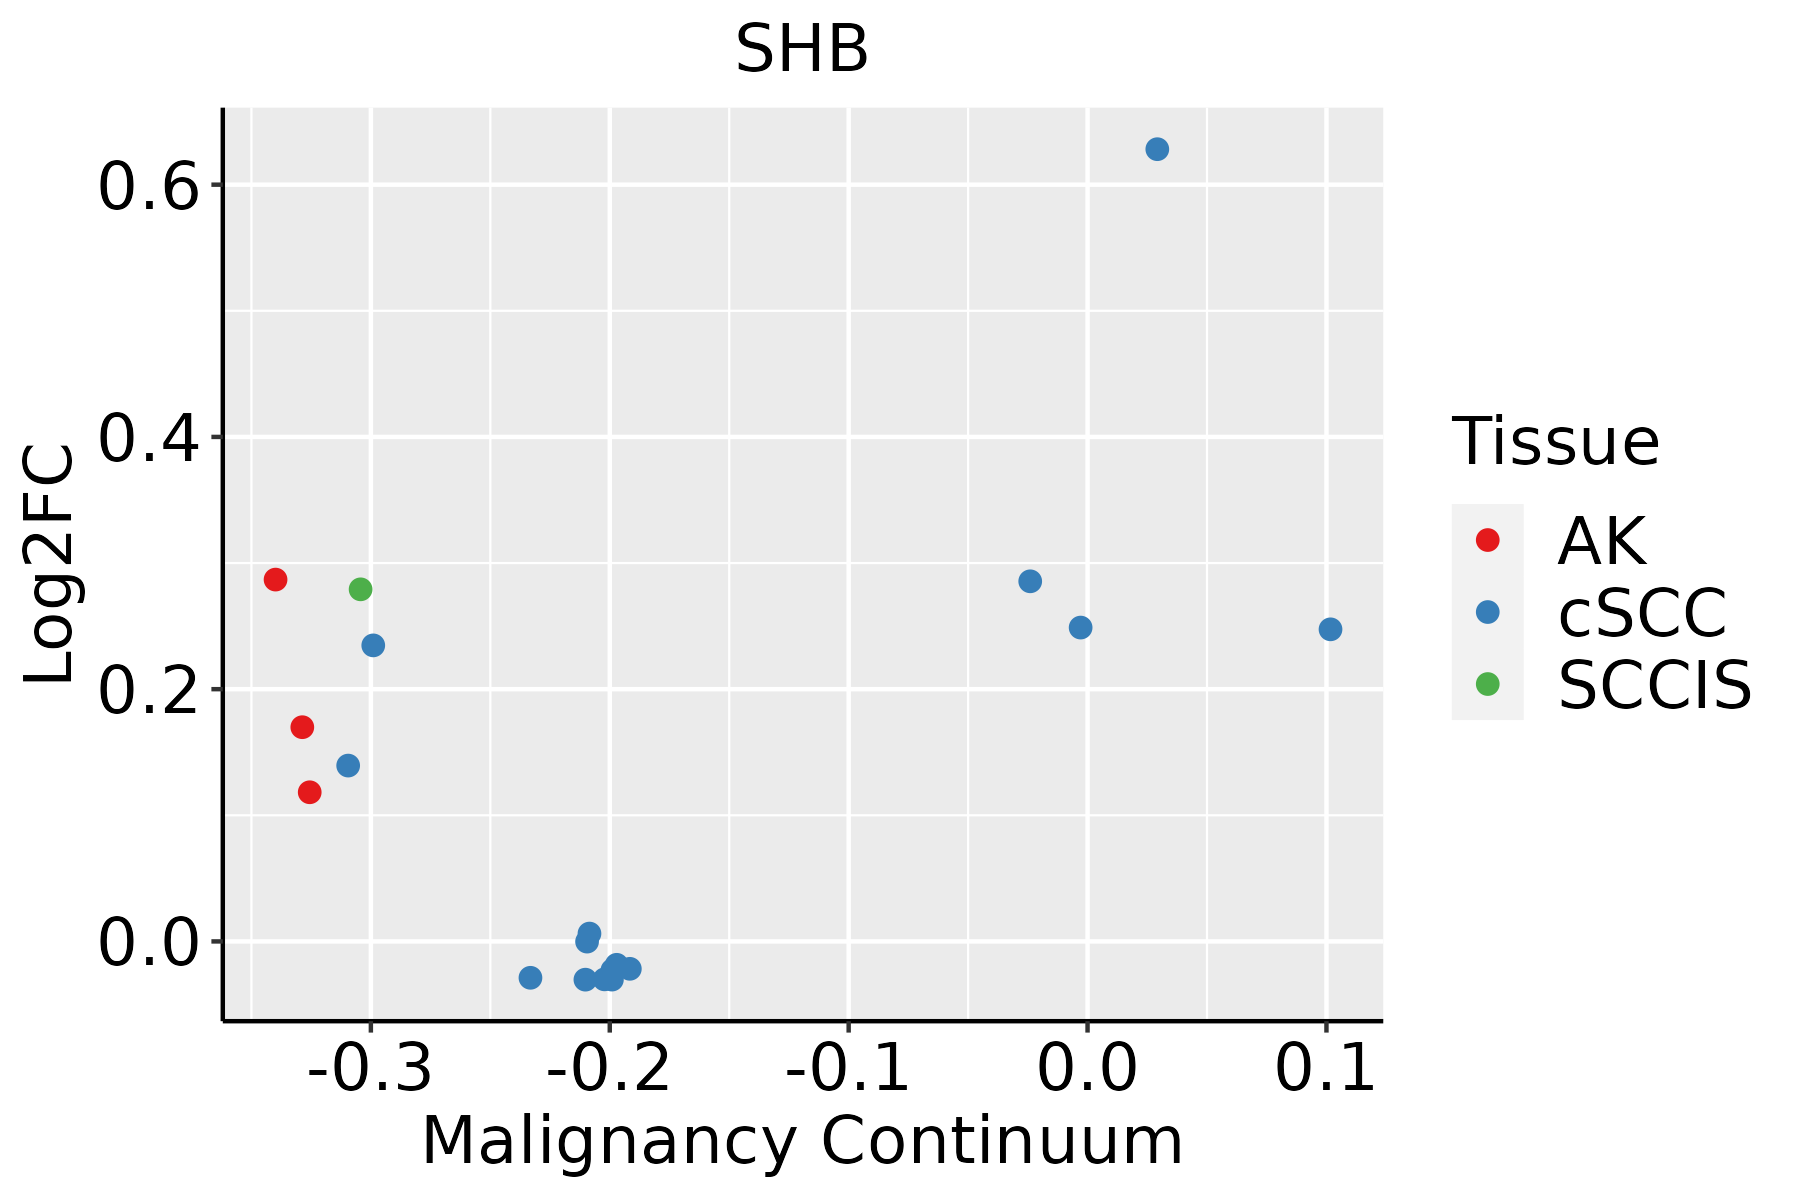 | AK: Actinic keratosis |
| cSCC: Cutaneous squamous cell carcinoma | ||
| SCCIS:squamous cell carcinoma in situ |
| ∗log2FC in expression of this searched gene in stem-like cells from each diseased tissue sample relative to stem-like cells in normal samples in each tissue plotted against the malignancy continuum. Samples are colored based on if they are from different disease stage. |
Top |
Malignant transformation related pathway analysis |
| Find out the enriched GO biological processes and KEGG pathways involved in transition from healthy to precancer to cancer |
| Tissue | Disease Stage | Enriched GO biological Processes |
| Colorectum | AD |  |
| Colorectum | SER |  |
| Colorectum | MSS |  |
| Colorectum | MSI-H |  |
| Colorectum | FAP |  |
| ∗Top 15 enriched GO BP terms are showed in the bar plot of each disease state in each tissue. Each row represents a significant GO biological process which is colored according to the -log10(p.adjust). |
| Page: 1 2 3 4 5 6 7 8 9 |
| GO ID | Tissue | Disease Stage | Description | Gene Ratio | Bg Ratio | pvalue | p.adjust | Count |
| Page: 1 |
| Pathway ID | Tissue | Disease Stage | Description | Gene Ratio | Bg Ratio | pvalue | p.adjust | qvalue | Count |
| Page: 1 |
Top |
Cell-cell communication analysis |
| Identification of potential cell-cell interactions between two cell types and their ligand-receptor pairs for different disease states |
| Ligand | Receptor | LRpair | Pathway | Tissue | Disease Stage |
| Page: 1 |
Top |
Single-cell gene regulatory network inference analysis |
| Find out the significant the regulons (TFs) and the target genes of each regulon across cell types for different disease states |
| TF | Cell Type | Tissue | Disease Stage | Target Gene | RSS | Regulon Activity |
| ∗The dot plots of a searched regulon are shown for all cell subpopulations in each disease state of each tissue based on the regulon specific score inferred using pySCENIC and by calculating the average expression. |
| Page: 1 |
Top |
Somatic mutation of malignant transformation related genes |
| Annotation of somatic variants for genes involved in malignant transformation |
| Hugo Symbol | Variant Class | Variant Classification | dbSNP RS | HGVSc | HGVSp | HGVSp Short | SWISSPROT | BIOTYPE | SIFT | PolyPhen | Tumor Sample Barcode | Tissue | Histology | Sex | Age | Stage | Therapy Types | Drugs | Outcome |
| SHB | SNV | Missense_Mutation | novel | c.1235N>C | p.His412Pro | p.H412P | Q15464 | protein_coding | deleterious(0) | probably_damaging(0.999) | TCGA-D8-A1JL-01 | Breast | breast invasive carcinoma | Female | >=65 | I/II | Unknown | Unknown | SD |
| SHB | SNV | Missense_Mutation | novel | c.1274N>A | p.Arg425Gln | p.R425Q | Q15464 | protein_coding | tolerated(0.13) | possibly_damaging(0.684) | TCGA-2W-A8YY-01 | Cervix | cervical & endocervical cancer | Female | <65 | I/II | Chemotherapy | cisplatin | CR |
| SHB | SNV | Missense_Mutation | novel | c.844N>A | p.Gln282Lys | p.Q282K | Q15464 | protein_coding | deleterious(0.04) | possibly_damaging(0.9) | TCGA-EK-A2RK-01 | Cervix | cervical & endocervical cancer | Female | >=65 | I/II | Unknown | Unknown | SD |
| SHB | SNV | Missense_Mutation | c.1123C>T | p.Arg375Cys | p.R375C | Q15464 | protein_coding | deleterious(0) | probably_damaging(0.981) | TCGA-IR-A3LK-01 | Cervix | cervical & endocervical cancer | Female | >=65 | I/II | Chemotherapy | cisplatin | PD | |
| SHB | SNV | Missense_Mutation | c.1087N>C | p.Ser363Pro | p.S363P | Q15464 | protein_coding | tolerated(0.11) | possibly_damaging(0.731) | TCGA-AA-3492-01 | Colorectum | colon adenocarcinoma | Female | >=65 | I/II | Unknown | Unknown | SD | |
| SHB | SNV | Missense_Mutation | rs550122136 | c.1115G>A | p.Arg372His | p.R372H | Q15464 | protein_coding | tolerated(0.07) | possibly_damaging(0.661) | TCGA-AA-3713-01 | Colorectum | colon adenocarcinoma | Male | >=65 | III/IV | Chemotherapy | 5-fluorouracil | PR |
| SHB | SNV | Missense_Mutation | c.1060N>C | p.Phe354Leu | p.F354L | Q15464 | protein_coding | deleterious(0.03) | possibly_damaging(0.525) | TCGA-CM-5861-01 | Colorectum | colon adenocarcinoma | Female | <65 | I/II | Unknown | Unknown | PD | |
| SHB | SNV | Missense_Mutation | c.1519A>T | p.Arg507Trp | p.R507W | Q15464 | protein_coding | deleterious(0) | probably_damaging(0.962) | TCGA-G4-6294-01 | Colorectum | colon adenocarcinoma | Male | >=65 | III/IV | Chemotherapy | fluorouracil | PD | |
| SHB | SNV | Missense_Mutation | novel | c.1000N>A | p.Asp334Asn | p.D334N | Q15464 | protein_coding | deleterious(0) | probably_damaging(0.99) | TCGA-A5-A1OF-01 | Endometrium | uterine corpus endometrioid carcinoma | Female | <65 | I/II | Unknown | Unknown | SD |
| SHB | SNV | Missense_Mutation | novel | c.760N>G | p.Asn254Asp | p.N254D | Q15464 | protein_coding | tolerated(0.63) | benign(0.015) | TCGA-A5-A1OF-01 | Endometrium | uterine corpus endometrioid carcinoma | Female | <65 | I/II | Unknown | Unknown | SD |
| Page: 1 2 3 4 |
Top |
Related drugs of malignant transformation related genes |
| Identification of chemicals and drugs interact with genes involved in malignant transfromation |
| (DGIdb 4.0) |
| Entrez ID | Symbol | Category | Interaction Types | Drug Claim Name | Drug Name | PMIDs |
| Page: 1 |

Copyright 2023-Present -The University of Texas Health Science Center at Houston |