
|
|||||
|
 | |
| |
| |
| |
| |
| |
|
Gene: SHARPIN |
Gene summary for SHARPIN |
| Gene information | Species | Human | Gene symbol | SHARPIN | Gene ID | 81858 |
| Gene name | SHANK associated RH domain interactor | |
| Gene Alias | SIPL1 | |
| Cytomap | 8q24.3 | |
| Gene Type | protein-coding | GO ID | GO:0000209 | UniProtAcc | Q6PJD5 |
Top |
Malignant transformation analysis |
| Identification of the aberrant gene expression in precancerous and cancerous lesions by comparing the gene expression of stem-like cells in diseased tissues with normal stem cells |
| Entrez ID | Symbol | Replicates | Species | Organ | Tissue | Adj P-value | Log2FC | Malignancy |
| 81858 | SHARPIN | GSM4909281 | Human | Breast | IDC | 1.02e-06 | 2.81e-01 | 0.21 |
| 81858 | SHARPIN | GSM4909285 | Human | Breast | IDC | 7.46e-04 | 2.17e-01 | 0.21 |
| 81858 | SHARPIN | GSM4909297 | Human | Breast | IDC | 2.01e-05 | 3.72e-02 | 0.1517 |
| 81858 | SHARPIN | GSM4909304 | Human | Breast | IDC | 8.14e-15 | 3.61e-01 | 0.1636 |
| 81858 | SHARPIN | GSM4909306 | Human | Breast | IDC | 7.23e-11 | 4.19e-01 | 0.1564 |
| 81858 | SHARPIN | GSM4909311 | Human | Breast | IDC | 2.38e-12 | 1.14e-01 | 0.1534 |
| 81858 | SHARPIN | GSM4909312 | Human | Breast | IDC | 4.52e-08 | 3.27e-01 | 0.1552 |
| 81858 | SHARPIN | GSM4909317 | Human | Breast | IDC | 5.03e-03 | 3.07e-01 | 0.1355 |
| 81858 | SHARPIN | GSM4909319 | Human | Breast | IDC | 5.58e-20 | 1.71e-01 | 0.1563 |
| 81858 | SHARPIN | GSM4909320 | Human | Breast | IDC | 1.45e-04 | 1.86e-01 | 0.1575 |
| 81858 | SHARPIN | GSM4909321 | Human | Breast | IDC | 7.53e-08 | 2.55e-01 | 0.1559 |
| 81858 | SHARPIN | brca2 | Human | Breast | Precancer | 4.52e-03 | 1.89e-01 | -0.024 |
| 81858 | SHARPIN | brca3 | Human | Breast | Precancer | 2.49e-02 | 1.23e-01 | -0.0263 |
| 81858 | SHARPIN | NCCBC14 | Human | Breast | DCIS | 4.50e-02 | -8.19e-02 | 0.2021 |
| 81858 | SHARPIN | P1 | Human | Breast | IDC | 7.63e-04 | -1.49e-02 | 0.1527 |
| 81858 | SHARPIN | DCIS2 | Human | Breast | DCIS | 1.43e-35 | 1.00e-01 | 0.0085 |
| 81858 | SHARPIN | LZE2T | Human | Esophagus | ESCC | 2.49e-02 | 3.96e-01 | 0.082 |
| 81858 | SHARPIN | LZE4T | Human | Esophagus | ESCC | 4.16e-16 | 3.71e-01 | 0.0811 |
| 81858 | SHARPIN | LZE5T | Human | Esophagus | ESCC | 2.91e-05 | 3.71e-01 | 0.0514 |
| 81858 | SHARPIN | LZE7T | Human | Esophagus | ESCC | 2.80e-07 | 2.14e-01 | 0.0667 |
| Page: 1 2 3 4 5 6 7 8 |
| Tissue | Expression Dynamics | Abbreviation |
| Breast | 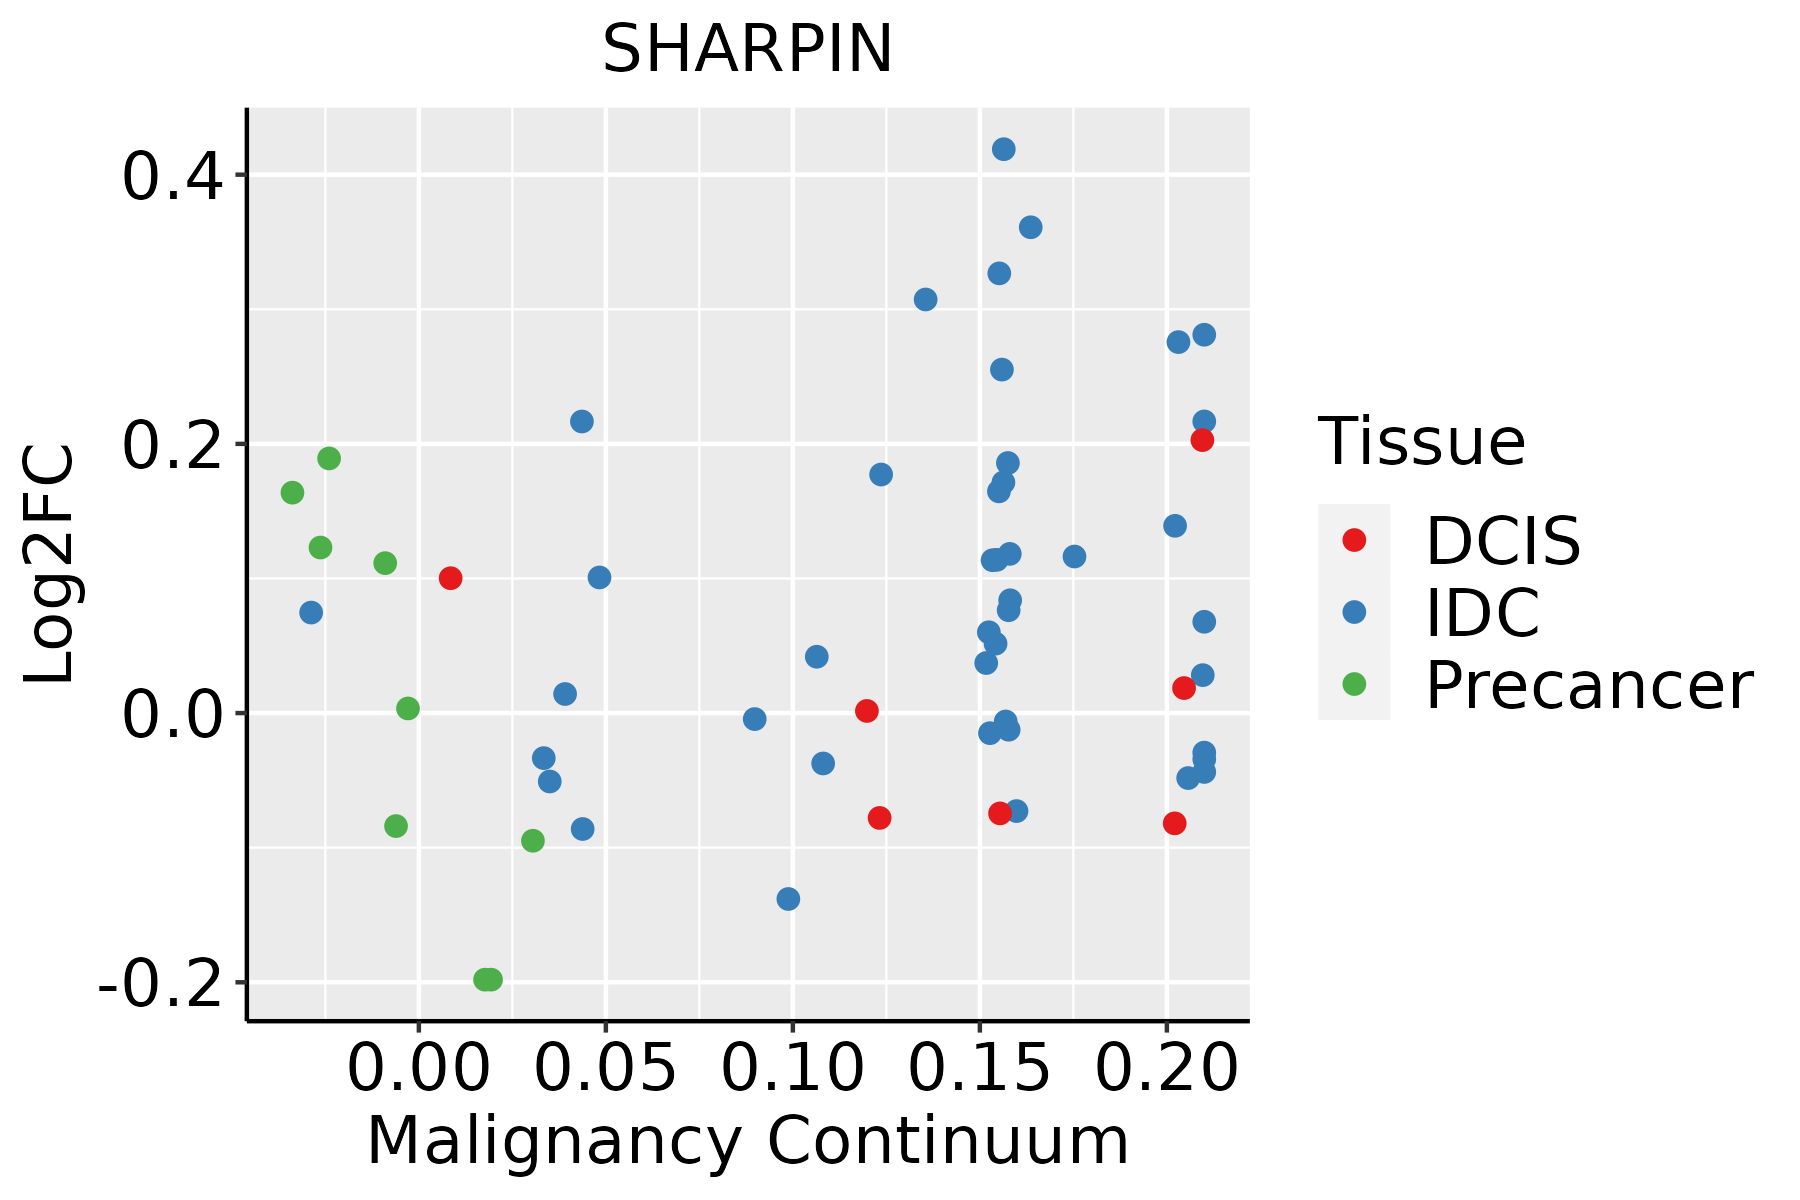 | IDC: Invasive ductal carcinoma |
| DCIS: Ductal carcinoma in situ | ||
| Precancer(BRCA1-mut): Precancerous lesion from BRCA1 mutation carriers | ||
| Esophagus | 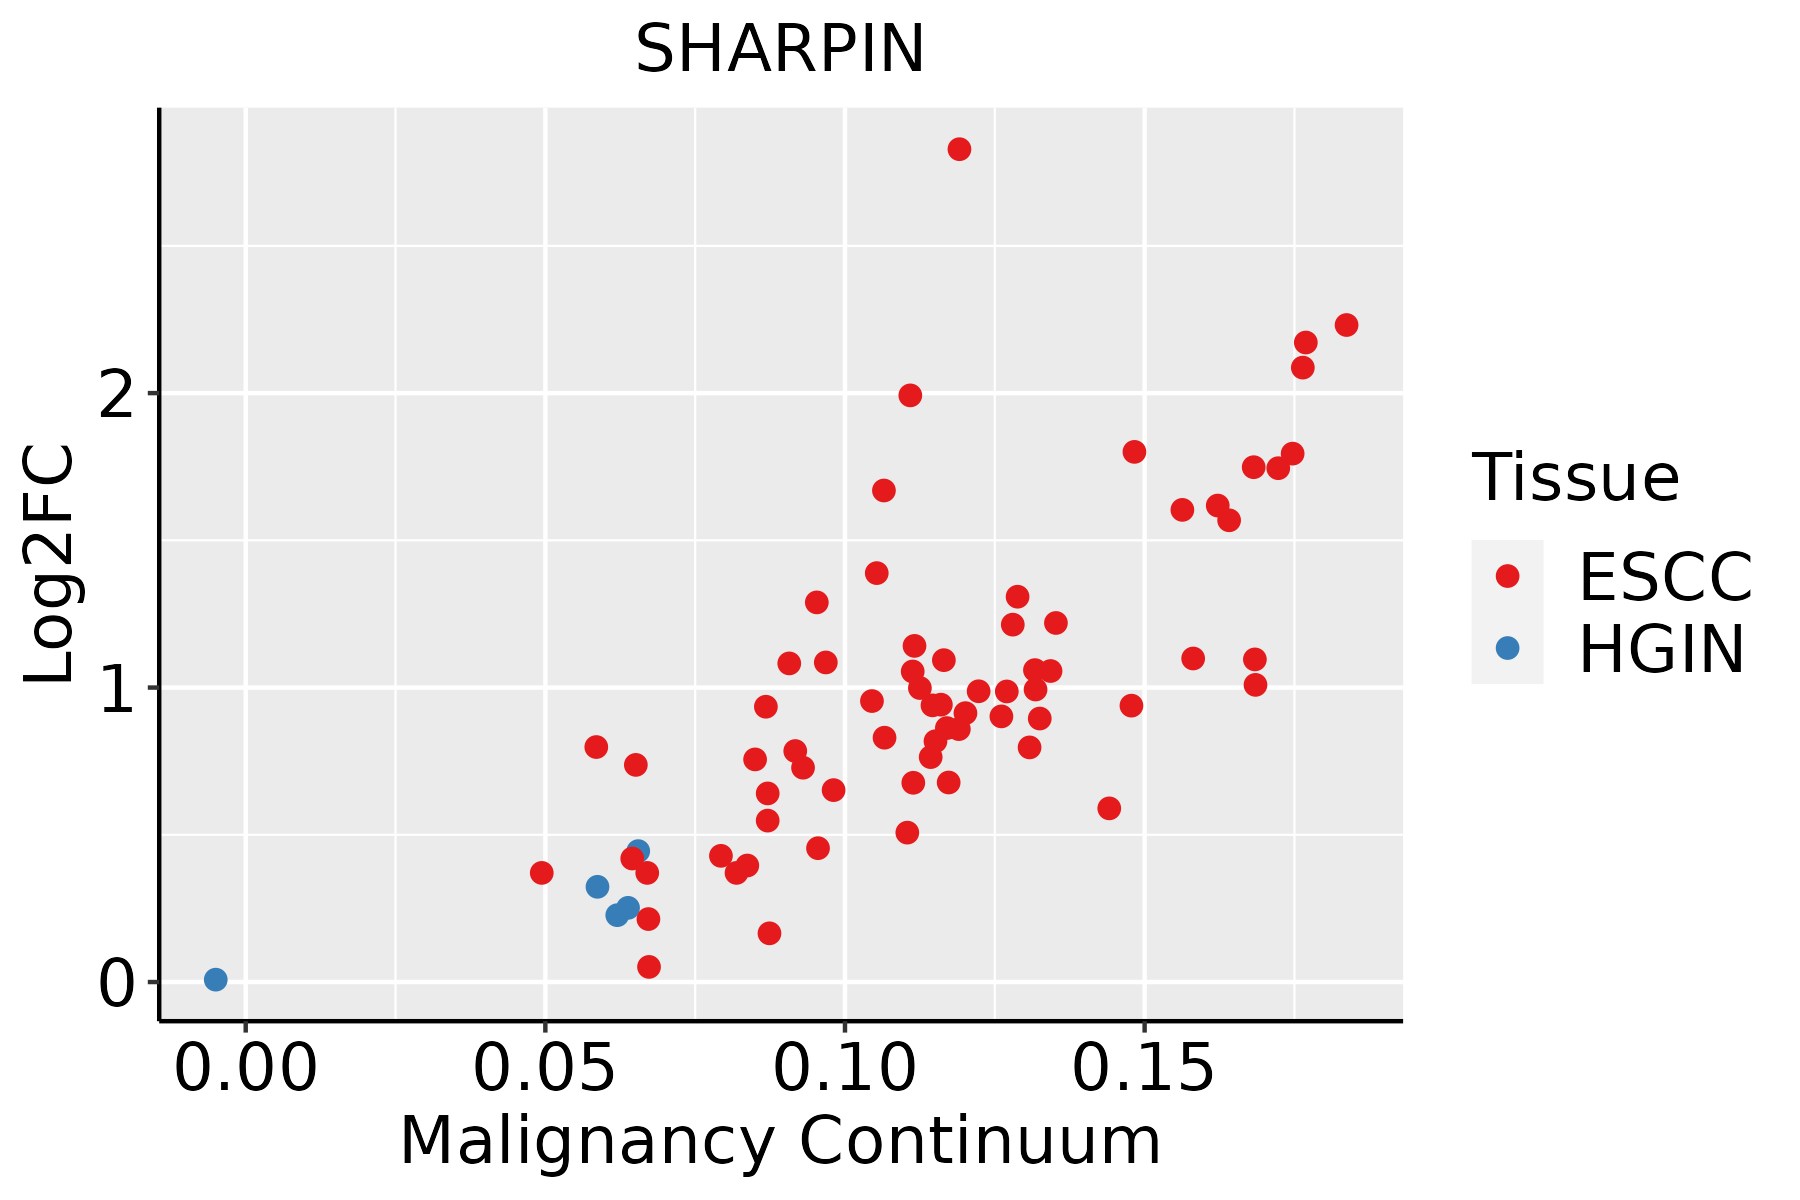 | ESCC: Esophageal squamous cell carcinoma |
| HGIN: High-grade intraepithelial neoplasias | ||
| LGIN: Low-grade intraepithelial neoplasias | ||
| Liver | 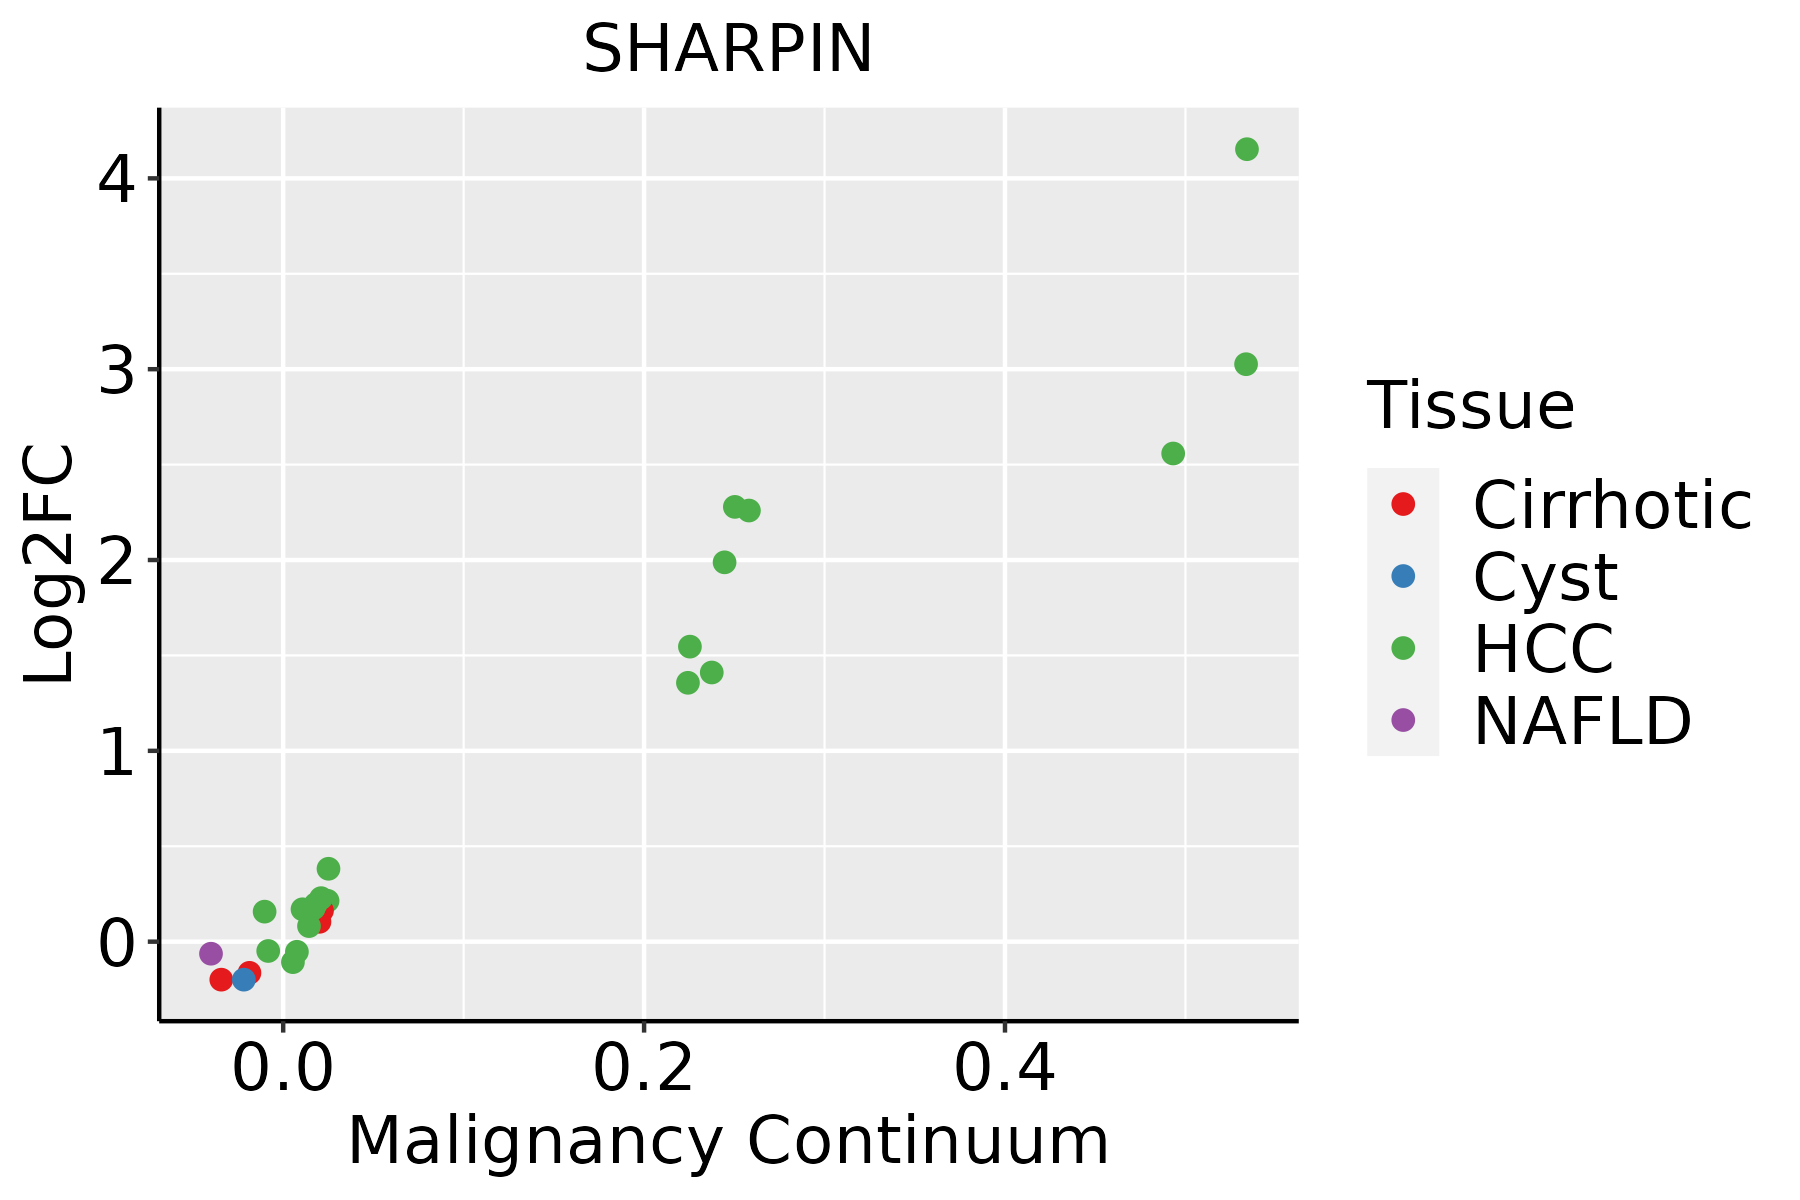 | HCC: Hepatocellular carcinoma |
| NAFLD: Non-alcoholic fatty liver disease | ||
| Oral Cavity |  | EOLP: Erosive Oral lichen planus |
| LP: leukoplakia | ||
| NEOLP: Non-erosive oral lichen planus | ||
| OSCC: Oral squamous cell carcinoma | ||
| Skin | 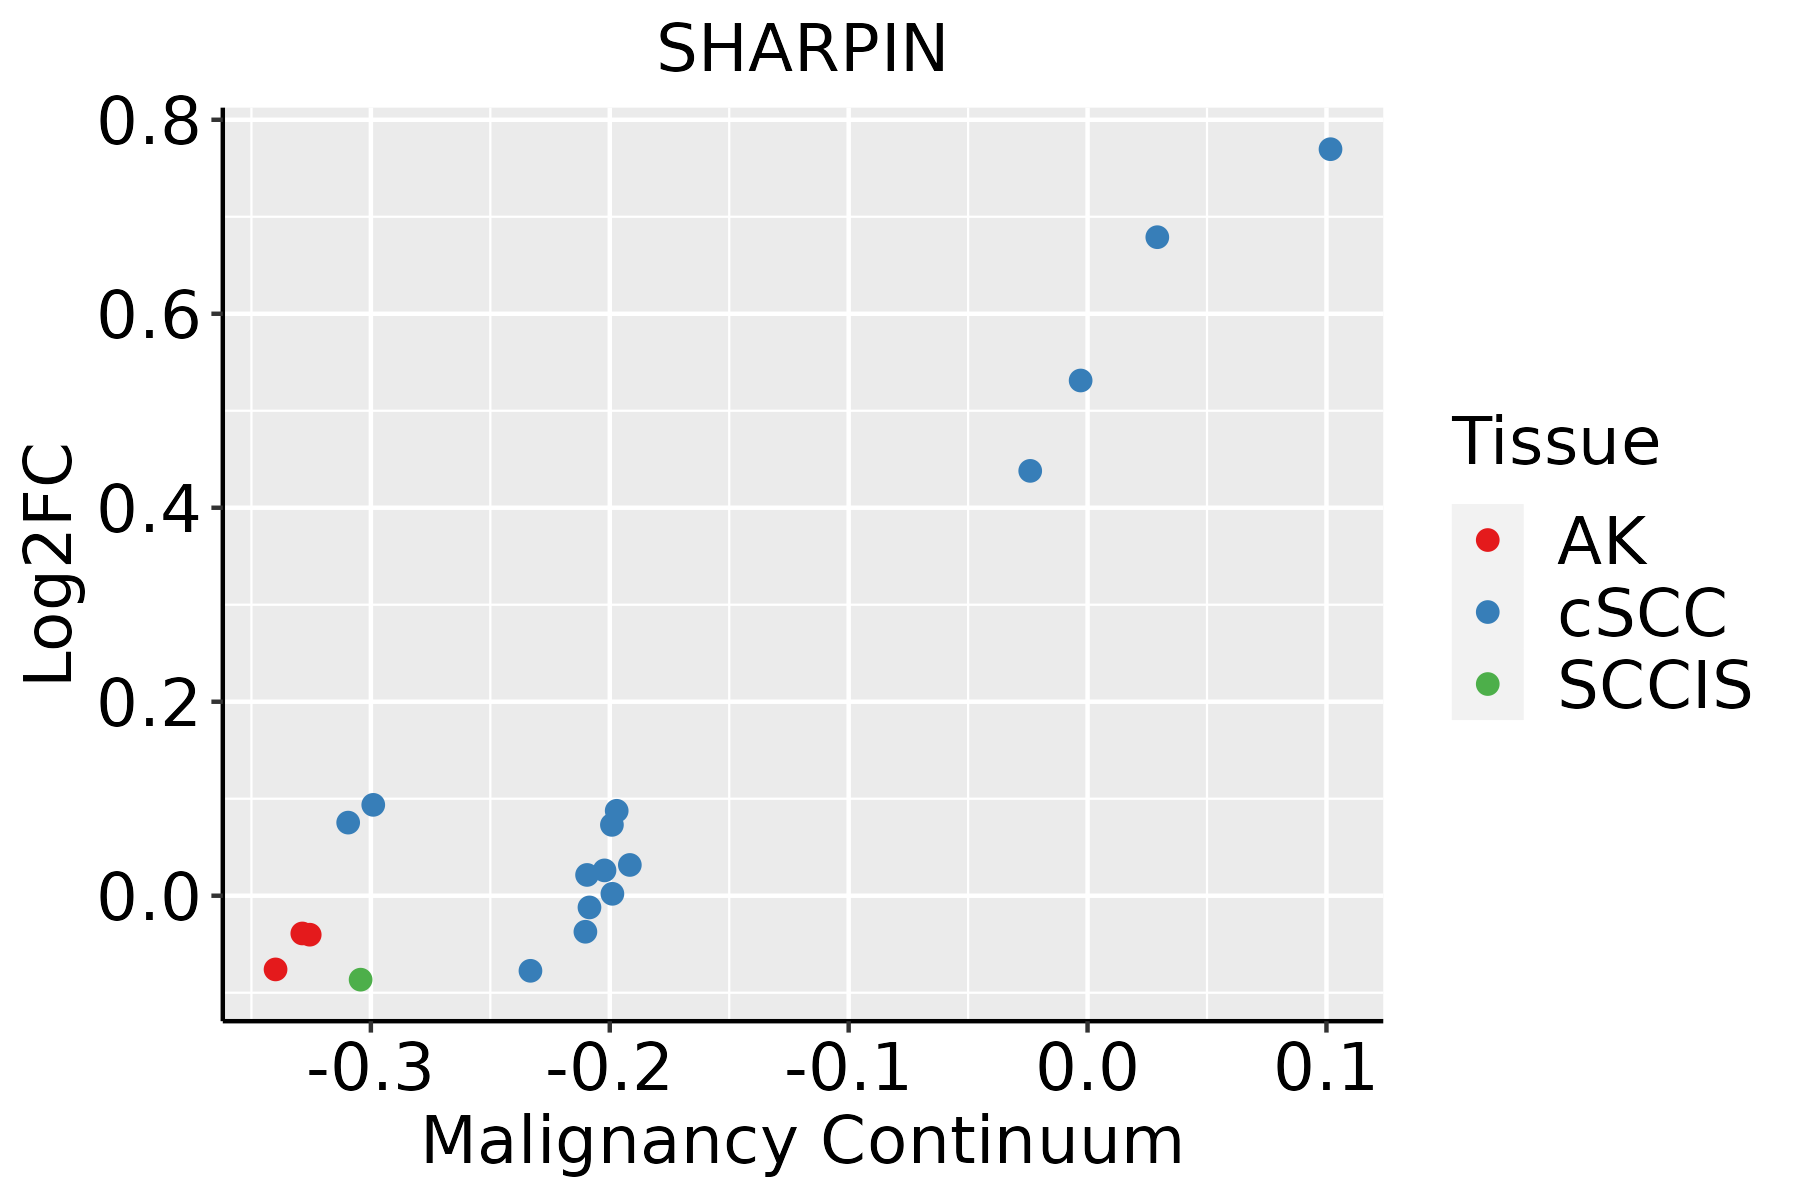 | AK: Actinic keratosis |
| cSCC: Cutaneous squamous cell carcinoma | ||
| SCCIS:squamous cell carcinoma in situ | ||
| Thyroid |  | ATC: Anaplastic thyroid cancer |
| HT: Hashimoto's thyroiditis | ||
| PTC: Papillary thyroid cancer |
| ∗log2FC in expression of this searched gene in stem-like cells from each diseased tissue sample relative to stem-like cells in normal samples in each tissue plotted against the malignancy continuum. Samples are colored based on if they are from different disease stage. |
Top |
Malignant transformation related pathway analysis |
| Find out the enriched GO biological processes and KEGG pathways involved in transition from healthy to precancer to cancer |
| Tissue | Disease Stage | Enriched GO biological Processes |
| Colorectum | AD |  |
| Colorectum | SER |  |
| Colorectum | MSS |  |
| Colorectum | MSI-H |  |
| Colorectum | FAP |  |
| ∗Top 15 enriched GO BP terms are showed in the bar plot of each disease state in each tissue. Each row represents a significant GO biological process which is colored according to the -log10(p.adjust). |
| Page: 1 2 3 4 5 6 7 8 9 |
| GO ID | Tissue | Disease Stage | Description | Gene Ratio | Bg Ratio | pvalue | p.adjust | Count |
| GO:00104989 | Breast | Precancer | proteasomal protein catabolic process | 58/1080 | 490/18723 | 1.54e-07 | 8.05e-06 | 58 |
| GO:0050727 | Breast | Precancer | regulation of inflammatory response | 44/1080 | 386/18723 | 1.26e-05 | 3.22e-04 | 44 |
| GO:00713568 | Breast | Precancer | cellular response to tumor necrosis factor | 28/1080 | 229/18723 | 1.42e-04 | 2.45e-03 | 28 |
| GO:00431619 | Breast | Precancer | proteasome-mediated ubiquitin-dependent protein catabolic process | 42/1080 | 412/18723 | 2.49e-04 | 3.72e-03 | 42 |
| GO:00085445 | Breast | Precancer | epidermis development | 35/1080 | 324/18723 | 2.71e-04 | 3.96e-03 | 35 |
| GO:00224119 | Breast | Precancer | cellular component disassembly | 44/1080 | 443/18723 | 3.17e-04 | 4.51e-03 | 44 |
| GO:00346128 | Breast | Precancer | response to tumor necrosis factor | 29/1080 | 253/18723 | 3.32e-04 | 4.70e-03 | 29 |
| GO:00099136 | Breast | Precancer | epidermal cell differentiation | 23/1080 | 202/18723 | 1.43e-03 | 1.50e-02 | 23 |
| GO:00302163 | Breast | Precancer | keratinocyte differentiation | 17/1080 | 139/18723 | 2.71e-03 | 2.39e-02 | 17 |
| GO:00072496 | Breast | Precancer | I-kappaB kinase/NF-kappaB signaling | 27/1080 | 281/18723 | 6.58e-03 | 4.53e-02 | 27 |
| GO:001049814 | Breast | IDC | proteasomal protein catabolic process | 75/1434 | 490/18723 | 5.59e-09 | 4.41e-07 | 75 |
| GO:004316114 | Breast | IDC | proteasome-mediated ubiquitin-dependent protein catabolic process | 57/1434 | 412/18723 | 9.55e-06 | 2.68e-04 | 57 |
| GO:007135613 | Breast | IDC | cellular response to tumor necrosis factor | 35/1434 | 229/18723 | 6.64e-05 | 1.35e-03 | 35 |
| GO:003461213 | Breast | IDC | response to tumor necrosis factor | 36/1434 | 253/18723 | 2.29e-04 | 3.64e-03 | 36 |
| GO:00507271 | Breast | IDC | regulation of inflammatory response | 48/1434 | 386/18723 | 5.99e-04 | 7.54e-03 | 48 |
| GO:00431227 | Breast | IDC | regulation of I-kappaB kinase/NF-kappaB signaling | 34/1434 | 249/18723 | 7.18e-04 | 8.77e-03 | 34 |
| GO:000724914 | Breast | IDC | I-kappaB kinase/NF-kappaB signaling | 37/1434 | 281/18723 | 8.58e-04 | 9.98e-03 | 37 |
| GO:000854412 | Breast | IDC | epidermis development | 41/1434 | 324/18723 | 1.03e-03 | 1.14e-02 | 41 |
| GO:000991312 | Breast | IDC | epidermal cell differentiation | 28/1434 | 202/18723 | 1.62e-03 | 1.60e-02 | 28 |
| GO:00431236 | Breast | IDC | positive regulation of I-kappaB kinase/NF-kappaB signaling | 26/1434 | 186/18723 | 2.06e-03 | 1.95e-02 | 26 |
| Page: 1 2 3 4 5 6 7 8 |
| Pathway ID | Tissue | Disease Stage | Description | Gene Ratio | Bg Ratio | pvalue | p.adjust | qvalue | Count |
| hsa0513118 | Breast | Precancer | Shigellosis | 44/684 | 247/8465 | 3.91e-07 | 6.86e-06 | 5.26e-06 | 44 |
| hsa0513119 | Breast | Precancer | Shigellosis | 44/684 | 247/8465 | 3.91e-07 | 6.86e-06 | 5.26e-06 | 44 |
| hsa0513124 | Breast | IDC | Shigellosis | 47/867 | 247/8465 | 1.78e-05 | 2.00e-04 | 1.49e-04 | 47 |
| hsa0513134 | Breast | IDC | Shigellosis | 47/867 | 247/8465 | 1.78e-05 | 2.00e-04 | 1.49e-04 | 47 |
| hsa0513144 | Breast | DCIS | Shigellosis | 46/846 | 247/8465 | 2.06e-05 | 2.38e-04 | 1.75e-04 | 46 |
| hsa0513154 | Breast | DCIS | Shigellosis | 46/846 | 247/8465 | 2.06e-05 | 2.38e-04 | 1.75e-04 | 46 |
| hsa0513139 | Esophagus | HGIN | Shigellosis | 71/1383 | 247/8465 | 4.89e-07 | 7.98e-06 | 6.34e-06 | 71 |
| hsa046219 | Esophagus | HGIN | NOD-like receptor signaling pathway | 45/1383 | 186/8465 | 3.40e-03 | 2.54e-02 | 2.02e-02 | 45 |
| hsa05131114 | Esophagus | HGIN | Shigellosis | 71/1383 | 247/8465 | 4.89e-07 | 7.98e-06 | 6.34e-06 | 71 |
| hsa0462114 | Esophagus | HGIN | NOD-like receptor signaling pathway | 45/1383 | 186/8465 | 3.40e-03 | 2.54e-02 | 2.02e-02 | 45 |
| hsa05131211 | Esophagus | ESCC | Shigellosis | 176/4205 | 247/8465 | 2.27e-12 | 4.01e-11 | 2.05e-11 | 176 |
| hsa0462122 | Esophagus | ESCC | NOD-like receptor signaling pathway | 116/4205 | 186/8465 | 2.90e-04 | 1.03e-03 | 5.30e-04 | 116 |
| hsa05131310 | Esophagus | ESCC | Shigellosis | 176/4205 | 247/8465 | 2.27e-12 | 4.01e-11 | 2.05e-11 | 176 |
| hsa0462132 | Esophagus | ESCC | NOD-like receptor signaling pathway | 116/4205 | 186/8465 | 2.90e-04 | 1.03e-03 | 5.30e-04 | 116 |
| hsa0513122 | Liver | Cirrhotic | Shigellosis | 105/2530 | 247/8465 | 1.31e-05 | 1.21e-04 | 7.48e-05 | 105 |
| hsa0513132 | Liver | Cirrhotic | Shigellosis | 105/2530 | 247/8465 | 1.31e-05 | 1.21e-04 | 7.48e-05 | 105 |
| hsa0513142 | Liver | HCC | Shigellosis | 150/4020 | 247/8465 | 1.53e-05 | 1.04e-04 | 5.81e-05 | 150 |
| hsa0513152 | Liver | HCC | Shigellosis | 150/4020 | 247/8465 | 1.53e-05 | 1.04e-04 | 5.81e-05 | 150 |
| hsa0513130 | Oral cavity | OSCC | Shigellosis | 150/3704 | 247/8465 | 3.96e-08 | 3.12e-07 | 1.59e-07 | 150 |
| hsa046218 | Oral cavity | OSCC | NOD-like receptor signaling pathway | 108/3704 | 186/8465 | 5.13e-05 | 2.07e-04 | 1.05e-04 | 108 |
| Page: 1 2 |
Top |
Cell-cell communication analysis |
| Identification of potential cell-cell interactions between two cell types and their ligand-receptor pairs for different disease states |
| Ligand | Receptor | LRpair | Pathway | Tissue | Disease Stage |
| Page: 1 |
Top |
Single-cell gene regulatory network inference analysis |
| Find out the significant the regulons (TFs) and the target genes of each regulon across cell types for different disease states |
| TF | Cell Type | Tissue | Disease Stage | Target Gene | RSS | Regulon Activity |
| ∗The dot plots of a searched regulon are shown for all cell subpopulations in each disease state of each tissue based on the regulon specific score inferred using pySCENIC and by calculating the average expression. |
| Page: 1 |
Top |
Somatic mutation of malignant transformation related genes |
| Annotation of somatic variants for genes involved in malignant transformation |
| Hugo Symbol | Variant Class | Variant Classification | dbSNP RS | HGVSc | HGVSp | HGVSp Short | SWISSPROT | BIOTYPE | SIFT | PolyPhen | Tumor Sample Barcode | Tissue | Histology | Sex | Age | Stage | Therapy Types | Drugs | Outcome |
| SHARPIN | SNV | Missense_Mutation | novel | c.657C>G | p.Ile219Met | p.I219M | Q9H0F6 | protein_coding | deleterious(0) | possibly_damaging(0.641) | TCGA-3C-AALI-01 | Breast | breast invasive carcinoma | Female | <65 | I/II | Unspecific | Poly E | Complete Response |
| SHARPIN | SNV | Missense_Mutation | novel | c.384G>C | p.Lys128Asn | p.K128N | Q9H0F6 | protein_coding | tolerated(0.58) | benign(0) | TCGA-A2-A0CR-01 | Breast | breast invasive carcinoma | Female | <65 | I/II | Chemotherapy | adriamycin | CR |
| SHARPIN | deletion | Frame_Shift_Del | novel | c.576_601delNNNNNNNNNNNNNNNNNNNNNNNNNN | p.Gln193SerfsTer25 | p.Q193Sfs*25 | Q9H0F6 | protein_coding | TCGA-A7-A4SE-01 | Breast | breast invasive carcinoma | Female | <65 | I/II | Chemotherapy | adriamycin | CR | ||
| SHARPIN | deletion | Frame_Shift_Del | novel | c.1153delN | p.Ala385LeufsTer27 | p.A385Lfs*27 | Q9H0F6 | protein_coding | TCGA-D8-A27V-01 | Breast | breast invasive carcinoma | Female | <65 | I/II | Hormone Therapy | tamoxiphen | SD | ||
| SHARPIN | deletion | Frame_Shift_Del | novel | c.669delN | p.Thr224HisfsTer188 | p.T224Hfs*188 | Q9H0F6 | protein_coding | TCGA-D8-A27V-01 | Breast | breast invasive carcinoma | Female | <65 | I/II | Hormone Therapy | tamoxiphen | SD | ||
| SHARPIN | SNV | Missense_Mutation | c.1061N>A | p.Cys354Tyr | p.C354Y | Q9H0F6 | protein_coding | deleterious(0) | probably_damaging(0.999) | TCGA-IR-A3LL-01 | Cervix | cervical & endocervical cancer | Female | <65 | I/II | Chemotherapy | cisplatin | CR | |
| SHARPIN | SNV | Missense_Mutation | c.248G>A | p.Gly83Asp | p.G83D | Q9H0F6 | protein_coding | deleterious(0.02) | possibly_damaging(0.819) | TCGA-Q1-A73O-01 | Cervix | cervical & endocervical cancer | Female | <65 | I/II | Chemotherapy | cisplatin | CR | |
| SHARPIN | SNV | Missense_Mutation | novel | c.283N>T | p.Gly95Trp | p.G95W | Q9H0F6 | protein_coding | deleterious(0.01) | probably_damaging(1) | TCGA-AD-A5EJ-01 | Colorectum | colon adenocarcinoma | Female | >=65 | I/II | Unknown | Unknown | SD |
| SHARPIN | SNV | Missense_Mutation | rs776988893 | c.604C>T | p.Arg202Cys | p.R202C | Q9H0F6 | protein_coding | deleterious(0) | benign(0.424) | TCGA-G4-6628-01 | Colorectum | colon adenocarcinoma | Male | >=65 | I/II | Unknown | Unknown | SD |
| SHARPIN | deletion | Frame_Shift_Del | c.986delN | p.Pro329HisfsTer83 | p.P329Hfs*83 | Q9H0F6 | protein_coding | TCGA-WS-AB45-01 | Colorectum | colon adenocarcinoma | Female | <65 | I/II | Unknown | Unknown | SD |
| Page: 1 2 3 |
Top |
Related drugs of malignant transformation related genes |
| Identification of chemicals and drugs interact with genes involved in malignant transfromation |
| (DGIdb 4.0) |
| Entrez ID | Symbol | Category | Interaction Types | Drug Claim Name | Drug Name | PMIDs |
| Page: 1 |

Copyright 2023-Present -The University of Texas Health Science Center at Houston |