
|
|||||
|
 | |
| |
| |
| |
| |
| |
|
Gene: SHANK2 |
Gene summary for SHANK2 |
| Gene information | Species | Human | Gene symbol | SHANK2 | Gene ID | 22941 |
| Gene name | SH3 and multiple ankyrin repeat domains 2 | |
| Gene Alias | AUTS17 | |
| Cytomap | 11q13.3-q13.4 | |
| Gene Type | protein-coding | GO ID | GO:0003008 | UniProtAcc | Q9UPX8 |
Top |
Malignant transformation analysis |
| Identification of the aberrant gene expression in precancerous and cancerous lesions by comparing the gene expression of stem-like cells in diseased tissues with normal stem cells |
| Entrez ID | Symbol | Replicates | Species | Organ | Tissue | Adj P-value | Log2FC | Malignancy |
| 22941 | SHANK2 | HTA11_6818_2000001011 | Human | Colorectum | AD | 4.37e-02 | 4.85e-01 | 0.0112 |
| 22941 | SHANK2 | HTA11_6818_2000001021 | Human | Colorectum | AD | 9.18e-04 | 6.04e-01 | 0.0588 |
| 22941 | SHANK2 | HTA11_99999970781_79442 | Human | Colorectum | MSS | 7.51e-16 | -5.09e-01 | 0.294 |
| 22941 | SHANK2 | A001-C-207 | Human | Colorectum | FAP | 1.80e-03 | -1.39e-01 | 0.1278 |
| 22941 | SHANK2 | A015-C-203 | Human | Colorectum | FAP | 1.96e-33 | -3.84e-01 | -0.1294 |
| 22941 | SHANK2 | A015-C-204 | Human | Colorectum | FAP | 7.67e-05 | -2.47e-01 | -0.0228 |
| 22941 | SHANK2 | A014-C-040 | Human | Colorectum | FAP | 3.61e-04 | -9.17e-02 | -0.1184 |
| 22941 | SHANK2 | A002-C-201 | Human | Colorectum | FAP | 1.47e-12 | -1.98e-01 | 0.0324 |
| 22941 | SHANK2 | A002-C-203 | Human | Colorectum | FAP | 1.11e-04 | 1.54e-02 | 0.2786 |
| 22941 | SHANK2 | A001-C-119 | Human | Colorectum | FAP | 3.98e-09 | -3.80e-01 | -0.1557 |
| 22941 | SHANK2 | A001-C-108 | Human | Colorectum | FAP | 3.73e-21 | -1.84e-01 | -0.0272 |
| 22941 | SHANK2 | A002-C-205 | Human | Colorectum | FAP | 3.09e-24 | -2.56e-01 | -0.1236 |
| 22941 | SHANK2 | A001-C-104 | Human | Colorectum | FAP | 2.67e-04 | -6.23e-02 | 0.0184 |
| 22941 | SHANK2 | A015-C-006 | Human | Colorectum | FAP | 4.96e-19 | -2.73e-01 | -0.0994 |
| 22941 | SHANK2 | A015-C-106 | Human | Colorectum | FAP | 3.20e-14 | -1.81e-01 | -0.0511 |
| 22941 | SHANK2 | A002-C-114 | Human | Colorectum | FAP | 2.32e-22 | -3.80e-01 | -0.1561 |
| 22941 | SHANK2 | A015-C-104 | Human | Colorectum | FAP | 9.30e-40 | -5.12e-01 | -0.1899 |
| 22941 | SHANK2 | A001-C-014 | Human | Colorectum | FAP | 8.13e-21 | -3.26e-01 | 0.0135 |
| 22941 | SHANK2 | A002-C-016 | Human | Colorectum | FAP | 1.37e-26 | -3.79e-01 | 0.0521 |
| 22941 | SHANK2 | A015-C-002 | Human | Colorectum | FAP | 3.76e-14 | -3.86e-01 | -0.0763 |
| Page: 1 2 3 4 5 6 7 |
| Tissue | Expression Dynamics | Abbreviation |
| Colorectum (GSE201348) |  | FAP: Familial adenomatous polyposis |
| CRC: Colorectal cancer | ||
| Colorectum (HTA11) |  | AD: Adenomas |
| SER: Sessile serrated lesions | ||
| MSI-H: Microsatellite-high colorectal cancer | ||
| MSS: Microsatellite stable colorectal cancer | ||
| Endometrium | 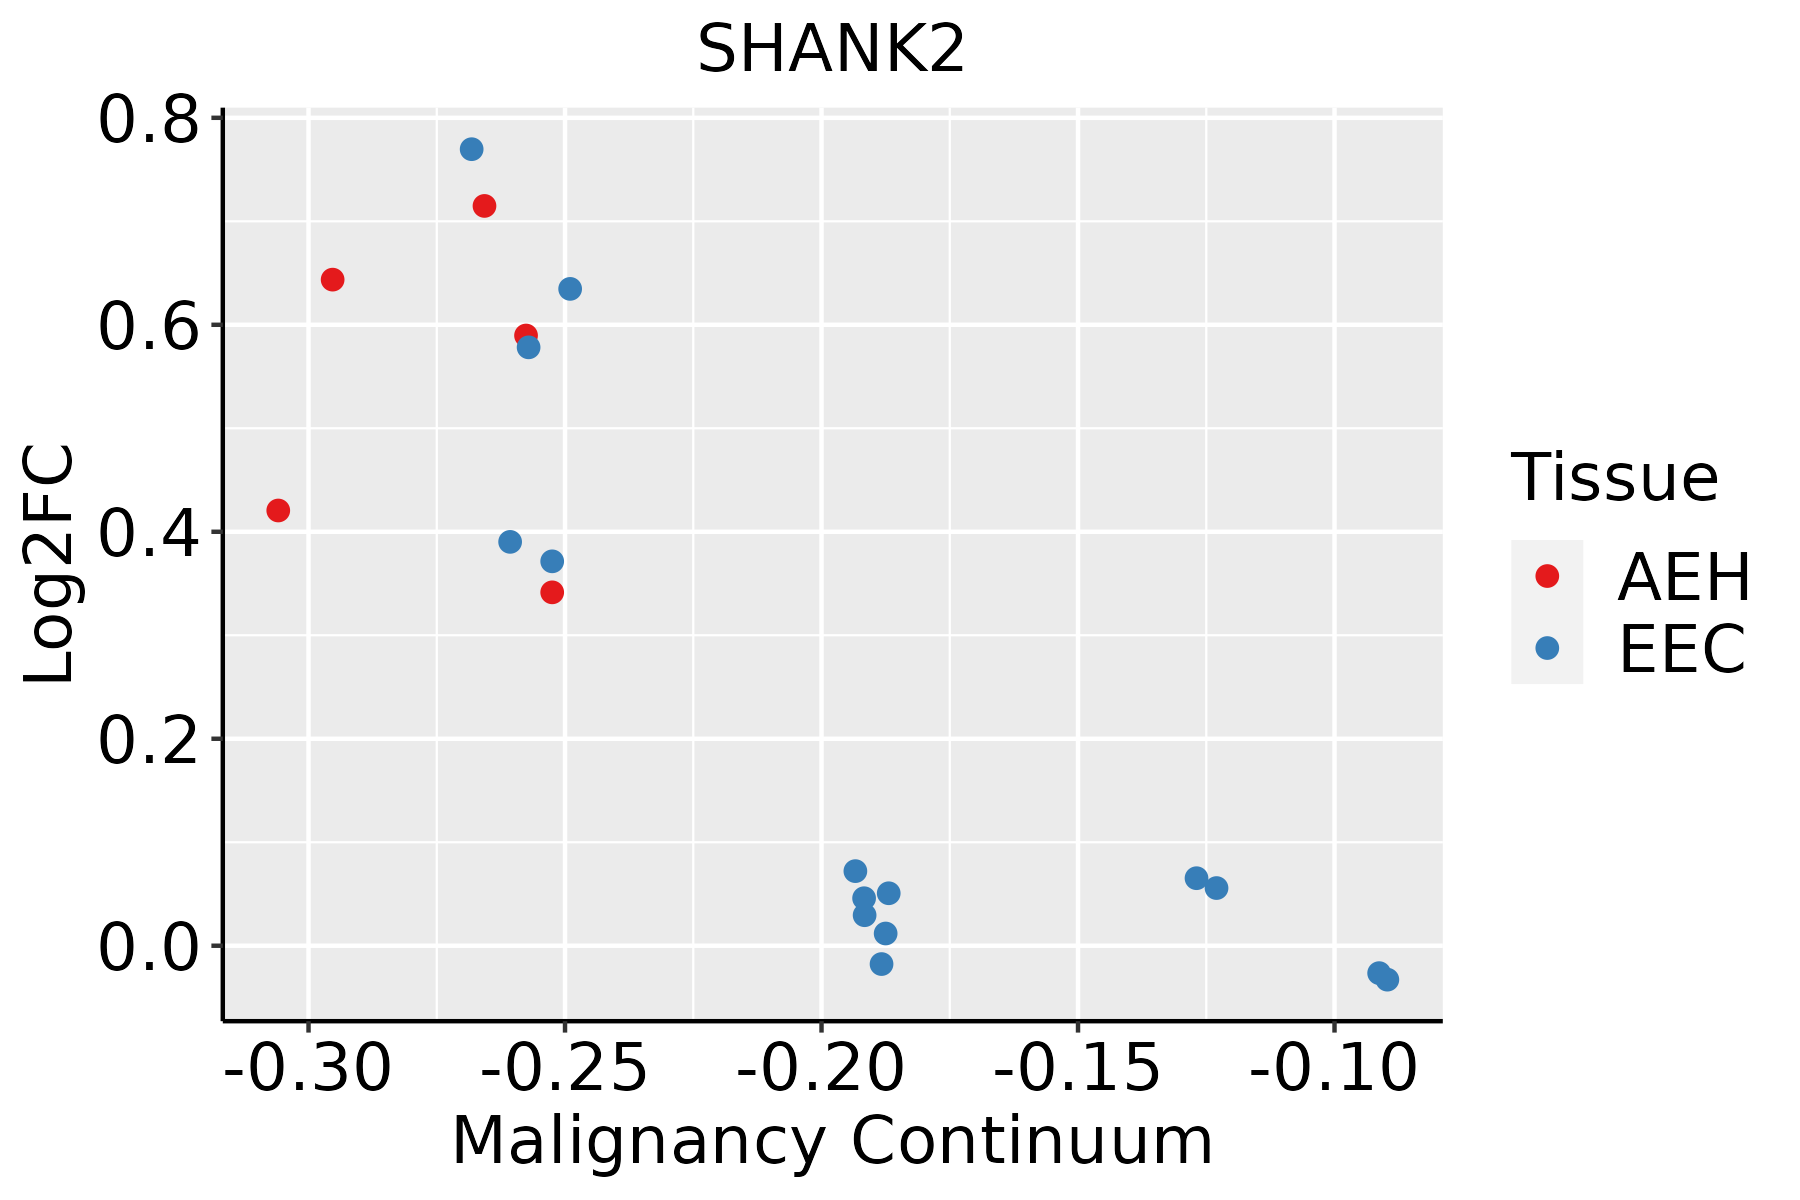 | AEH: Atypical endometrial hyperplasia |
| EEC: Endometrioid Cancer | ||
| Esophagus | 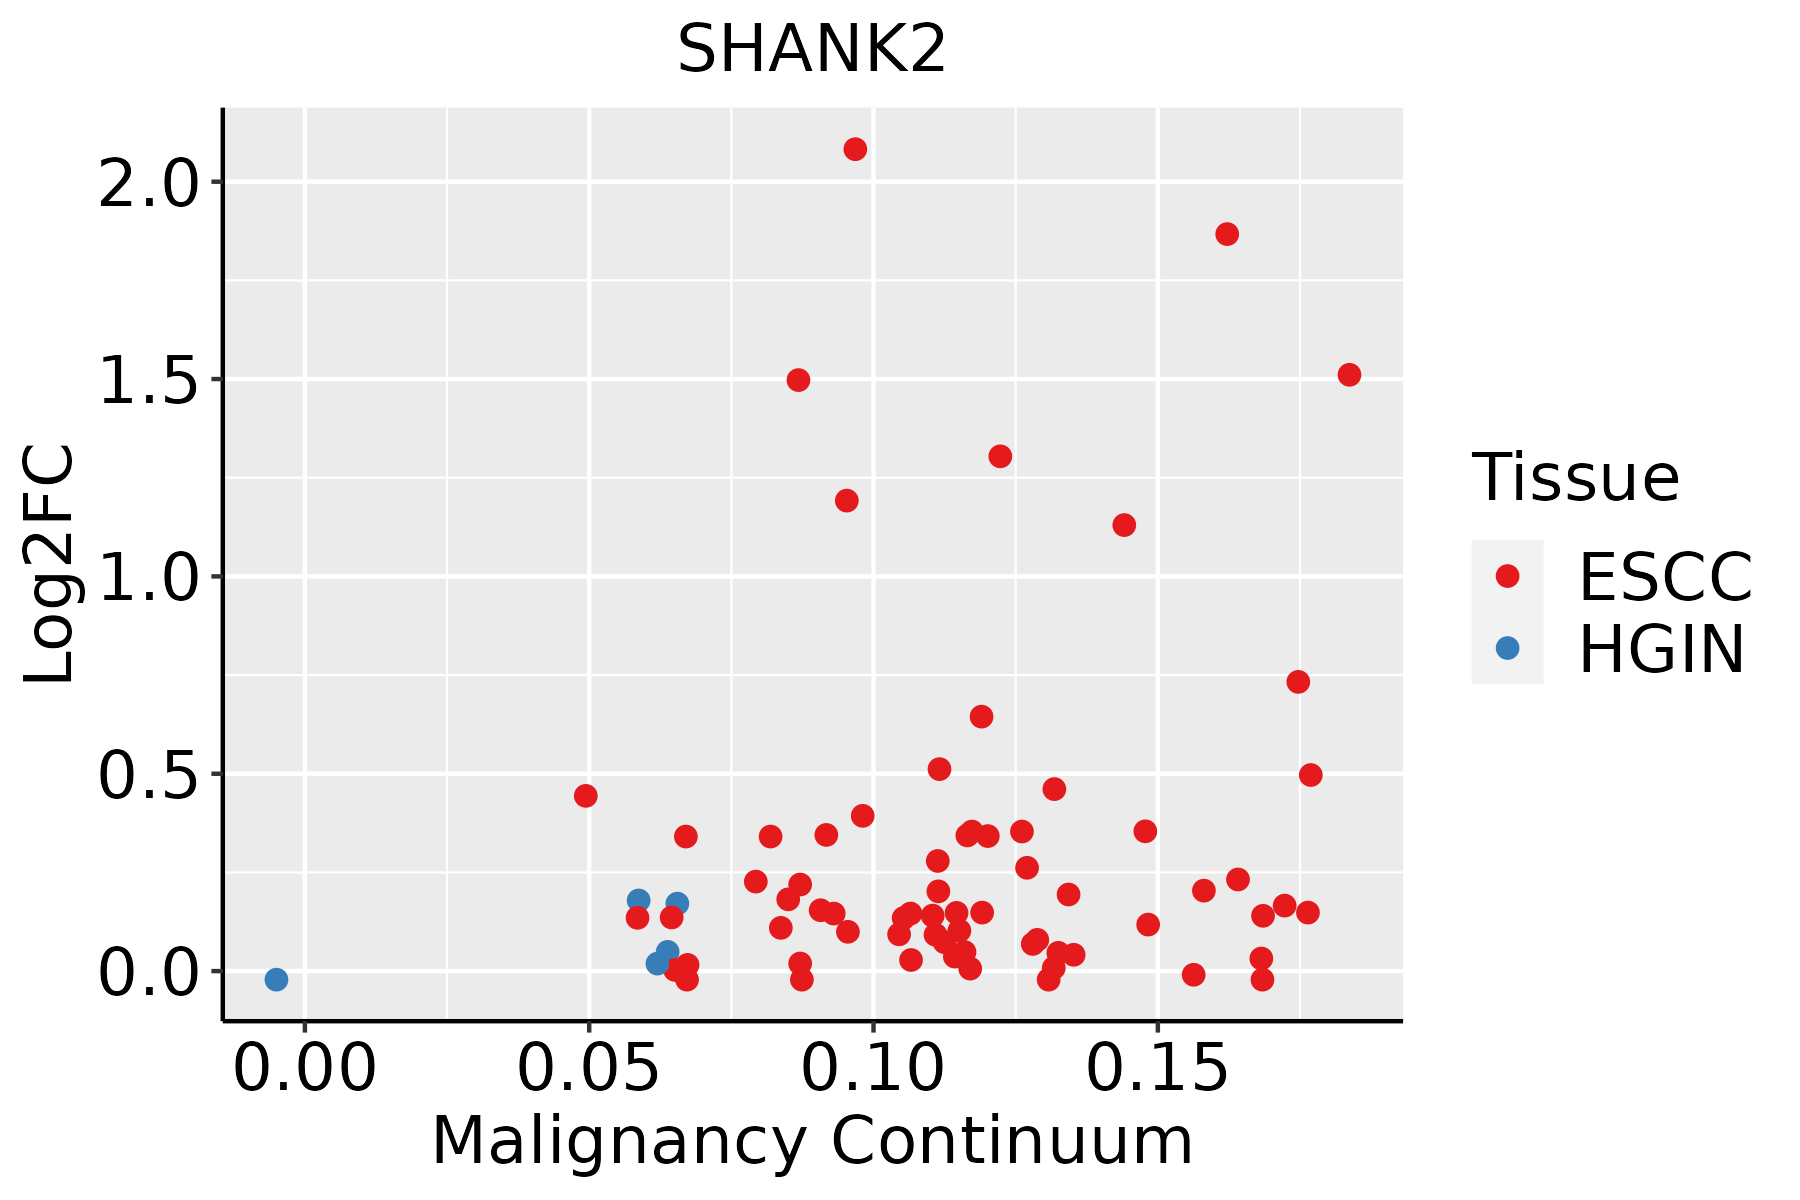 | ESCC: Esophageal squamous cell carcinoma |
| HGIN: High-grade intraepithelial neoplasias | ||
| LGIN: Low-grade intraepithelial neoplasias | ||
| Liver |  | HCC: Hepatocellular carcinoma |
| NAFLD: Non-alcoholic fatty liver disease | ||
| Lung | 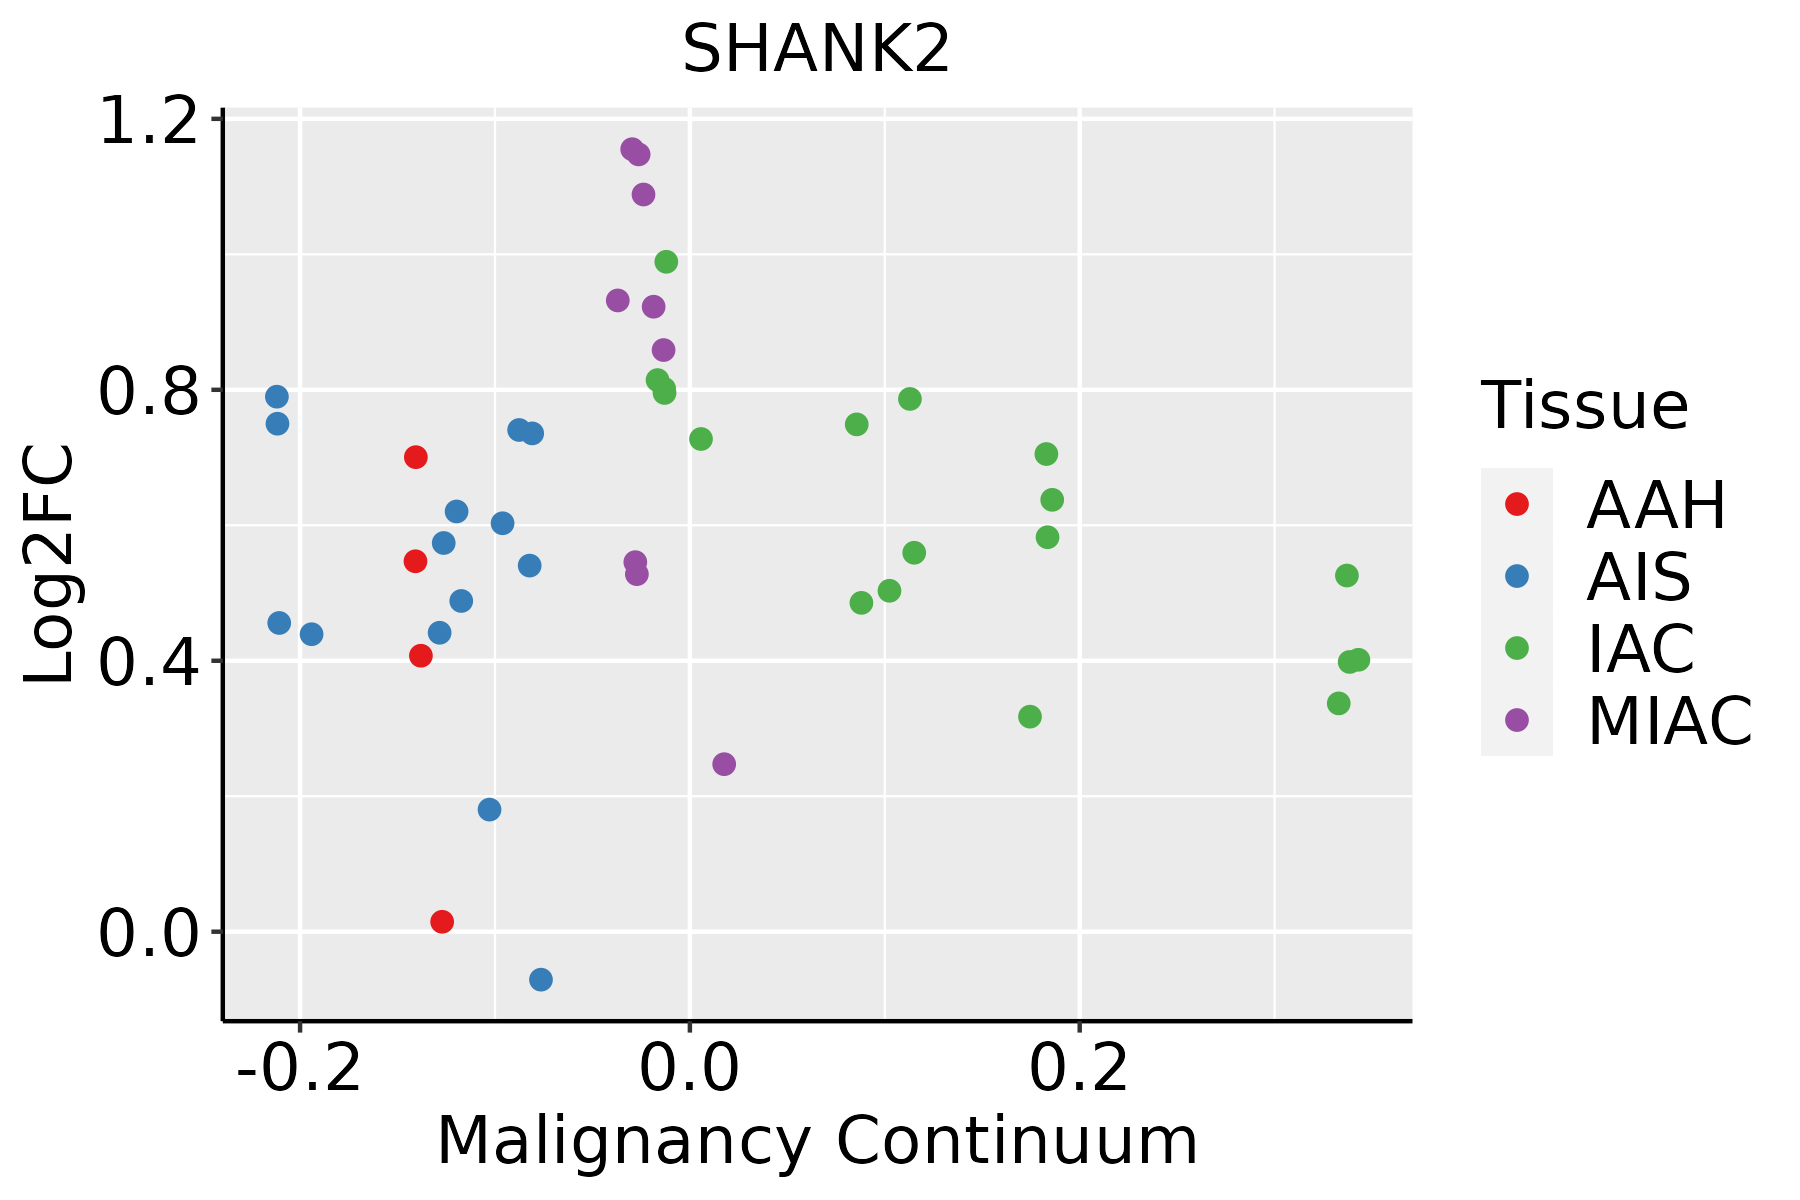 | AAH: Atypical adenomatous hyperplasia |
| AIS: Adenocarcinoma in situ | ||
| IAC: Invasive lung adenocarcinoma | ||
| MIA: Minimally invasive adenocarcinoma |
| ∗log2FC in expression of this searched gene in stem-like cells from each diseased tissue sample relative to stem-like cells in normal samples in each tissue plotted against the malignancy continuum. Samples are colored based on if they are from different disease stage. |
Top |
Malignant transformation related pathway analysis |
| Find out the enriched GO biological processes and KEGG pathways involved in transition from healthy to precancer to cancer |
| Tissue | Disease Stage | Enriched GO biological Processes |
| Colorectum | AD |  |
| Colorectum | SER |  |
| Colorectum | MSS |  |
| Colorectum | MSI-H |  |
| Colorectum | FAP |  |
| ∗Top 15 enriched GO BP terms are showed in the bar plot of each disease state in each tissue. Each row represents a significant GO biological process which is colored according to the -log10(p.adjust). |
| Page: 1 2 3 4 5 6 7 8 9 |
| GO ID | Tissue | Disease Stage | Description | Gene Ratio | Bg Ratio | pvalue | p.adjust | Count |
| GO:0034329 | Colorectum | AD | cell junction assembly | 136/3918 | 420/18723 | 2.02e-08 | 1.15e-06 | 136 |
| GO:0050808 | Colorectum | AD | synapse organization | 112/3918 | 426/18723 | 4.25e-03 | 2.92e-02 | 112 |
| GO:00343292 | Colorectum | MSS | cell junction assembly | 120/3467 | 420/18723 | 2.51e-07 | 1.07e-05 | 120 |
| GO:00508082 | Colorectum | MSS | synapse organization | 101/3467 | 426/18723 | 3.96e-03 | 2.89e-02 | 101 |
| GO:00343293 | Colorectum | FAP | cell junction assembly | 105/2622 | 420/18723 | 1.03e-09 | 2.18e-07 | 105 |
| GO:00508083 | Colorectum | FAP | synapse organization | 91/2622 | 426/18723 | 1.90e-05 | 4.74e-04 | 91 |
| GO:00343294 | Colorectum | CRC | cell junction assembly | 83/2078 | 420/18723 | 1.08e-07 | 1.29e-05 | 83 |
| GO:00508084 | Colorectum | CRC | synapse organization | 71/2078 | 426/18723 | 3.02e-04 | 4.76e-03 | 71 |
| GO:0050804 | Colorectum | CRC | modulation of chemical synaptic transmission | 70/2078 | 439/18723 | 1.15e-03 | 1.33e-02 | 70 |
| GO:0099177 | Colorectum | CRC | regulation of trans-synaptic signaling | 70/2078 | 440/18723 | 1.23e-03 | 1.38e-02 | 70 |
| GO:00343299 | Endometrium | AEH | cell junction assembly | 78/2100 | 420/18723 | 4.80e-06 | 1.24e-04 | 78 |
| GO:00508086 | Endometrium | AEH | synapse organization | 67/2100 | 426/18723 | 2.67e-03 | 1.94e-02 | 67 |
| GO:003432914 | Endometrium | EEC | cell junction assembly | 79/2168 | 420/18723 | 8.37e-06 | 1.85e-04 | 79 |
| GO:005080812 | Endometrium | EEC | synapse organization | 68/2168 | 426/18723 | 3.73e-03 | 2.49e-02 | 68 |
| GO:003432918 | Esophagus | ESCC | cell junction assembly | 227/8552 | 420/18723 | 3.06e-04 | 1.83e-03 | 227 |
| GO:00353297 | Esophagus | ESCC | hippo signaling | 26/8552 | 40/18723 | 1.08e-02 | 3.66e-02 | 26 |
| GO:00343296 | Liver | NAFLD | cell junction assembly | 66/1882 | 420/18723 | 1.64e-04 | 3.00e-03 | 66 |
| GO:0035329 | Liver | NAFLD | hippo signaling | 10/1882 | 40/18723 | 5.20e-03 | 4.05e-02 | 10 |
| GO:0035331 | Liver | NAFLD | negative regulation of hippo signaling | 5/1882 | 13/18723 | 6.58e-03 | 4.69e-02 | 5 |
| GO:00353311 | Liver | Cirrhotic | negative regulation of hippo signaling | 8/4634 | 13/18723 | 5.27e-03 | 2.70e-02 | 8 |
| Page: 1 2 |
| Pathway ID | Tissue | Disease Stage | Description | Gene Ratio | Bg Ratio | pvalue | p.adjust | qvalue | Count |
| hsa04724 | Colorectum | CRC | Glutamatergic synapse | 24/1091 | 115/8465 | 1.07e-02 | 4.74e-02 | 3.21e-02 | 24 |
| hsa047241 | Colorectum | CRC | Glutamatergic synapse | 24/1091 | 115/8465 | 1.07e-02 | 4.74e-02 | 3.21e-02 | 24 |
| Page: 1 |
Top |
Cell-cell communication analysis |
| Identification of potential cell-cell interactions between two cell types and their ligand-receptor pairs for different disease states |
| Ligand | Receptor | LRpair | Pathway | Tissue | Disease Stage |
| Page: 1 |
Top |
Single-cell gene regulatory network inference analysis |
| Find out the significant the regulons (TFs) and the target genes of each regulon across cell types for different disease states |
| TF | Cell Type | Tissue | Disease Stage | Target Gene | RSS | Regulon Activity |
| ∗The dot plots of a searched regulon are shown for all cell subpopulations in each disease state of each tissue based on the regulon specific score inferred using pySCENIC and by calculating the average expression. |
| Page: 1 |
Top |
Somatic mutation of malignant transformation related genes |
| Annotation of somatic variants for genes involved in malignant transformation |
| Hugo Symbol | Variant Class | Variant Classification | dbSNP RS | HGVSc | HGVSp | HGVSp Short | SWISSPROT | BIOTYPE | SIFT | PolyPhen | Tumor Sample Barcode | Tissue | Histology | Sex | Age | Stage | Therapy Types | Drugs | Outcome |
| SHANK2 | SNV | Missense_Mutation | rs544418717 | c.2800N>A | p.Glu934Lys | p.E934K | protein_coding | deleterious(0.01) | probably_damaging(0.922) | TCGA-A8-A08L-01 | Breast | breast invasive carcinoma | Female | >=65 | III/IV | Unknown | Unknown | SD | |
| SHANK2 | SNV | Missense_Mutation | c.3782G>A | p.Arg1261Lys | p.R1261K | protein_coding | deleterious(0) | probably_damaging(0.995) | TCGA-AC-A23H-01 | Breast | breast invasive carcinoma | Female | >=65 | I/II | Unknown | Unknown | PD | ||
| SHANK2 | SNV | Missense_Mutation | c.139G>A | p.Glu47Lys | p.E47K | protein_coding | deleterious(0) | benign(0.19) | TCGA-AC-A23H-01 | Breast | breast invasive carcinoma | Female | >=65 | I/II | Unknown | Unknown | PD | ||
| SHANK2 | SNV | Missense_Mutation | c.111C>G | p.Ile37Met | p.I37M | Q9UPX8 | protein_coding | tolerated(0.1) | possibly_damaging(0.901) | TCGA-AC-A23H-01 | Breast | breast invasive carcinoma | Female | >=65 | I/II | Unknown | Unknown | PD | |
| SHANK2 | SNV | Missense_Mutation | novel | c.267N>A | p.Glu90Lys | p.E90K | protein_coding | deleterious(0.01) | possibly_damaging(0.829) | TCGA-AN-A046-01 | Breast | breast invasive carcinoma | Female | >=65 | I/II | Unknown | Unknown | SD | |
| SHANK2 | SNV | Missense_Mutation | rs534324507 | c.501N>T | p.Glu167Asp | p.E167D | protein_coding | deleterious(0) | probably_damaging(0.997) | TCGA-AN-A0XR-01 | Breast | breast invasive carcinoma | Female | <65 | III/IV | Unknown | Unknown | SD | |
| SHANK2 | SNV | Missense_Mutation | novel | c.1723N>G | p.Phe575Val | p.F575V | Q9UPX8 | protein_coding | deleterious(0) | possibly_damaging(0.795) | TCGA-AR-A1AP-01 | Breast | breast invasive carcinoma | Female | >=65 | I/II | Hormone Therapy | anastrozole | SD |
| SHANK2 | SNV | Missense_Mutation | novel | c.1723N>G | p.Phe575Val | p.F575V | Q9UPX8 | protein_coding | deleterious(0) | possibly_damaging(0.795) | TCGA-B6-A0I8-01 | Breast | breast invasive carcinoma | Female | <65 | I/II | Unknown | Unknown | PD |
| SHANK2 | SNV | Missense_Mutation | rs568385491 | c.22N>A | p.Arg8His | p.R8H | protein_coding | deleterious_low_confidence(0) | probably_damaging(0.999) | TCGA-B6-A0WY-01 | Breast | breast invasive carcinoma | Female | <65 | III/IV | Unknown | Unknown | PD | |
| SHANK2 | SNV | Missense_Mutation | rs201263152 | c.439N>A | p.Gln147Lys | p.Q147K | Q9UPX8 | protein_coding | deleterious(0) | benign(0.103) | TCGA-B6-A1KN-01 | Breast | breast invasive carcinoma | Female | <65 | III/IV | Unknown | Unknown | SD |
| Page: 1 2 3 4 5 6 7 8 9 10 11 12 13 14 15 16 17 18 19 20 21 22 23 24 25 |
Top |
Related drugs of malignant transformation related genes |
| Identification of chemicals and drugs interact with genes involved in malignant transfromation |
| (DGIdb 4.0) |
| Entrez ID | Symbol | Category | Interaction Types | Drug Claim Name | Drug Name | PMIDs |
| Page: 1 |

Copyright 2023-Present -The University of Texas Health Science Center at Houston |