
|
|||||
|
 | |
| |
| |
| |
| |
| |
|
Gene: SH3RF2 |
Gene summary for SH3RF2 |
| Gene information | Species | Human | Gene symbol | SH3RF2 | Gene ID | 153769 |
| Gene name | SH3 domain containing ring finger 2 | |
| Gene Alias | HEPP1 | |
| Cytomap | 5q32 | |
| Gene Type | protein-coding | GO ID | GO:0000165 | UniProtAcc | Q08AM8 |
Top |
Malignant transformation analysis |
| Identification of the aberrant gene expression in precancerous and cancerous lesions by comparing the gene expression of stem-like cells in diseased tissues with normal stem cells |
| Entrez ID | Symbol | Replicates | Species | Organ | Tissue | Adj P-value | Log2FC | Malignancy |
| 153769 | SH3RF2 | CCI_2 | Human | Cervix | CC | 2.19e-06 | 7.06e-01 | 0.5249 |
| 153769 | SH3RF2 | CCI_3 | Human | Cervix | CC | 5.78e-14 | 8.56e-01 | 0.516 |
| 153769 | SH3RF2 | HTA11_3410_2000001011 | Human | Colorectum | AD | 7.43e-28 | -6.73e-01 | 0.0155 |
| 153769 | SH3RF2 | HTA11_2951_2000001011 | Human | Colorectum | AD | 2.54e-02 | -7.11e-01 | 0.0216 |
| 153769 | SH3RF2 | HTA11_347_2000001011 | Human | Colorectum | AD | 2.31e-11 | 6.13e-01 | -0.1954 |
| 153769 | SH3RF2 | HTA11_2112_2000001011 | Human | Colorectum | SER | 4.32e-02 | -6.82e-01 | -0.2196 |
| 153769 | SH3RF2 | HTA11_3361_2000001011 | Human | Colorectum | AD | 4.55e-09 | -6.54e-01 | -0.1207 |
| 153769 | SH3RF2 | HTA11_866_3004761011 | Human | Colorectum | AD | 5.11e-15 | -6.56e-01 | 0.096 |
| 153769 | SH3RF2 | HTA11_9408_2000001011 | Human | Colorectum | AD | 7.92e-03 | -6.47e-01 | 0.0451 |
| 153769 | SH3RF2 | HTA11_8622_2000001021 | Human | Colorectum | SER | 5.02e-04 | -6.09e-01 | 0.0528 |
| 153769 | SH3RF2 | HTA11_10711_2000001011 | Human | Colorectum | AD | 9.32e-03 | -4.90e-01 | 0.0338 |
| 153769 | SH3RF2 | HTA11_7696_3000711011 | Human | Colorectum | AD | 2.75e-07 | -4.92e-01 | 0.0674 |
| 153769 | SH3RF2 | HTA11_6818_2000001011 | Human | Colorectum | AD | 4.45e-06 | -5.01e-01 | 0.0112 |
| 153769 | SH3RF2 | HTA11_11156_2000001011 | Human | Colorectum | AD | 4.95e-04 | -9.90e-01 | 0.0397 |
| 153769 | SH3RF2 | HTA11_6818_2000001021 | Human | Colorectum | AD | 3.46e-03 | -4.80e-01 | 0.0588 |
| 153769 | SH3RF2 | HTA11_99999970781_79442 | Human | Colorectum | MSS | 3.17e-31 | -7.30e-01 | 0.294 |
| 153769 | SH3RF2 | HTA11_99999971662_82457 | Human | Colorectum | MSS | 5.54e-28 | -7.37e-01 | 0.3859 |
| 153769 | SH3RF2 | HTA11_99999973899_84307 | Human | Colorectum | MSS | 1.81e-05 | -5.82e-01 | 0.2585 |
| 153769 | SH3RF2 | HTA11_99999974143_84620 | Human | Colorectum | MSS | 3.68e-64 | -1.13e+00 | 0.3005 |
| 153769 | SH3RF2 | F007 | Human | Colorectum | FAP | 1.22e-12 | -7.49e-01 | 0.1176 |
| Page: 1 2 3 4 5 6 7 |
| Tissue | Expression Dynamics | Abbreviation |
| Cervix | 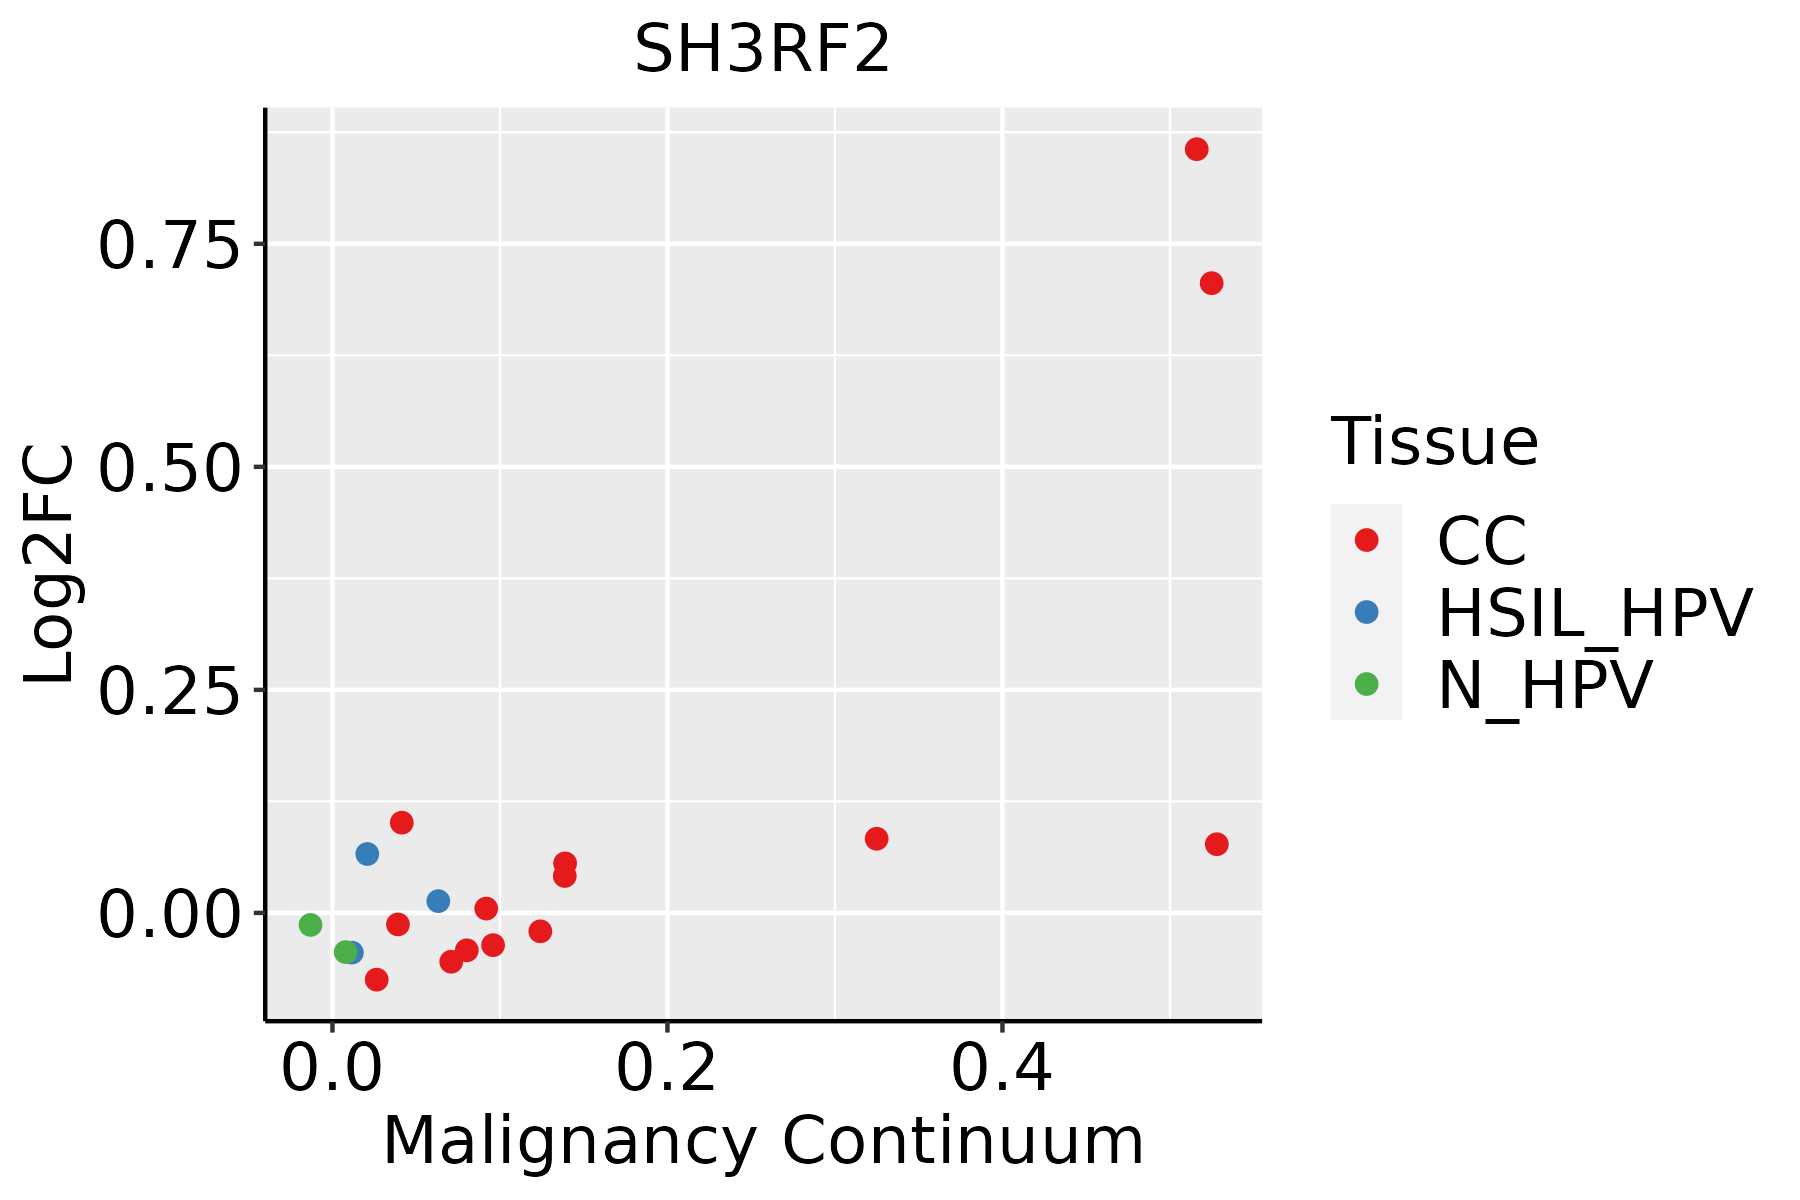 | CC: Cervix cancer |
| HSIL_HPV: HPV-infected high-grade squamous intraepithelial lesions | ||
| N_HPV: HPV-infected normal cervix | ||
| Colorectum (GSE201348) |  | FAP: Familial adenomatous polyposis |
| CRC: Colorectal cancer | ||
| Colorectum (HTA11) |  | AD: Adenomas |
| SER: Sessile serrated lesions | ||
| MSI-H: Microsatellite-high colorectal cancer | ||
| MSS: Microsatellite stable colorectal cancer | ||
| Esophagus | 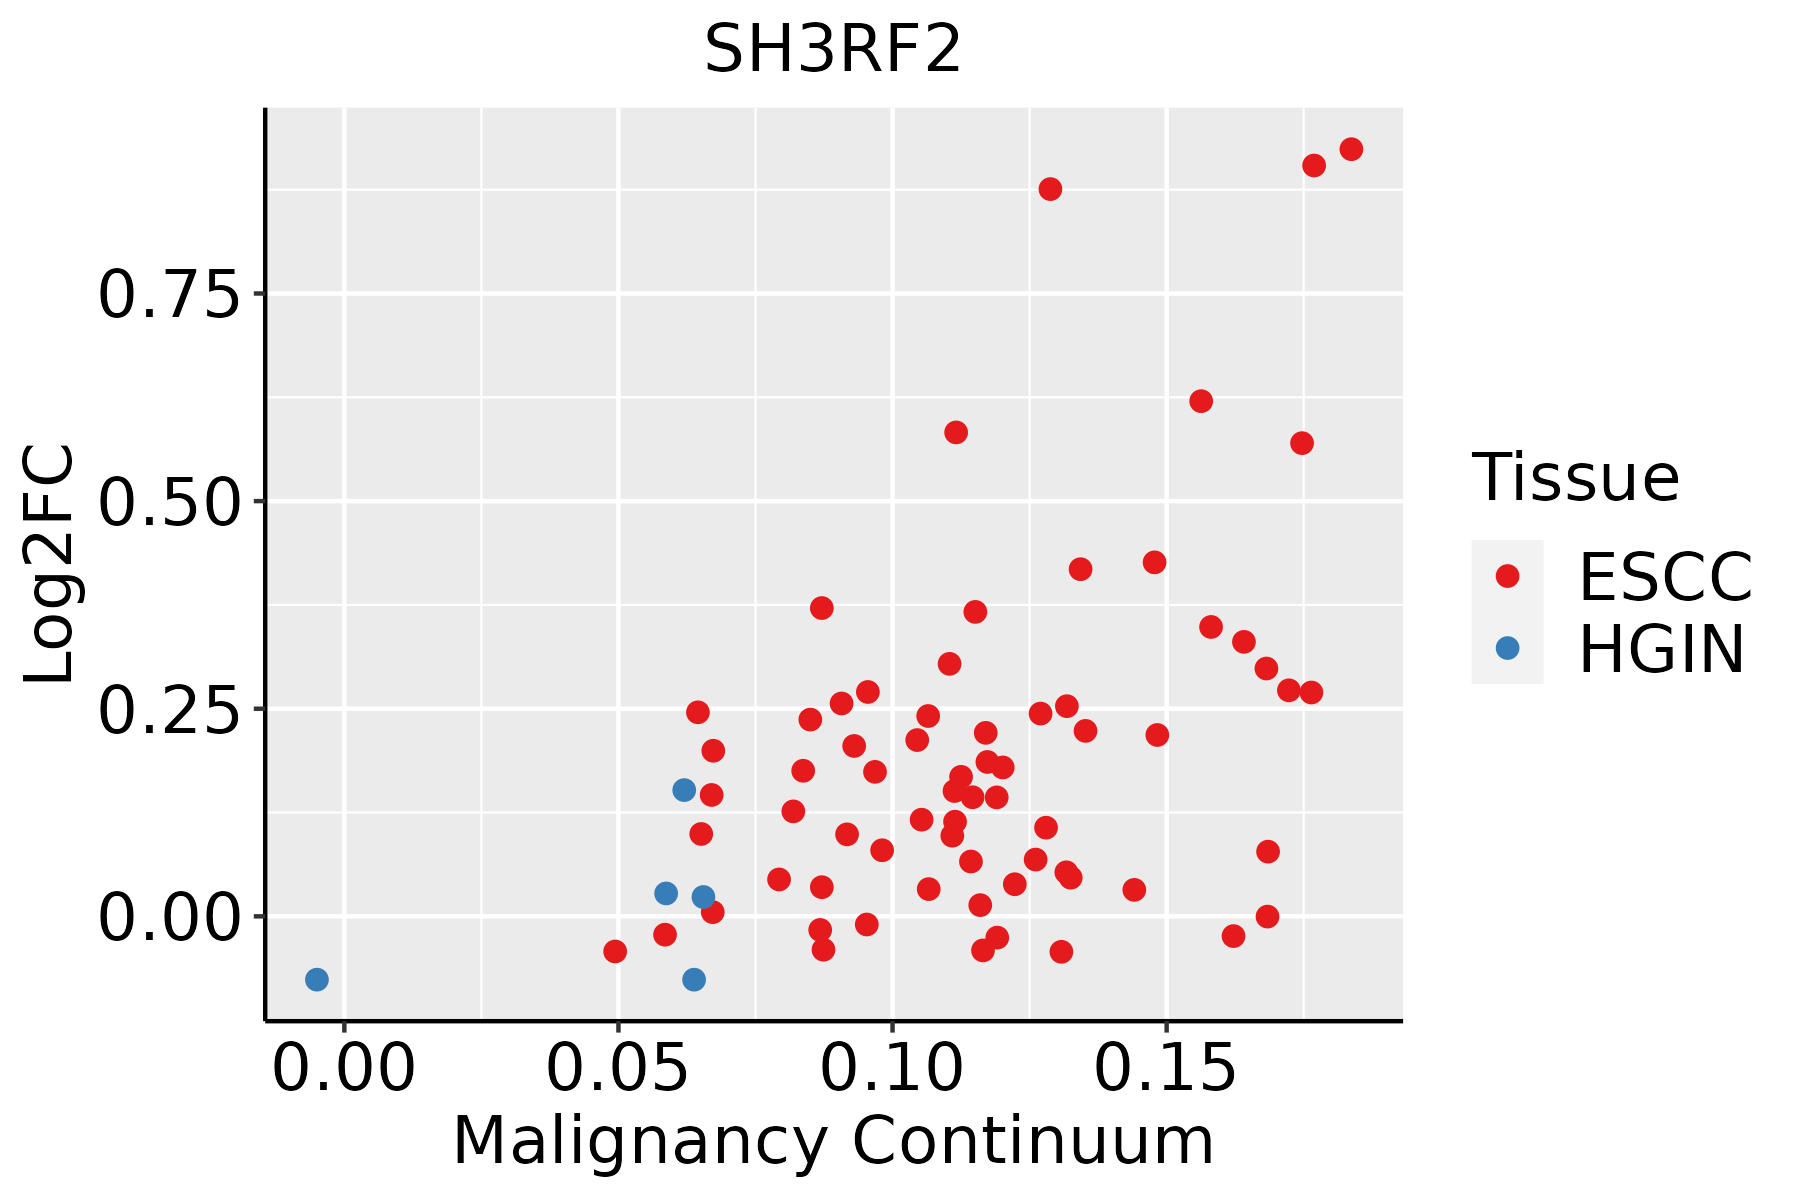 | ESCC: Esophageal squamous cell carcinoma |
| HGIN: High-grade intraepithelial neoplasias | ||
| LGIN: Low-grade intraepithelial neoplasias | ||
| Lung |  | AAH: Atypical adenomatous hyperplasia |
| AIS: Adenocarcinoma in situ | ||
| IAC: Invasive lung adenocarcinoma | ||
| MIA: Minimally invasive adenocarcinoma | ||
| Oral Cavity | 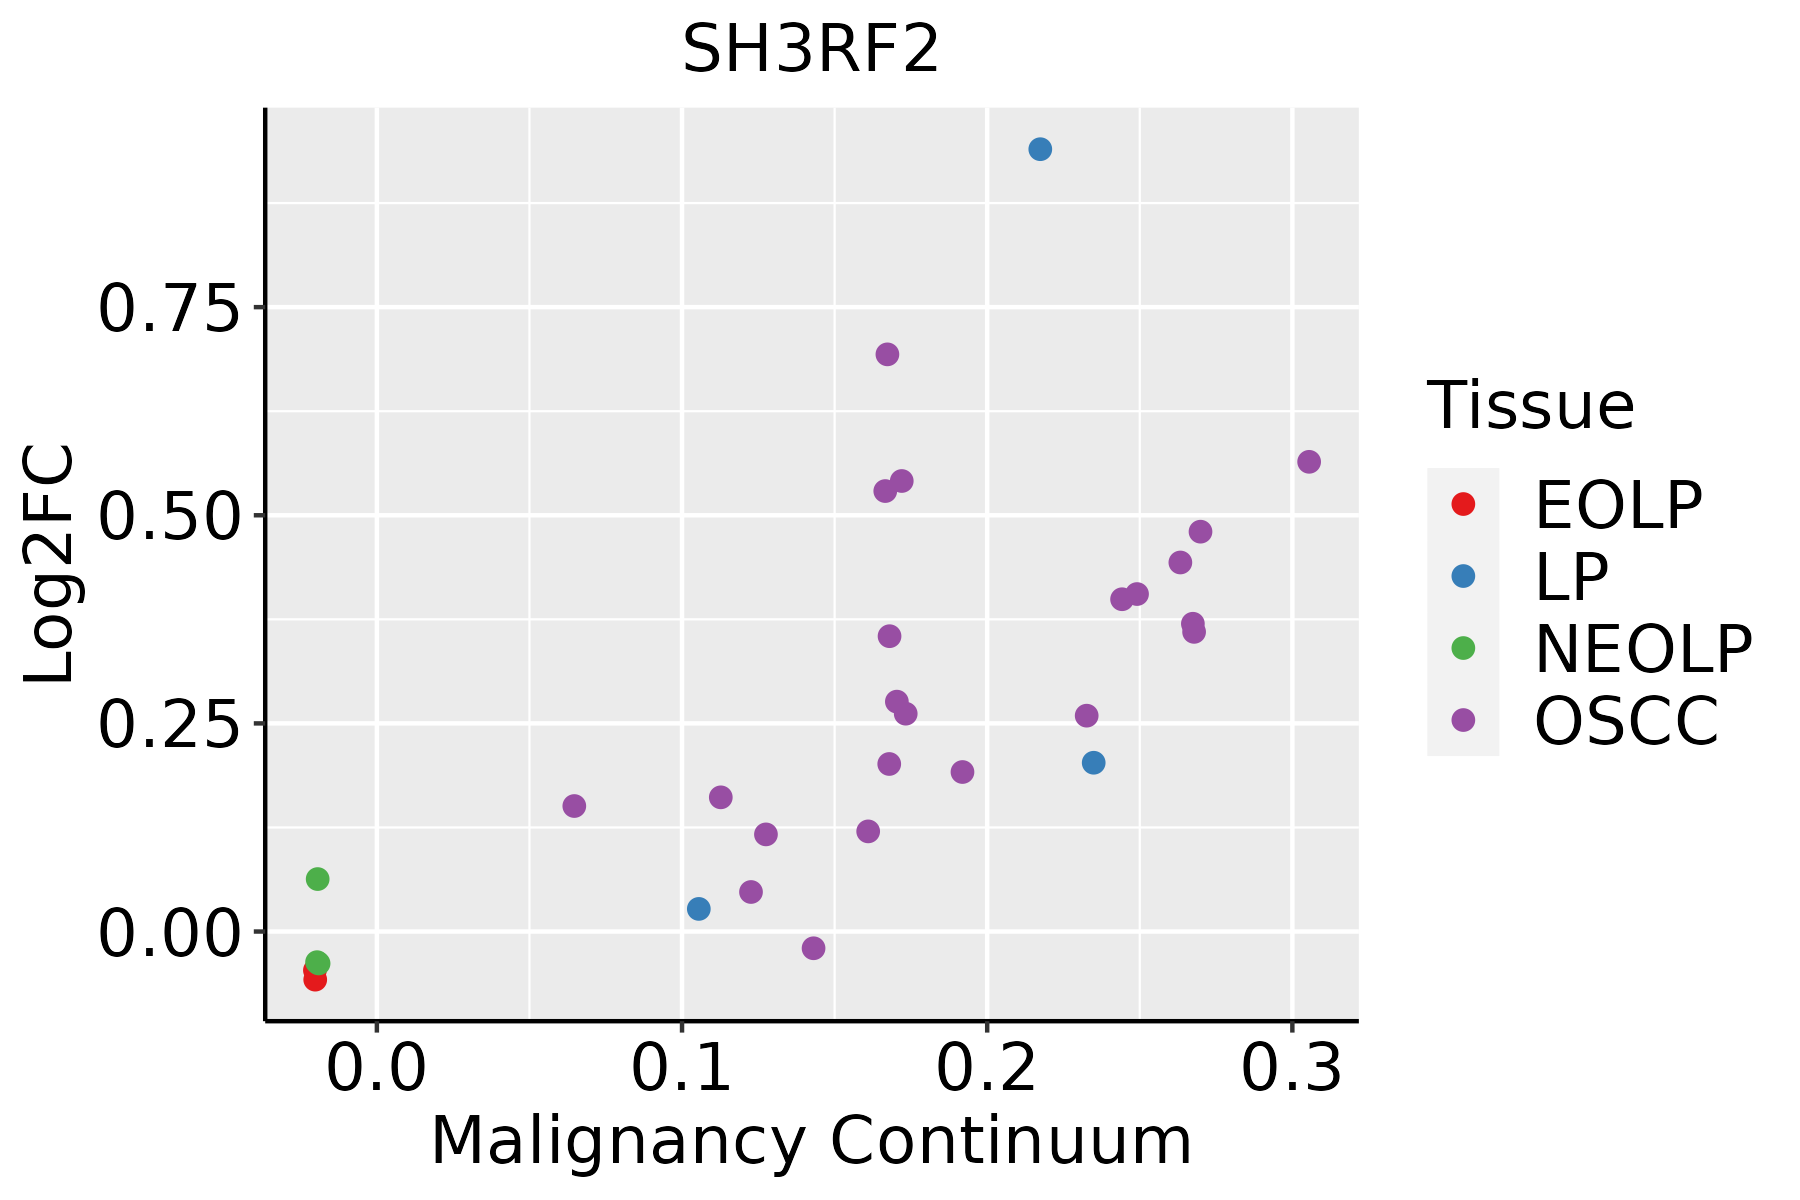 | EOLP: Erosive Oral lichen planus |
| LP: leukoplakia | ||
| NEOLP: Non-erosive oral lichen planus | ||
| OSCC: Oral squamous cell carcinoma | ||
| Skin | 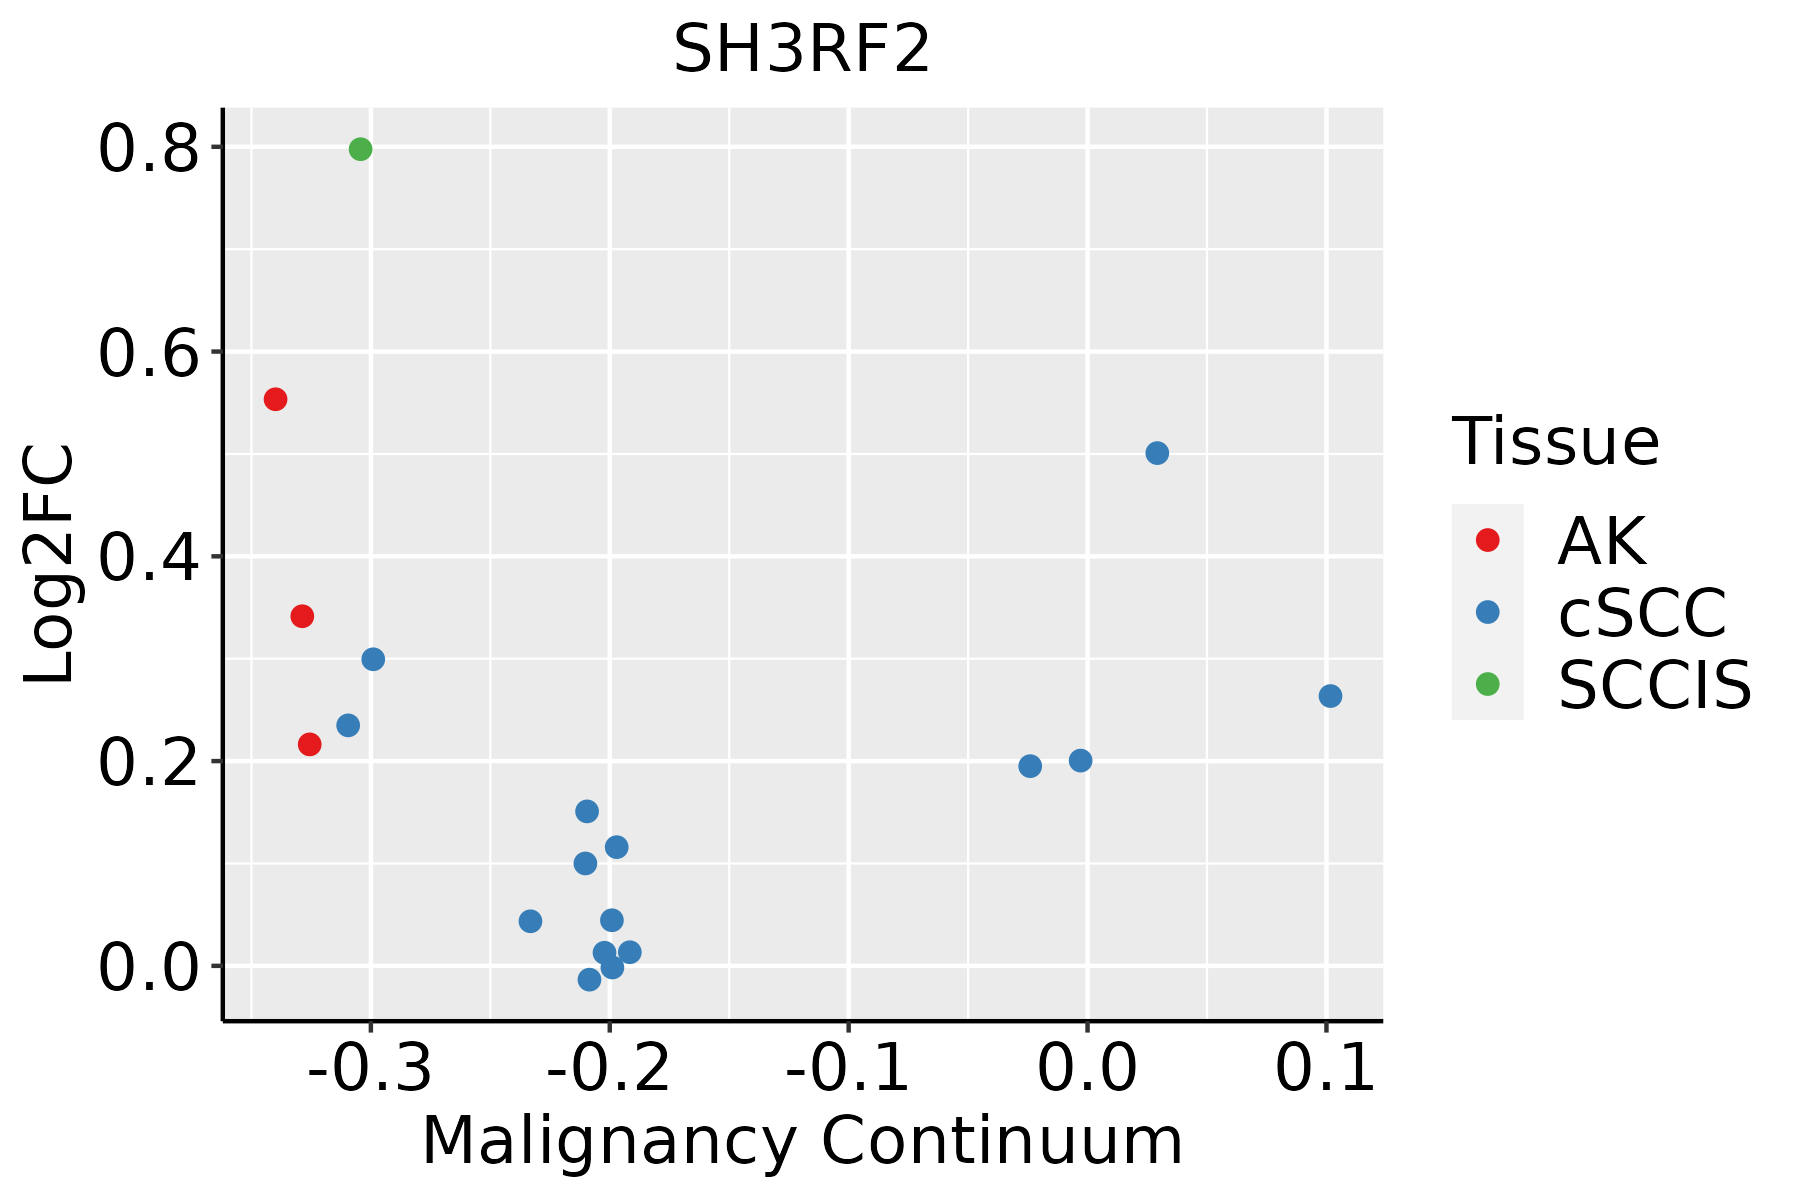 | AK: Actinic keratosis |
| cSCC: Cutaneous squamous cell carcinoma | ||
| SCCIS:squamous cell carcinoma in situ |
| ∗log2FC in expression of this searched gene in stem-like cells from each diseased tissue sample relative to stem-like cells in normal samples in each tissue plotted against the malignancy continuum. Samples are colored based on if they are from different disease stage. |
Top |
Malignant transformation related pathway analysis |
| Find out the enriched GO biological processes and KEGG pathways involved in transition from healthy to precancer to cancer |
| Tissue | Disease Stage | Enriched GO biological Processes |
| Colorectum | AD |  |
| Colorectum | SER |  |
| Colorectum | MSS |  |
| Colorectum | MSI-H |  |
| Colorectum | FAP |  |
| ∗Top 15 enriched GO BP terms are showed in the bar plot of each disease state in each tissue. Each row represents a significant GO biological process which is colored according to the -log10(p.adjust). |
| Page: 1 2 3 4 5 6 7 8 9 |
| GO ID | Tissue | Disease Stage | Description | Gene Ratio | Bg Ratio | pvalue | p.adjust | Count |
| GO:004217610 | Cervix | CC | regulation of protein catabolic process | 104/2311 | 391/18723 | 9.39e-15 | 9.36e-12 | 104 |
| GO:004586210 | Cervix | CC | positive regulation of proteolysis | 95/2311 | 372/18723 | 1.84e-12 | 6.86e-10 | 95 |
| GO:190336210 | Cervix | CC | regulation of cellular protein catabolic process | 72/2311 | 255/18723 | 5.98e-12 | 2.10e-09 | 72 |
| GO:004573210 | Cervix | CC | positive regulation of protein catabolic process | 65/2311 | 231/18723 | 7.44e-11 | 1.39e-08 | 65 |
| GO:001049810 | Cervix | CC | proteasomal protein catabolic process | 111/2311 | 490/18723 | 8.98e-11 | 1.58e-08 | 111 |
| GO:190332010 | Cervix | CC | regulation of protein modification by small protein conjugation or removal | 66/2311 | 242/18723 | 2.31e-10 | 3.46e-08 | 66 |
| GO:000989610 | Cervix | CC | positive regulation of catabolic process | 109/2311 | 492/18723 | 5.26e-10 | 6.99e-08 | 109 |
| GO:003139610 | Cervix | CC | regulation of protein ubiquitination | 59/2311 | 210/18723 | 5.90e-10 | 7.51e-08 | 59 |
| GO:190305010 | Cervix | CC | regulation of proteolysis involved in cellular protein catabolic process | 60/2311 | 221/18723 | 1.82e-09 | 1.98e-07 | 60 |
| GO:200005810 | Cervix | CC | regulation of ubiquitin-dependent protein catabolic process | 47/2311 | 164/18723 | 1.63e-08 | 1.25e-06 | 47 |
| GO:004316110 | Cervix | CC | proteasome-mediated ubiquitin-dependent protein catabolic process | 91/2311 | 412/18723 | 1.65e-08 | 1.25e-06 | 91 |
| GO:003133110 | Cervix | CC | positive regulation of cellular catabolic process | 91/2311 | 427/18723 | 9.64e-08 | 5.25e-06 | 91 |
| GO:190336410 | Cervix | CC | positive regulation of cellular protein catabolic process | 43/2311 | 155/18723 | 1.80e-07 | 8.28e-06 | 43 |
| GO:003139710 | Cervix | CC | negative regulation of protein ubiquitination | 28/2311 | 83/18723 | 3.32e-07 | 1.35e-05 | 28 |
| GO:006113610 | Cervix | CC | regulation of proteasomal protein catabolic process | 48/2311 | 187/18723 | 4.63e-07 | 1.77e-05 | 48 |
| GO:003243410 | Cervix | CC | regulation of proteasomal ubiquitin-dependent protein catabolic process | 38/2311 | 134/18723 | 4.99e-07 | 1.88e-05 | 38 |
| GO:00310988 | Cervix | CC | stress-activated protein kinase signaling cascade | 58/2311 | 247/18723 | 8.02e-07 | 2.89e-05 | 58 |
| GO:190332110 | Cervix | CC | negative regulation of protein modification by small protein conjugation or removal | 29/2311 | 95/18723 | 2.15e-06 | 6.55e-05 | 29 |
| GO:00514038 | Cervix | CC | stress-activated MAPK cascade | 55/2311 | 239/18723 | 2.96e-06 | 8.31e-05 | 55 |
| GO:00703027 | Cervix | CC | regulation of stress-activated protein kinase signaling cascade | 46/2311 | 195/18723 | 9.35e-06 | 2.11e-04 | 46 |
| Page: 1 2 3 4 5 6 7 8 9 10 11 12 13 14 15 16 17 18 19 20 21 22 |
| Pathway ID | Tissue | Disease Stage | Description | Gene Ratio | Bg Ratio | pvalue | p.adjust | qvalue | Count |
| Page: 1 |
Top |
Cell-cell communication analysis |
| Identification of potential cell-cell interactions between two cell types and their ligand-receptor pairs for different disease states |
| Ligand | Receptor | LRpair | Pathway | Tissue | Disease Stage |
| Page: 1 |
Top |
Single-cell gene regulatory network inference analysis |
| Find out the significant the regulons (TFs) and the target genes of each regulon across cell types for different disease states |
| TF | Cell Type | Tissue | Disease Stage | Target Gene | RSS | Regulon Activity |
| ∗The dot plots of a searched regulon are shown for all cell subpopulations in each disease state of each tissue based on the regulon specific score inferred using pySCENIC and by calculating the average expression. |
| Page: 1 |
Top |
Somatic mutation of malignant transformation related genes |
| Annotation of somatic variants for genes involved in malignant transformation |
| Hugo Symbol | Variant Class | Variant Classification | dbSNP RS | HGVSc | HGVSp | HGVSp Short | SWISSPROT | BIOTYPE | SIFT | PolyPhen | Tumor Sample Barcode | Tissue | Histology | Sex | Age | Stage | Therapy Types | Drugs | Outcome |
| SH3RF2 | SNV | Missense_Mutation | c.742G>A | p.Glu248Lys | p.E248K | Q8TEC5 | protein_coding | deleterious(0.01) | probably_damaging(0.994) | TCGA-B6-A0RL-01 | Breast | breast invasive carcinoma | Female | <65 | I/II | Unknown | Unknown | SD | |
| SH3RF2 | SNV | Missense_Mutation | rs139468138 | c.2075N>A | p.Arg692Gln | p.R692Q | Q8TEC5 | protein_coding | deleterious(0) | probably_damaging(0.992) | TCGA-BH-A42T-01 | Breast | breast invasive carcinoma | Female | >=65 | I/II | Unknown | Unknown | SD |
| SH3RF2 | SNV | Missense_Mutation | novel | c.359T>C | p.Val120Ala | p.V120A | Q8TEC5 | protein_coding | tolerated(0.46) | benign(0) | TCGA-2W-A8YY-01 | Cervix | cervical & endocervical cancer | Female | <65 | I/II | Chemotherapy | cisplatin | CR |
| SH3RF2 | SNV | Missense_Mutation | rs747775775 | c.1306N>A | p.Val436Ile | p.V436I | Q8TEC5 | protein_coding | deleterious(0.02) | benign(0.144) | TCGA-C5-A7UE-01 | Cervix | cervical & endocervical cancer | Female | <65 | I/II | Chemotherapy | cisplatin | SD |
| SH3RF2 | SNV | Missense_Mutation | rs747678660 | c.1585G>A | p.Gly529Arg | p.G529R | Q8TEC5 | protein_coding | tolerated(0.07) | benign(0.031) | TCGA-C5-A7UH-01 | Cervix | cervical & endocervical cancer | Female | <65 | III/IV | Chemotherapy | cisplatin | SD |
| SH3RF2 | SNV | Missense_Mutation | c.1516C>A | p.Gln506Lys | p.Q506K | Q8TEC5 | protein_coding | deleterious(0.01) | benign(0.156) | TCGA-DG-A2KK-01 | Cervix | cervical & endocervical cancer | Female | <65 | III/IV | Chemotherapy | cisplatin | SD | |
| SH3RF2 | SNV | Missense_Mutation | rs757233835 | c.496N>A | p.Glu166Lys | p.E166K | Q8TEC5 | protein_coding | deleterious(0.02) | probably_damaging(0.936) | TCGA-Q1-A73O-01 | Cervix | cervical & endocervical cancer | Female | <65 | I/II | Chemotherapy | cisplatin | CR |
| SH3RF2 | SNV | Missense_Mutation | c.2039N>T | p.Ser680Phe | p.S680F | Q8TEC5 | protein_coding | tolerated(0.61) | benign(0.048) | TCGA-AA-A00N-01 | Colorectum | colon adenocarcinoma | Male | >=65 | I/II | Unknown | Unknown | PD | |
| SH3RF2 | SNV | Missense_Mutation | novel | c.935N>C | p.Val312Ala | p.V312A | Q8TEC5 | protein_coding | deleterious(0.05) | probably_damaging(0.918) | TCGA-AZ-4315-01 | Colorectum | colon adenocarcinoma | Male | <65 | I/II | Unknown | Unknown | SD |
| SH3RF2 | SNV | Missense_Mutation | rs753470880 | c.1696G>A | p.Val566Met | p.V566M | Q8TEC5 | protein_coding | tolerated(0.25) | benign(0.005) | TCGA-CM-4743-01 | Colorectum | colon adenocarcinoma | Male | >=65 | I/II | Chemotherapy | capecitabine | SD |
| Page: 1 2 3 4 5 6 7 |
Top |
Related drugs of malignant transformation related genes |
| Identification of chemicals and drugs interact with genes involved in malignant transfromation |
| (DGIdb 4.0) |
| Entrez ID | Symbol | Category | Interaction Types | Drug Claim Name | Drug Name | PMIDs |
| Page: 1 |

Copyright 2023-Present -The University of Texas Health Science Center at Houston |