
|
|||||
|
 | |
| |
| |
| |
| |
| |
|
Gene: SH3KBP1 |
Gene summary for SH3KBP1 |
| Gene information | Species | Human | Gene symbol | SH3KBP1 | Gene ID | 30011 |
| Gene name | SH3 domain containing kinase binding protein 1 | |
| Gene Alias | AGMX2 | |
| Cytomap | Xp22.12 | |
| Gene Type | protein-coding | GO ID | GO:0000902 | UniProtAcc | Q96B97 |
Top |
Malignant transformation analysis |
| Identification of the aberrant gene expression in precancerous and cancerous lesions by comparing the gene expression of stem-like cells in diseased tissues with normal stem cells |
| Entrez ID | Symbol | Replicates | Species | Organ | Tissue | Adj P-value | Log2FC | Malignancy |
| 30011 | SH3KBP1 | HTA11_2487_2000001011 | Human | Colorectum | SER | 5.50e-07 | 6.14e-01 | -0.1808 |
| 30011 | SH3KBP1 | HTA11_1938_2000001011 | Human | Colorectum | AD | 1.34e-07 | 6.94e-01 | -0.0811 |
| 30011 | SH3KBP1 | HTA11_78_2000001011 | Human | Colorectum | AD | 9.48e-05 | 6.44e-01 | -0.1088 |
| 30011 | SH3KBP1 | HTA11_347_2000001011 | Human | Colorectum | AD | 4.26e-37 | 1.18e+00 | -0.1954 |
| 30011 | SH3KBP1 | HTA11_83_2000001011 | Human | Colorectum | SER | 1.75e-05 | 7.03e-01 | -0.1526 |
| 30011 | SH3KBP1 | HTA11_696_2000001011 | Human | Colorectum | AD | 4.21e-04 | 4.74e-01 | -0.1464 |
| 30011 | SH3KBP1 | HTA11_866_2000001011 | Human | Colorectum | AD | 1.17e-03 | 4.21e-01 | -0.1001 |
| 30011 | SH3KBP1 | HTA11_1391_2000001011 | Human | Colorectum | AD | 4.13e-02 | 4.86e-01 | -0.059 |
| 30011 | SH3KBP1 | F007 | Human | Colorectum | FAP | 2.47e-02 | -3.19e-01 | 0.1176 |
| 30011 | SH3KBP1 | A015-C-203 | Human | Colorectum | FAP | 4.43e-14 | -2.56e-01 | -0.1294 |
| 30011 | SH3KBP1 | A002-C-201 | Human | Colorectum | FAP | 1.13e-05 | -1.89e-01 | 0.0324 |
| 30011 | SH3KBP1 | A001-C-119 | Human | Colorectum | FAP | 6.50e-03 | -3.02e-01 | -0.1557 |
| 30011 | SH3KBP1 | A001-C-108 | Human | Colorectum | FAP | 4.39e-07 | -1.55e-01 | -0.0272 |
| 30011 | SH3KBP1 | A002-C-205 | Human | Colorectum | FAP | 1.31e-10 | -2.81e-01 | -0.1236 |
| 30011 | SH3KBP1 | A015-C-006 | Human | Colorectum | FAP | 1.39e-05 | -2.67e-01 | -0.0994 |
| 30011 | SH3KBP1 | A015-C-106 | Human | Colorectum | FAP | 1.67e-03 | -2.06e-01 | -0.0511 |
| 30011 | SH3KBP1 | A002-C-114 | Human | Colorectum | FAP | 4.56e-08 | -1.86e-01 | -0.1561 |
| 30011 | SH3KBP1 | A015-C-104 | Human | Colorectum | FAP | 1.57e-17 | -3.06e-01 | -0.1899 |
| 30011 | SH3KBP1 | A001-C-014 | Human | Colorectum | FAP | 5.17e-03 | -1.77e-01 | 0.0135 |
| 30011 | SH3KBP1 | A002-C-016 | Human | Colorectum | FAP | 2.63e-07 | -1.20e-01 | 0.0521 |
| Page: 1 2 3 4 5 |
| Tissue | Expression Dynamics | Abbreviation |
| Colorectum (GSE201348) |  | FAP: Familial adenomatous polyposis |
| CRC: Colorectal cancer | ||
| Colorectum (HTA11) |  | AD: Adenomas |
| SER: Sessile serrated lesions | ||
| MSI-H: Microsatellite-high colorectal cancer | ||
| MSS: Microsatellite stable colorectal cancer | ||
| Esophagus |  | ESCC: Esophageal squamous cell carcinoma |
| HGIN: High-grade intraepithelial neoplasias | ||
| LGIN: Low-grade intraepithelial neoplasias | ||
| Liver |  | HCC: Hepatocellular carcinoma |
| NAFLD: Non-alcoholic fatty liver disease | ||
| Lung | 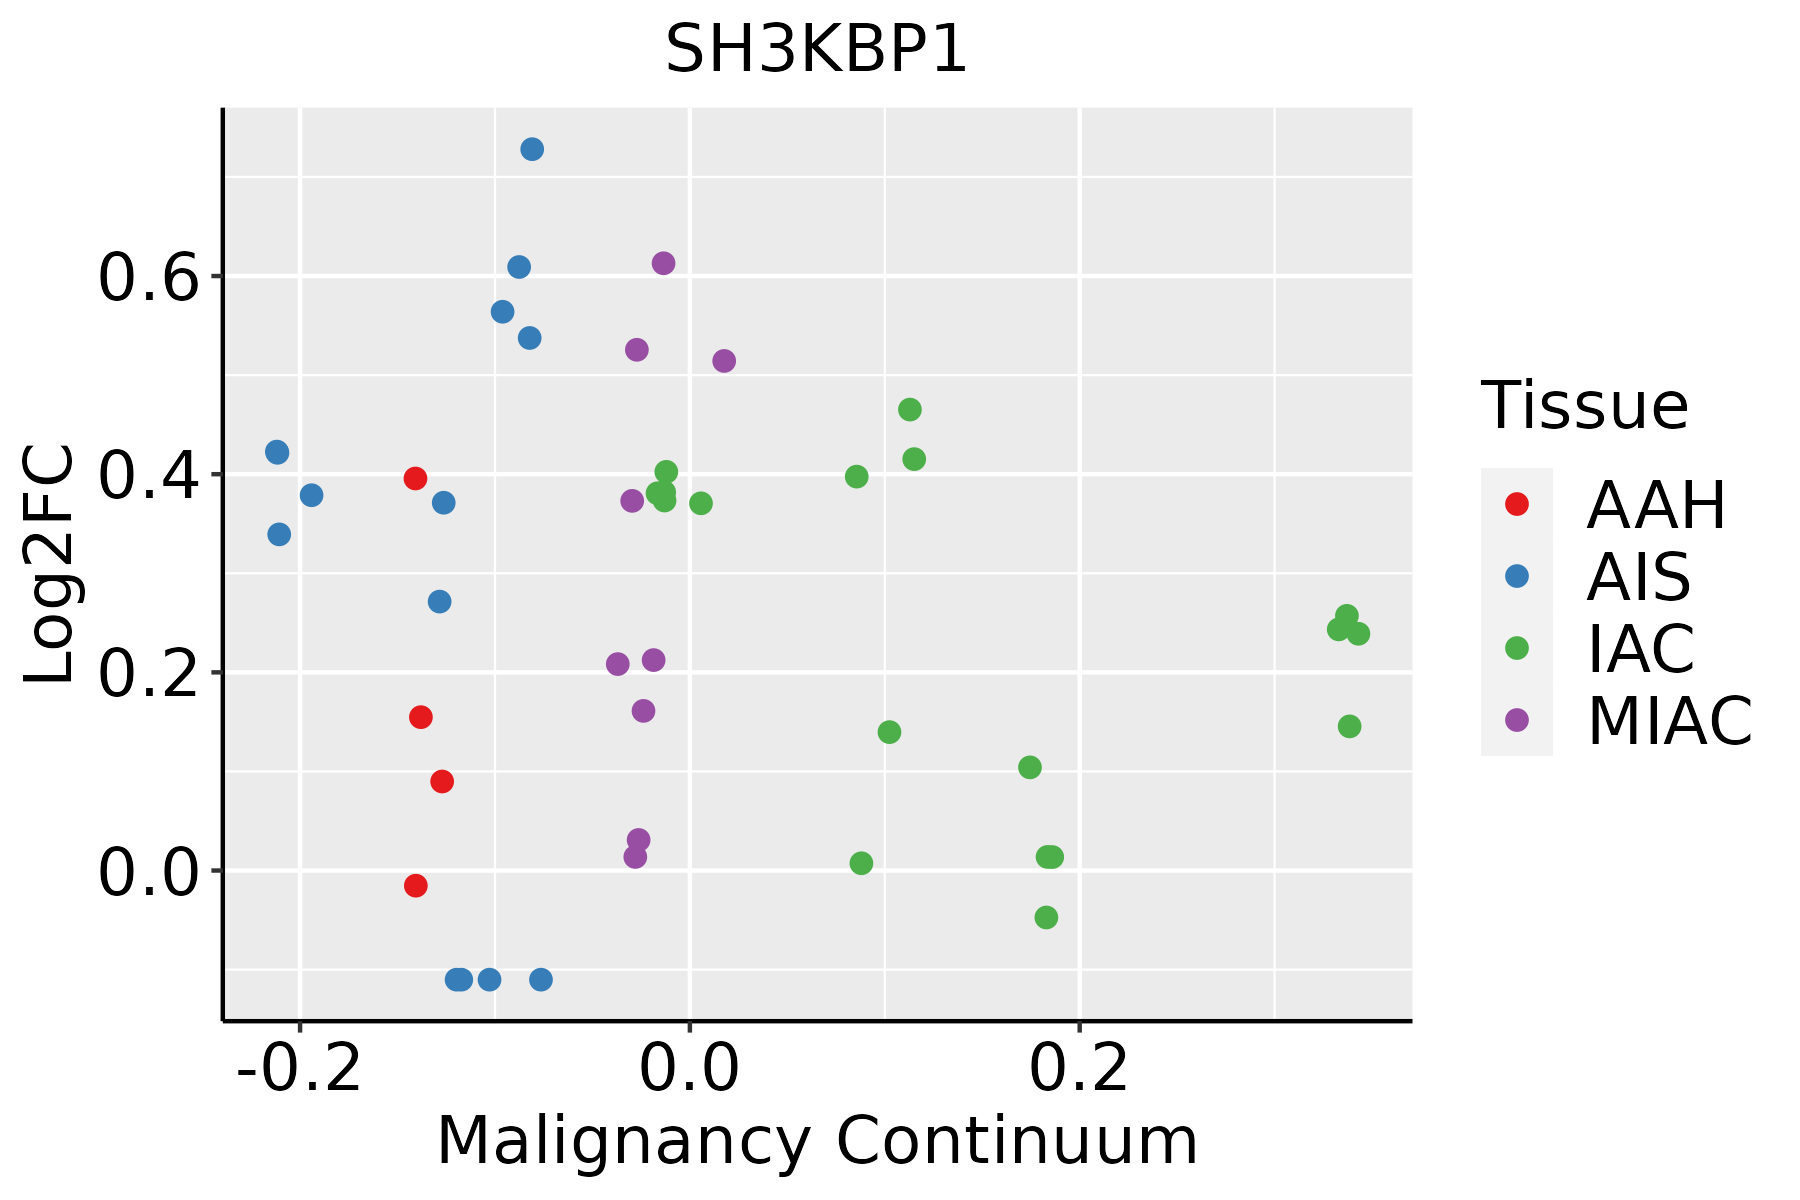 | AAH: Atypical adenomatous hyperplasia |
| AIS: Adenocarcinoma in situ | ||
| IAC: Invasive lung adenocarcinoma | ||
| MIA: Minimally invasive adenocarcinoma | ||
| Oral Cavity |  | EOLP: Erosive Oral lichen planus |
| LP: leukoplakia | ||
| NEOLP: Non-erosive oral lichen planus | ||
| OSCC: Oral squamous cell carcinoma | ||
| Thyroid | 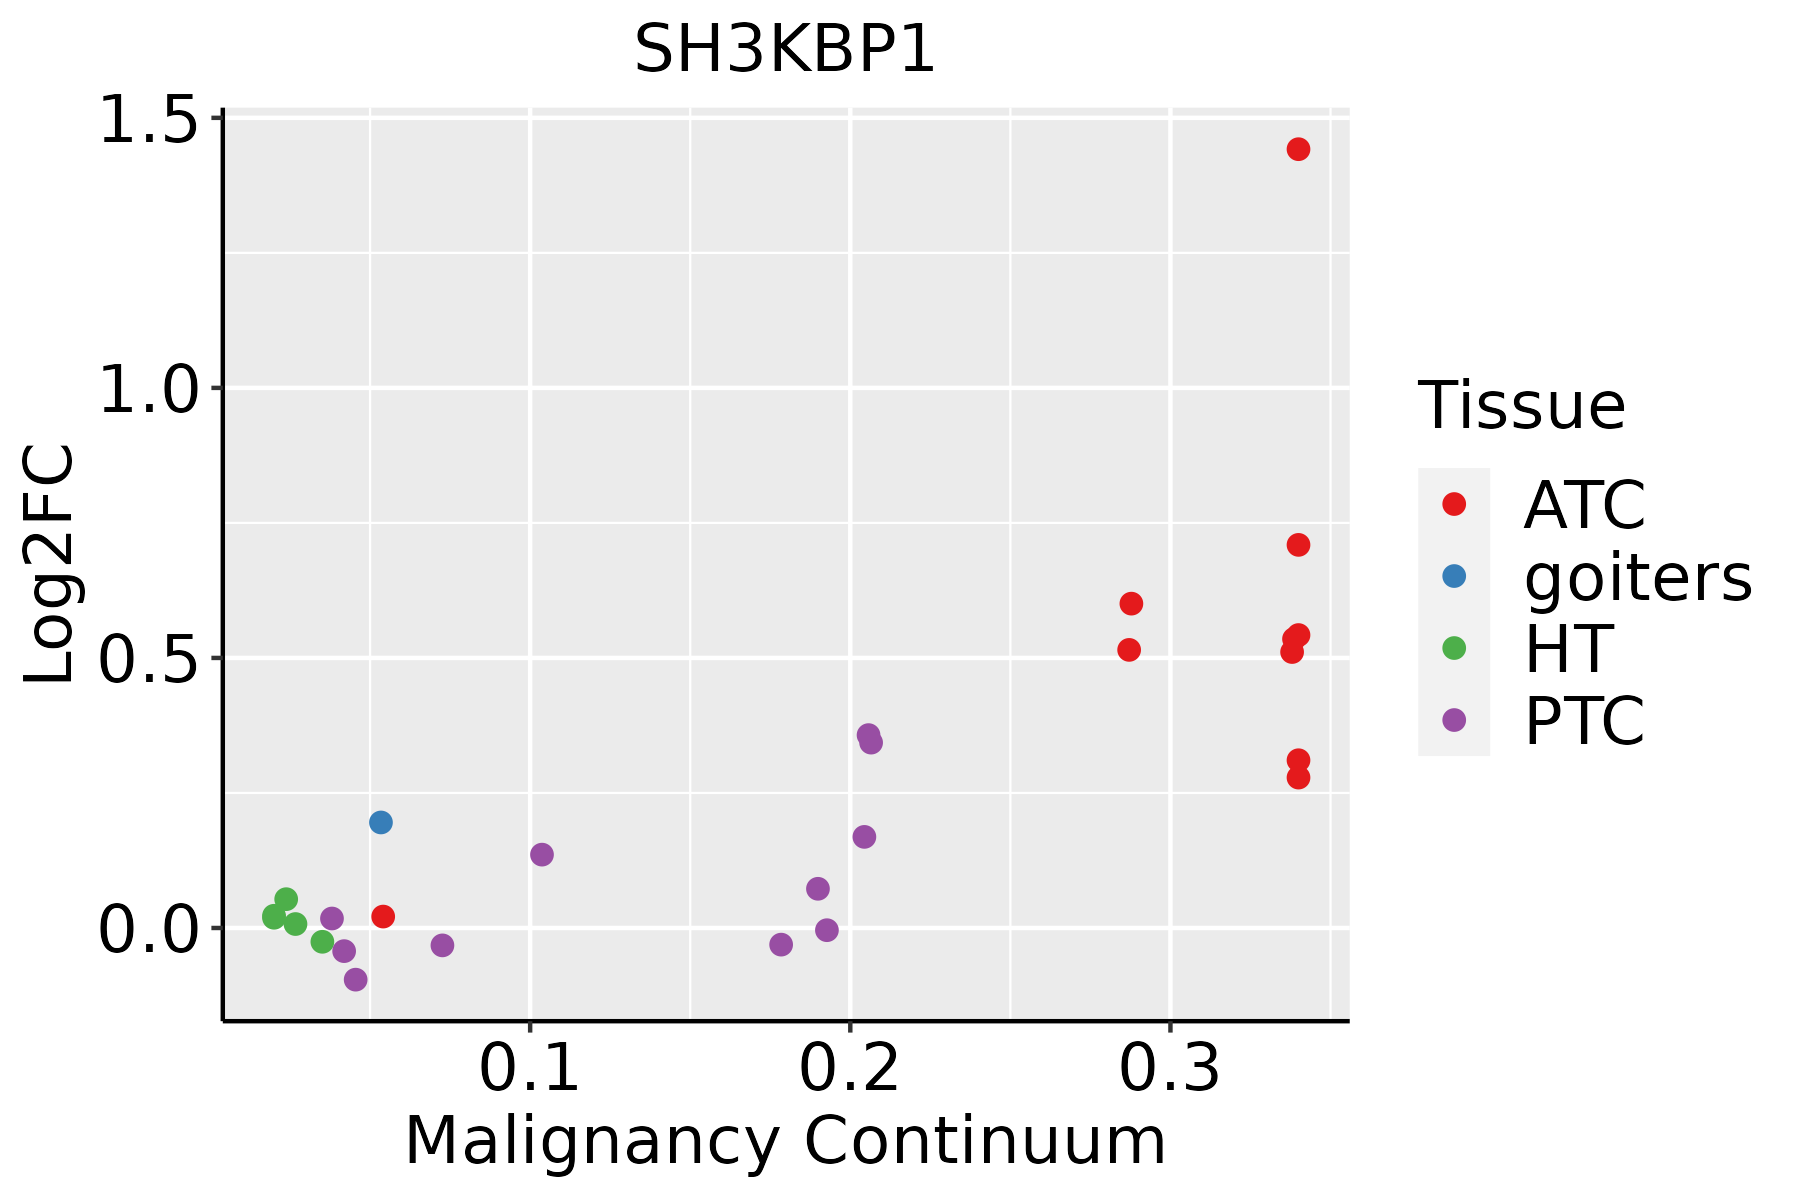 | ATC: Anaplastic thyroid cancer |
| HT: Hashimoto's thyroiditis | ||
| PTC: Papillary thyroid cancer |
| ∗log2FC in expression of this searched gene in stem-like cells from each diseased tissue sample relative to stem-like cells in normal samples in each tissue plotted against the malignancy continuum. Samples are colored based on if they are from different disease stage. |
Top |
Malignant transformation related pathway analysis |
| Find out the enriched GO biological processes and KEGG pathways involved in transition from healthy to precancer to cancer |
| Tissue | Disease Stage | Enriched GO biological Processes |
| Colorectum | AD |  |
| Colorectum | SER |  |
| Colorectum | MSS |  |
| Colorectum | MSI-H |  |
| Colorectum | FAP |  |
| ∗Top 15 enriched GO BP terms are showed in the bar plot of each disease state in each tissue. Each row represents a significant GO biological process which is colored according to the -log10(p.adjust). |
| Page: 1 2 3 4 5 6 7 8 9 |
| GO ID | Tissue | Disease Stage | Description | Gene Ratio | Bg Ratio | pvalue | p.adjust | Count |
| GO:0007015 | Colorectum | AD | actin filament organization | 167/3918 | 442/18723 | 1.65e-16 | 7.94e-14 | 167 |
| GO:0022604 | Colorectum | AD | regulation of cell morphogenesis | 109/3918 | 309/18723 | 3.08e-09 | 2.07e-07 | 109 |
| GO:0008360 | Colorectum | AD | regulation of cell shape | 56/3918 | 154/18723 | 7.01e-06 | 1.73e-04 | 56 |
| GO:00070151 | Colorectum | SER | actin filament organization | 134/2897 | 442/18723 | 1.39e-15 | 5.70e-13 | 134 |
| GO:00226041 | Colorectum | SER | regulation of cell morphogenesis | 89/2897 | 309/18723 | 1.51e-09 | 1.52e-07 | 89 |
| GO:00083601 | Colorectum | SER | regulation of cell shape | 43/2897 | 154/18723 | 5.47e-05 | 1.30e-03 | 43 |
| GO:00070154 | Colorectum | FAP | actin filament organization | 125/2622 | 442/18723 | 1.97e-15 | 3.03e-12 | 125 |
| GO:00226044 | Colorectum | FAP | regulation of cell morphogenesis | 87/2622 | 309/18723 | 4.89e-11 | 1.87e-08 | 87 |
| GO:00083603 | Colorectum | FAP | regulation of cell shape | 43/2622 | 154/18723 | 4.55e-06 | 1.52e-04 | 43 |
| GO:000701527 | Esophagus | ESCC | actin filament organization | 259/8552 | 442/18723 | 2.37e-08 | 4.50e-07 | 259 |
| GO:002260420 | Esophagus | ESCC | regulation of cell morphogenesis | 180/8552 | 309/18723 | 5.19e-06 | 5.45e-05 | 180 |
| GO:000836018 | Esophagus | ESCC | regulation of cell shape | 92/8552 | 154/18723 | 3.00e-04 | 1.81e-03 | 92 |
| GO:002260422 | Liver | HCC | regulation of cell morphogenesis | 188/7958 | 309/18723 | 4.84e-11 | 1.82e-09 | 188 |
| GO:000701522 | Liver | HCC | actin filament organization | 252/7958 | 442/18723 | 3.83e-10 | 1.25e-08 | 252 |
| GO:000836022 | Liver | HCC | regulation of cell shape | 92/7958 | 154/18723 | 1.15e-05 | 1.31e-04 | 92 |
| GO:00226048 | Lung | IAC | regulation of cell morphogenesis | 74/2061 | 309/18723 | 6.31e-11 | 1.70e-08 | 74 |
| GO:00070158 | Lung | IAC | actin filament organization | 92/2061 | 442/18723 | 1.01e-09 | 1.93e-07 | 92 |
| GO:00083607 | Lung | IAC | regulation of cell shape | 37/2061 | 154/18723 | 3.35e-06 | 1.42e-04 | 37 |
| GO:000701513 | Lung | AIS | actin filament organization | 88/1849 | 442/18723 | 1.02e-10 | 3.13e-08 | 88 |
| GO:002260413 | Lung | AIS | regulation of cell morphogenesis | 65/1849 | 309/18723 | 2.97e-09 | 5.09e-07 | 65 |
| Page: 1 2 3 |
| Pathway ID | Tissue | Disease Stage | Description | Gene Ratio | Bg Ratio | pvalue | p.adjust | qvalue | Count |
| hsa04144 | Colorectum | AD | Endocytosis | 111/2092 | 251/8465 | 5.95e-12 | 1.42e-10 | 9.08e-11 | 111 |
| hsa041441 | Colorectum | AD | Endocytosis | 111/2092 | 251/8465 | 5.95e-12 | 1.42e-10 | 9.08e-11 | 111 |
| hsa041442 | Colorectum | SER | Endocytosis | 81/1580 | 251/8465 | 1.14e-07 | 2.36e-06 | 1.71e-06 | 81 |
| hsa041443 | Colorectum | SER | Endocytosis | 81/1580 | 251/8465 | 1.14e-07 | 2.36e-06 | 1.71e-06 | 81 |
| hsa041446 | Colorectum | FAP | Endocytosis | 78/1404 | 251/8465 | 6.20e-09 | 2.96e-07 | 1.80e-07 | 78 |
| hsa041447 | Colorectum | FAP | Endocytosis | 78/1404 | 251/8465 | 6.20e-09 | 2.96e-07 | 1.80e-07 | 78 |
| hsa04144210 | Esophagus | ESCC | Endocytosis | 186/4205 | 251/8465 | 9.74e-16 | 4.66e-14 | 2.39e-14 | 186 |
| hsa0414437 | Esophagus | ESCC | Endocytosis | 186/4205 | 251/8465 | 9.74e-16 | 4.66e-14 | 2.39e-14 | 186 |
| hsa0414422 | Liver | HCC | Endocytosis | 178/4020 | 251/8465 | 2.03e-14 | 5.22e-13 | 2.91e-13 | 178 |
| hsa0414432 | Liver | HCC | Endocytosis | 178/4020 | 251/8465 | 2.03e-14 | 5.22e-13 | 2.91e-13 | 178 |
| hsa0414414 | Lung | IAC | Endocytosis | 51/1053 | 251/8465 | 2.25e-04 | 2.54e-03 | 1.68e-03 | 51 |
| hsa0414415 | Lung | IAC | Endocytosis | 51/1053 | 251/8465 | 2.25e-04 | 2.54e-03 | 1.68e-03 | 51 |
| hsa0414423 | Lung | AIS | Endocytosis | 52/961 | 251/8465 | 9.74e-06 | 3.04e-04 | 1.95e-04 | 52 |
| hsa0414433 | Lung | AIS | Endocytosis | 52/961 | 251/8465 | 9.74e-06 | 3.04e-04 | 1.95e-04 | 52 |
| hsa0414427 | Oral cavity | OSCC | Endocytosis | 174/3704 | 251/8465 | 9.42e-17 | 4.51e-15 | 2.29e-15 | 174 |
| hsa04144112 | Oral cavity | OSCC | Endocytosis | 174/3704 | 251/8465 | 9.42e-17 | 4.51e-15 | 2.29e-15 | 174 |
| hsa0414442 | Oral cavity | EOLP | Endocytosis | 71/1218 | 251/8465 | 5.28e-09 | 8.97e-08 | 5.29e-08 | 71 |
| hsa0414452 | Oral cavity | EOLP | Endocytosis | 71/1218 | 251/8465 | 5.28e-09 | 8.97e-08 | 5.29e-08 | 71 |
| hsa0414461 | Oral cavity | NEOLP | Endocytosis | 62/1112 | 251/8465 | 3.56e-07 | 4.92e-06 | 3.09e-06 | 62 |
| hsa0414471 | Oral cavity | NEOLP | Endocytosis | 62/1112 | 251/8465 | 3.56e-07 | 4.92e-06 | 3.09e-06 | 62 |
| Page: 1 |
Top |
Cell-cell communication analysis |
| Identification of potential cell-cell interactions between two cell types and their ligand-receptor pairs for different disease states |
| Ligand | Receptor | LRpair | Pathway | Tissue | Disease Stage |
| Page: 1 |
Top |
Single-cell gene regulatory network inference analysis |
| Find out the significant the regulons (TFs) and the target genes of each regulon across cell types for different disease states |
| TF | Cell Type | Tissue | Disease Stage | Target Gene | RSS | Regulon Activity |
| ∗The dot plots of a searched regulon are shown for all cell subpopulations in each disease state of each tissue based on the regulon specific score inferred using pySCENIC and by calculating the average expression. |
| Page: 1 |
Top |
Somatic mutation of malignant transformation related genes |
| Annotation of somatic variants for genes involved in malignant transformation |
| Hugo Symbol | Variant Class | Variant Classification | dbSNP RS | HGVSc | HGVSp | HGVSp Short | SWISSPROT | BIOTYPE | SIFT | PolyPhen | Tumor Sample Barcode | Tissue | Histology | Sex | Age | Stage | Therapy Types | Drugs | Outcome |
| SH3KBP1 | SNV | Missense_Mutation | c.254N>T | p.Ser85Phe | p.S85F | Q96B97 | protein_coding | tolerated(0.73) | benign(0.054) | TCGA-5L-AAT1-01 | Breast | breast invasive carcinoma | Female | <65 | III/IV | Hormone Therapy | letrozol | SD | |
| SH3KBP1 | SNV | Missense_Mutation | c.1579N>A | p.Val527Met | p.V527M | Q96B97 | protein_coding | tolerated(0.16) | benign(0.011) | TCGA-A8-A09Z-01 | Breast | breast invasive carcinoma | Female | >=65 | I/II | Unknown | Unknown | SD | |
| SH3KBP1 | SNV | Missense_Mutation | c.262A>C | p.Thr88Pro | p.T88P | Q96B97 | protein_coding | tolerated(0.29) | benign(0) | TCGA-AO-A128-01 | Breast | breast invasive carcinoma | Female | <65 | I/II | Chemotherapy | doxorubicin | SD | |
| SH3KBP1 | SNV | Missense_Mutation | c.1890N>T | p.Gln630His | p.Q630H | Q96B97 | protein_coding | tolerated(0.73) | benign(0.031) | TCGA-BH-A1ES-06 | Breast | breast invasive carcinoma | Female | <65 | I/II | Unknown | Unknown | PD | |
| SH3KBP1 | SNV | Missense_Mutation | c.56N>A | p.Thr19Lys | p.T19K | Q96B97 | protein_coding | deleterious(0) | probably_damaging(0.956) | TCGA-D8-A142-01 | Breast | breast invasive carcinoma | Female | >=65 | I/II | Chemotherapy | cyclophosphamid | SD | |
| SH3KBP1 | SNV | Missense_Mutation | c.694N>A | p.Glu232Lys | p.E232K | Q96B97 | protein_coding | deleterious(0.02) | possibly_damaging(0.724) | TCGA-D8-A1JA-01 | Breast | breast invasive carcinoma | Female | <65 | III/IV | Chemotherapy | adriamycin | PD | |
| SH3KBP1 | SNV | Missense_Mutation | c.200N>G | p.Asn67Ser | p.N67S | Q96B97 | protein_coding | tolerated(0.91) | benign(0) | TCGA-D8-A1JS-01 | Breast | breast invasive carcinoma | Female | >=65 | I/II | Hormone Therapy | tamoxiphen | SD | |
| SH3KBP1 | SNV | Missense_Mutation | rs776375600 | c.1706C>T | p.Ala569Val | p.A569V | Q96B97 | protein_coding | tolerated(0.41) | benign(0) | TCGA-D8-A1XR-01 | Breast | breast invasive carcinoma | Female | <65 | I/II | Chemotherapy | adriamycin+cyclophosphamide | SD |
| SH3KBP1 | SNV | Missense_Mutation | novel | c.343G>A | p.Asp115Asn | p.D115N | Q96B97 | protein_coding | deleterious(0) | probably_damaging(1) | TCGA-LL-A7SZ-01 | Breast | breast invasive carcinoma | Female | <65 | I/II | Chemotherapy | adriamycin | CR |
| SH3KBP1 | deletion | Frame_Shift_Del | c.772_799delNNNNNNNNNNNNNNNNNNNNNNNNNNNN | p.Ser258ArgfsTer8 | p.S258Rfs*8 | Q96B97 | protein_coding | TCGA-AO-A0JB-01 | Breast | breast invasive carcinoma | Female | <65 | III/IV | Chemotherapy | cyclophosphamide | SD |
| Page: 1 2 3 4 5 6 7 8 9 10 |
Top |
Related drugs of malignant transformation related genes |
| Identification of chemicals and drugs interact with genes involved in malignant transfromation |
| (DGIdb 4.0) |
| Entrez ID | Symbol | Category | Interaction Types | Drug Claim Name | Drug Name | PMIDs |
| Page: 1 |

Copyright 2023-Present -The University of Texas Health Science Center at Houston |