
|
|||||
|
 | |
| |
| |
| |
| |
| |
|
Gene: SH3GLB2 |
Gene summary for SH3GLB2 |
| Gene information | Species | Human | Gene symbol | SH3GLB2 | Gene ID | 56904 |
| Gene name | SH3 domain containing GRB2 like, endophilin B2 | |
| Gene Alias | PP6569 | |
| Cytomap | 9q34.11 | |
| Gene Type | protein-coding | GO ID | GO:0005575 | UniProtAcc | Q9NR46 |
Top |
Malignant transformation analysis |
| Identification of the aberrant gene expression in precancerous and cancerous lesions by comparing the gene expression of stem-like cells in diseased tissues with normal stem cells |
| Entrez ID | Symbol | Replicates | Species | Organ | Tissue | Adj P-value | Log2FC | Malignancy |
| 56904 | SH3GLB2 | HTA11_3410_2000001011 | Human | Colorectum | AD | 9.29e-03 | 9.54e-02 | 0.0155 |
| 56904 | SH3GLB2 | HTA11_2487_2000001011 | Human | Colorectum | SER | 1.26e-04 | 2.24e-01 | -0.1808 |
| 56904 | SH3GLB2 | HTA11_1938_2000001011 | Human | Colorectum | AD | 1.53e-09 | 3.76e-01 | -0.0811 |
| 56904 | SH3GLB2 | HTA11_347_2000001011 | Human | Colorectum | AD | 2.33e-13 | 3.43e-01 | -0.1954 |
| 56904 | SH3GLB2 | HTA11_411_2000001011 | Human | Colorectum | SER | 4.42e-05 | 5.86e-01 | -0.2602 |
| 56904 | SH3GLB2 | HTA11_83_2000001011 | Human | Colorectum | SER | 2.40e-05 | 3.33e-01 | -0.1526 |
| 56904 | SH3GLB2 | HTA11_696_2000001011 | Human | Colorectum | AD | 1.35e-02 | 2.73e-01 | -0.1464 |
| 56904 | SH3GLB2 | HTA11_866_2000001011 | Human | Colorectum | AD | 3.89e-03 | 2.27e-01 | -0.1001 |
| 56904 | SH3GLB2 | HTA11_1391_2000001011 | Human | Colorectum | AD | 5.80e-10 | 3.72e-01 | -0.059 |
| 56904 | SH3GLB2 | HTA11_866_3004761011 | Human | Colorectum | AD | 9.71e-03 | 9.62e-02 | 0.096 |
| 56904 | SH3GLB2 | HTA11_9408_2000001011 | Human | Colorectum | AD | 1.46e-02 | 4.53e-01 | 0.0451 |
| 56904 | SH3GLB2 | HTA11_7663_2000001011 | Human | Colorectum | SER | 4.97e-02 | 3.22e-01 | 0.0131 |
| 56904 | SH3GLB2 | HTA11_10623_2000001011 | Human | Colorectum | AD | 4.12e-08 | 3.85e-01 | -0.0177 |
| 56904 | SH3GLB2 | HTA11_7696_3000711011 | Human | Colorectum | AD | 2.30e-02 | 1.20e-01 | 0.0674 |
| 56904 | SH3GLB2 | HTA11_99999965062_69753 | Human | Colorectum | MSI-H | 1.69e-02 | 7.16e-01 | 0.3487 |
| 56904 | SH3GLB2 | HTA11_99999971662_82457 | Human | Colorectum | MSS | 2.70e-02 | 3.34e-01 | 0.3859 |
| 56904 | SH3GLB2 | A015-C-203 | Human | Colorectum | FAP | 5.13e-03 | 3.13e-01 | -0.1294 |
| 56904 | SH3GLB2 | LZE7T | Human | Esophagus | ESCC | 1.48e-03 | 1.50e-01 | 0.0667 |
| 56904 | SH3GLB2 | LZE20T | Human | Esophagus | ESCC | 4.39e-06 | 3.09e-01 | 0.0662 |
| 56904 | SH3GLB2 | LZE24T | Human | Esophagus | ESCC | 4.38e-11 | 9.66e-02 | 0.0596 |
| Page: 1 2 3 4 5 6 |
| Tissue | Expression Dynamics | Abbreviation |
| Colorectum (GSE201348) |  | FAP: Familial adenomatous polyposis |
| CRC: Colorectal cancer | ||
| Colorectum (HTA11) |  | AD: Adenomas |
| SER: Sessile serrated lesions | ||
| MSI-H: Microsatellite-high colorectal cancer | ||
| MSS: Microsatellite stable colorectal cancer | ||
| Esophagus | 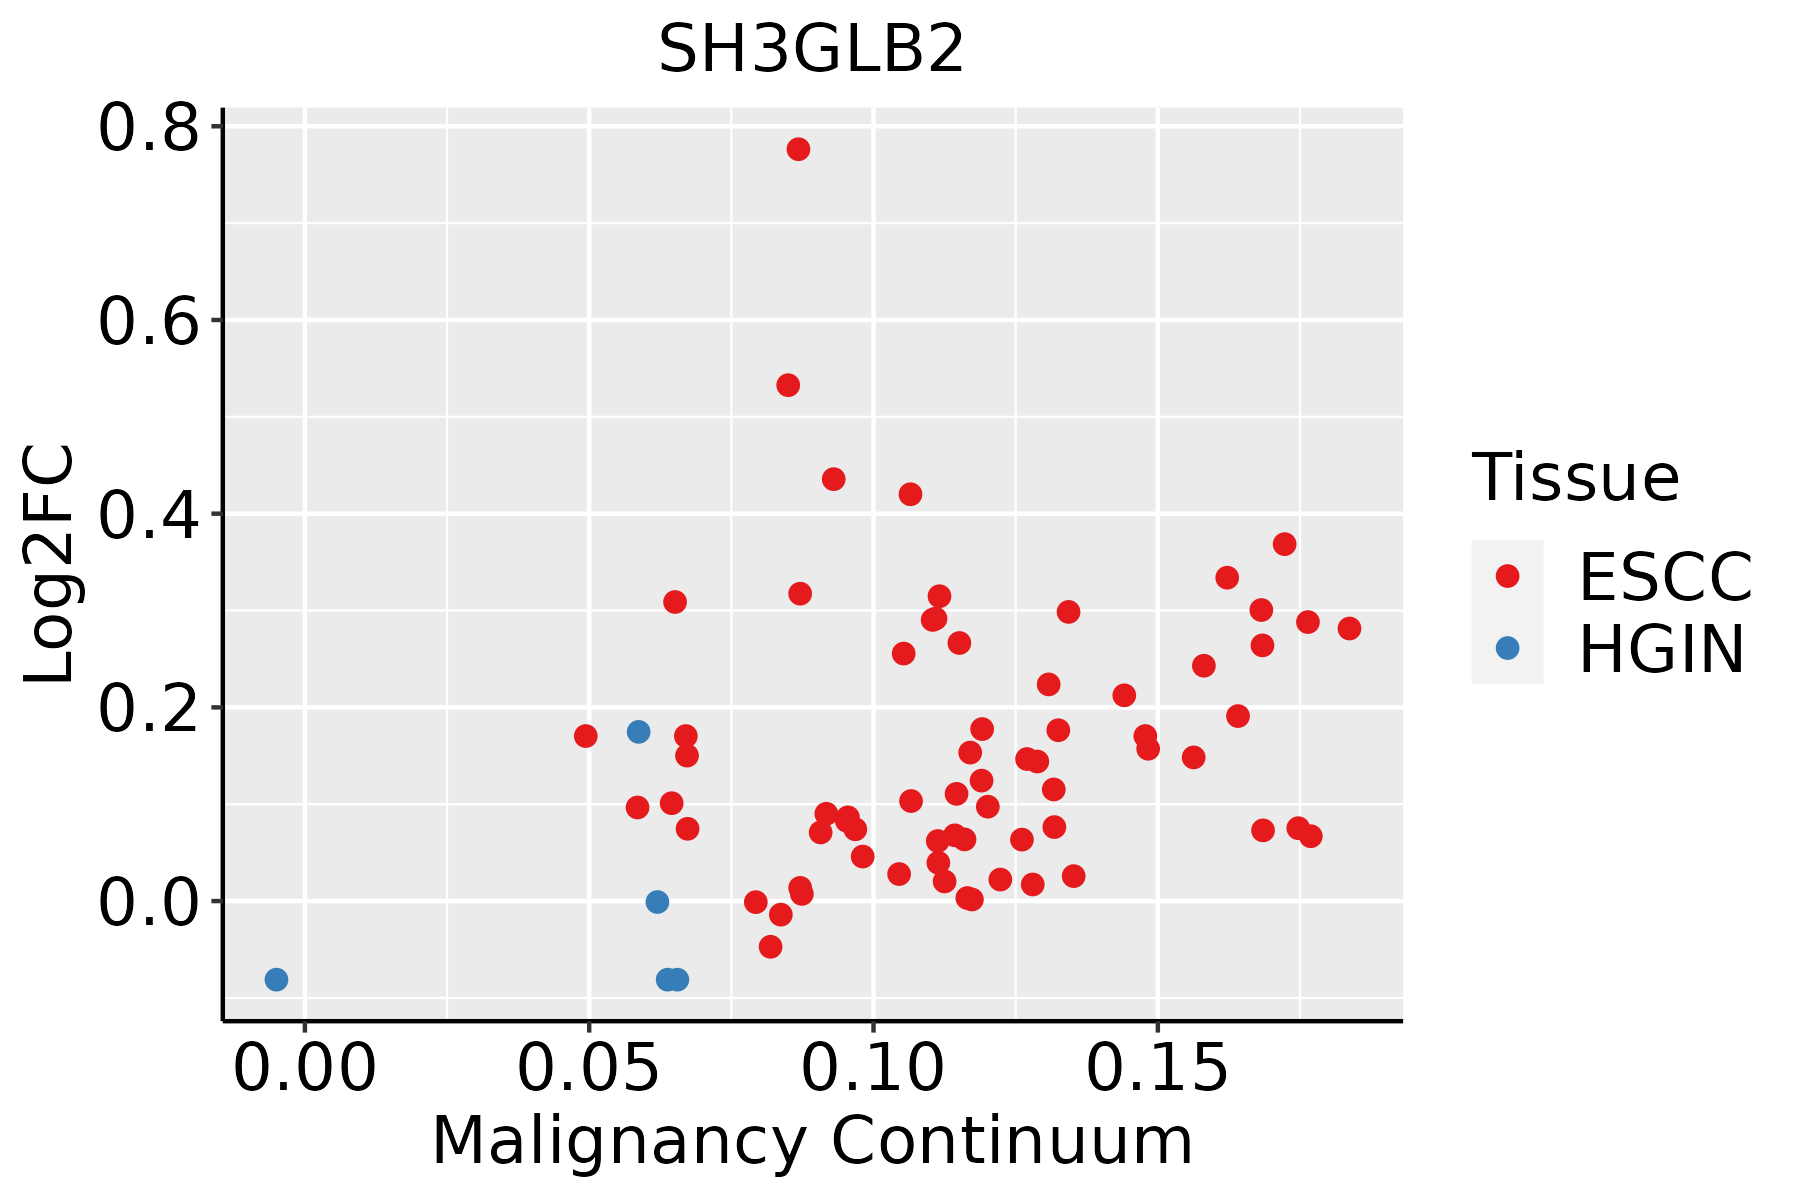 | ESCC: Esophageal squamous cell carcinoma |
| HGIN: High-grade intraepithelial neoplasias | ||
| LGIN: Low-grade intraepithelial neoplasias | ||
| Liver | 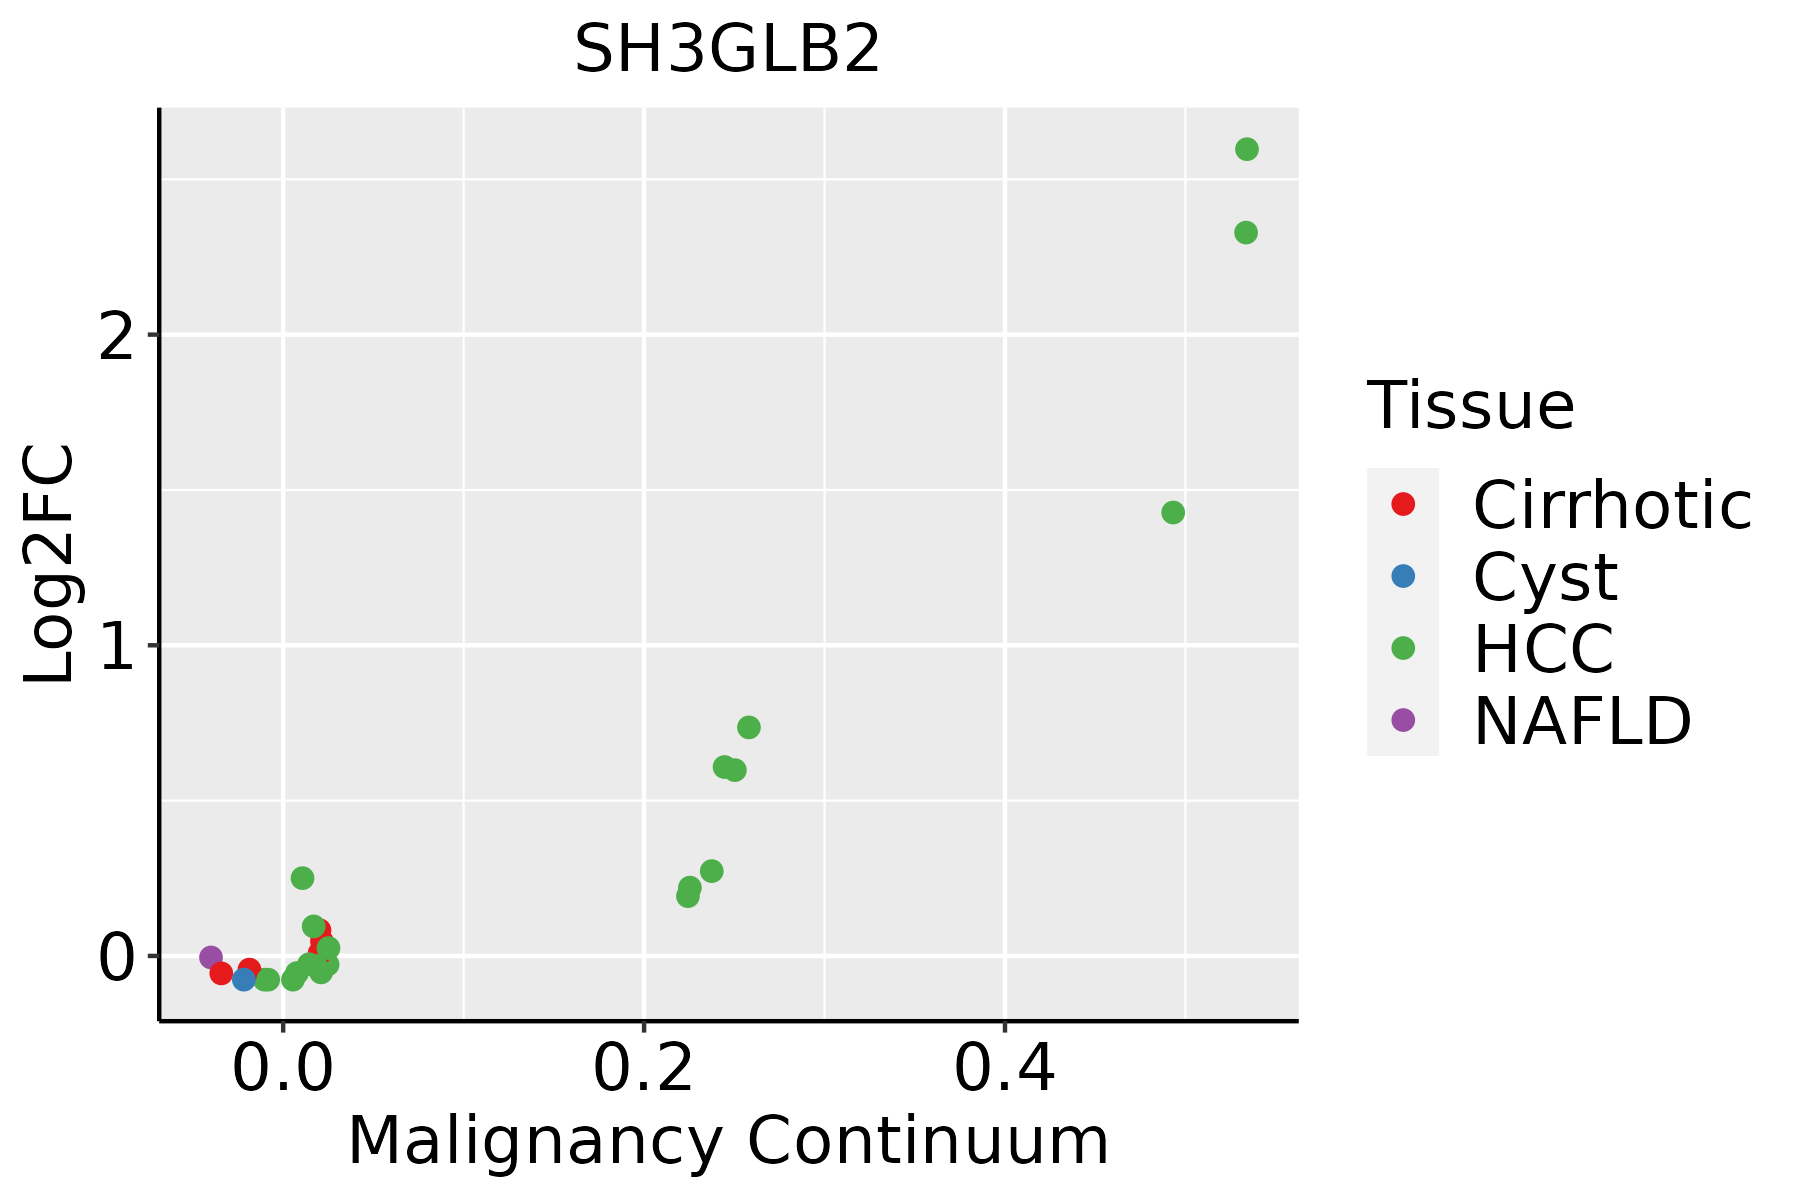 | HCC: Hepatocellular carcinoma |
| NAFLD: Non-alcoholic fatty liver disease | ||
| Oral Cavity | 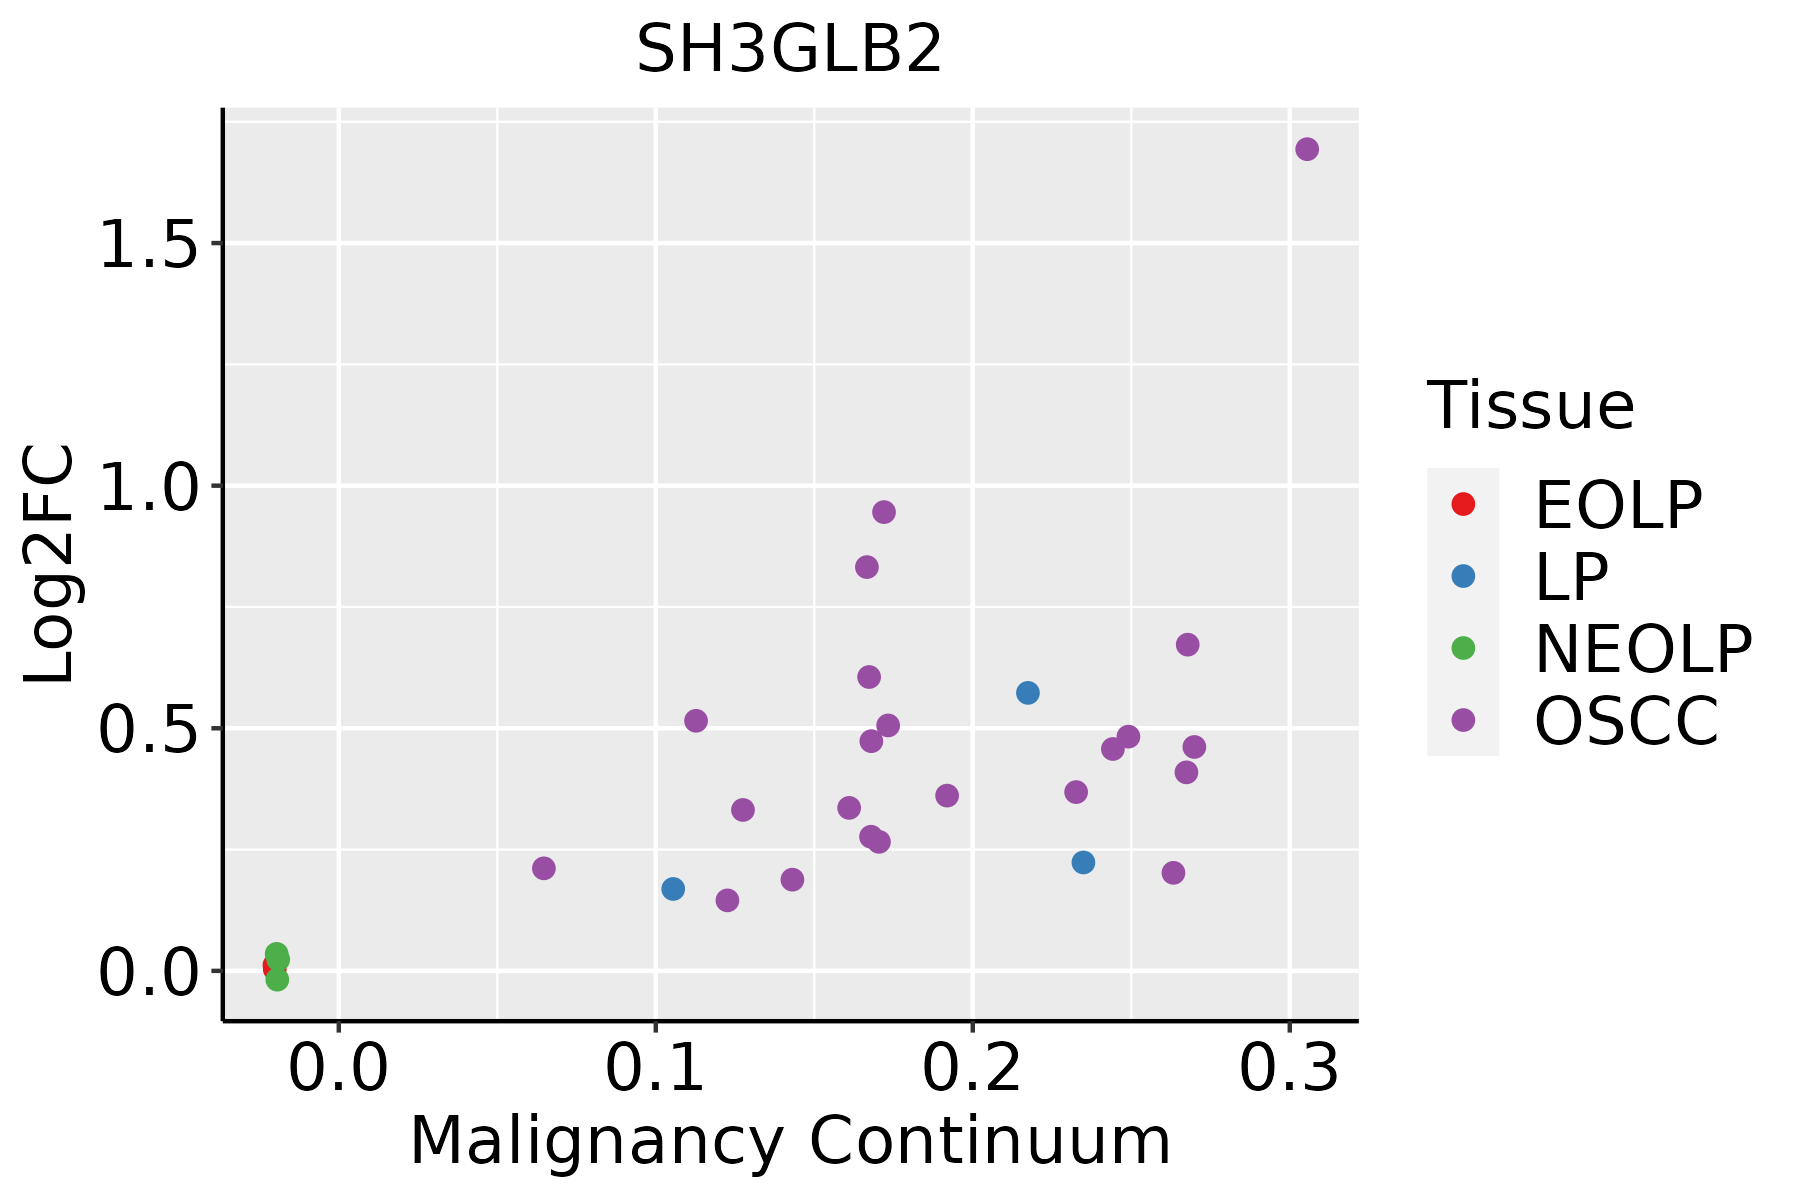 | EOLP: Erosive Oral lichen planus |
| LP: leukoplakia | ||
| NEOLP: Non-erosive oral lichen planus | ||
| OSCC: Oral squamous cell carcinoma | ||
| Thyroid |  | ATC: Anaplastic thyroid cancer |
| HT: Hashimoto's thyroiditis | ||
| PTC: Papillary thyroid cancer |
| ∗log2FC in expression of this searched gene in stem-like cells from each diseased tissue sample relative to stem-like cells in normal samples in each tissue plotted against the malignancy continuum. Samples are colored based on if they are from different disease stage. |
Top |
Malignant transformation related pathway analysis |
| Find out the enriched GO biological processes and KEGG pathways involved in transition from healthy to precancer to cancer |
| Tissue | Disease Stage | Enriched GO biological Processes |
| Colorectum | AD |  |
| Colorectum | SER |  |
| Colorectum | MSS |  |
| Colorectum | MSI-H |  |
| Colorectum | FAP |  |
| ∗Top 15 enriched GO BP terms are showed in the bar plot of each disease state in each tissue. Each row represents a significant GO biological process which is colored according to the -log10(p.adjust). |
| Page: 1 2 3 4 5 6 7 8 9 |
| GO ID | Tissue | Disease Stage | Description | Gene Ratio | Bg Ratio | pvalue | p.adjust | Count |
| Page: 1 |
| Pathway ID | Tissue | Disease Stage | Description | Gene Ratio | Bg Ratio | pvalue | p.adjust | qvalue | Count |
| hsa04144 | Colorectum | AD | Endocytosis | 111/2092 | 251/8465 | 5.95e-12 | 1.42e-10 | 9.08e-11 | 111 |
| hsa041441 | Colorectum | AD | Endocytosis | 111/2092 | 251/8465 | 5.95e-12 | 1.42e-10 | 9.08e-11 | 111 |
| hsa041442 | Colorectum | SER | Endocytosis | 81/1580 | 251/8465 | 1.14e-07 | 2.36e-06 | 1.71e-06 | 81 |
| hsa041443 | Colorectum | SER | Endocytosis | 81/1580 | 251/8465 | 1.14e-07 | 2.36e-06 | 1.71e-06 | 81 |
| hsa041444 | Colorectum | MSS | Endocytosis | 102/1875 | 251/8465 | 1.85e-11 | 4.43e-10 | 2.71e-10 | 102 |
| hsa041445 | Colorectum | MSS | Endocytosis | 102/1875 | 251/8465 | 1.85e-11 | 4.43e-10 | 2.71e-10 | 102 |
| hsa041446 | Colorectum | FAP | Endocytosis | 78/1404 | 251/8465 | 6.20e-09 | 2.96e-07 | 1.80e-07 | 78 |
| hsa041447 | Colorectum | FAP | Endocytosis | 78/1404 | 251/8465 | 6.20e-09 | 2.96e-07 | 1.80e-07 | 78 |
| hsa04144210 | Esophagus | ESCC | Endocytosis | 186/4205 | 251/8465 | 9.74e-16 | 4.66e-14 | 2.39e-14 | 186 |
| hsa0414437 | Esophagus | ESCC | Endocytosis | 186/4205 | 251/8465 | 9.74e-16 | 4.66e-14 | 2.39e-14 | 186 |
| hsa0414422 | Liver | HCC | Endocytosis | 178/4020 | 251/8465 | 2.03e-14 | 5.22e-13 | 2.91e-13 | 178 |
| hsa0414432 | Liver | HCC | Endocytosis | 178/4020 | 251/8465 | 2.03e-14 | 5.22e-13 | 2.91e-13 | 178 |
| hsa0414427 | Oral cavity | OSCC | Endocytosis | 174/3704 | 251/8465 | 9.42e-17 | 4.51e-15 | 2.29e-15 | 174 |
| hsa04144112 | Oral cavity | OSCC | Endocytosis | 174/3704 | 251/8465 | 9.42e-17 | 4.51e-15 | 2.29e-15 | 174 |
| hsa0414428 | Oral cavity | LP | Endocytosis | 121/2418 | 251/8465 | 1.89e-11 | 3.70e-10 | 2.38e-10 | 121 |
| hsa0414436 | Oral cavity | LP | Endocytosis | 121/2418 | 251/8465 | 1.89e-11 | 3.70e-10 | 2.38e-10 | 121 |
| Page: 1 |
Top |
Cell-cell communication analysis |
| Identification of potential cell-cell interactions between two cell types and their ligand-receptor pairs for different disease states |
| Ligand | Receptor | LRpair | Pathway | Tissue | Disease Stage |
| Page: 1 |
Top |
Single-cell gene regulatory network inference analysis |
| Find out the significant the regulons (TFs) and the target genes of each regulon across cell types for different disease states |
| TF | Cell Type | Tissue | Disease Stage | Target Gene | RSS | Regulon Activity |
| ∗The dot plots of a searched regulon are shown for all cell subpopulations in each disease state of each tissue based on the regulon specific score inferred using pySCENIC and by calculating the average expression. |
| Page: 1 |
Top |
Somatic mutation of malignant transformation related genes |
| Annotation of somatic variants for genes involved in malignant transformation |
| Hugo Symbol | Variant Class | Variant Classification | dbSNP RS | HGVSc | HGVSp | HGVSp Short | SWISSPROT | BIOTYPE | SIFT | PolyPhen | Tumor Sample Barcode | Tissue | Histology | Sex | Age | Stage | Therapy Types | Drugs | Outcome |
| SH3GLB2 | SNV | Missense_Mutation | novel | c.150N>T | p.Lys50Asn | p.K50N | Q9NR46 | protein_coding | deleterious(0.02) | probably_damaging(0.988) | TCGA-AN-A046-01 | Breast | breast invasive carcinoma | Female | >=65 | I/II | Unknown | Unknown | SD |
| SH3GLB2 | SNV | Missense_Mutation | c.605G>T | p.Arg202Leu | p.R202L | Q9NR46 | protein_coding | tolerated(0.08) | probably_damaging(0.999) | TCGA-GM-A2DB-01 | Breast | breast invasive carcinoma | Female | <65 | I/II | Chemotherapy | taxol | CR | |
| SH3GLB2 | SNV | Missense_Mutation | novel | c.64T>C | p.Phe22Leu | p.F22L | Q9NR46 | protein_coding | tolerated(0.34) | possibly_damaging(0.539) | TCGA-S3-AA10-01 | Breast | breast invasive carcinoma | Female | >=65 | I/II | Chemotherapy | cytoxan | CR |
| SH3GLB2 | SNV | Missense_Mutation | c.165N>T | p.Lys55Asn | p.K55N | Q9NR46 | protein_coding | deleterious(0.01) | possibly_damaging(0.697) | TCGA-A6-5661-01 | Colorectum | colon adenocarcinoma | Female | >=65 | I/II | Unknown | Unknown | SD | |
| SH3GLB2 | SNV | Missense_Mutation | c.433N>T | p.Arg145Cys | p.R145C | Q9NR46 | protein_coding | deleterious(0) | probably_damaging(0.999) | TCGA-A6-5665-01 | Colorectum | colon adenocarcinoma | Female | >=65 | I/II | Unknown | Unknown | PD | |
| SH3GLB2 | SNV | Missense_Mutation | novel | c.320C>A | p.Pro107Gln | p.P107Q | Q9NR46 | protein_coding | tolerated(0.13) | possibly_damaging(0.779) | TCGA-AA-3950-01 | Colorectum | colon adenocarcinoma | Female | >=65 | I/II | Unknown | Unknown | SD |
| SH3GLB2 | SNV | Missense_Mutation | rs774874088 | c.133N>T | p.Arg45Trp | p.R45W | Q9NR46 | protein_coding | deleterious(0) | probably_damaging(1) | TCGA-QG-A5Z2-01 | Colorectum | colon adenocarcinoma | Male | <65 | I/II | Unknown | Unknown | SD |
| SH3GLB2 | SNV | Missense_Mutation | c.433C>T | p.Arg145Cys | p.R145C | Q9NR46 | protein_coding | deleterious(0) | probably_damaging(0.999) | TCGA-EI-6881-01 | Colorectum | rectum adenocarcinoma | Male | <65 | III/IV | Chemotherapy | 5 | SD | |
| SH3GLB2 | SNV | Missense_Mutation | c.901N>A | p.Ala301Thr | p.A301T | Q9NR46 | protein_coding | tolerated(0.78) | benign(0.003) | TCGA-EI-6882-01 | Colorectum | rectum adenocarcinoma | Male | <65 | I/II | Unknown | Unknown | SD | |
| SH3GLB2 | SNV | Missense_Mutation | c.434N>A | p.Arg145His | p.R145H | Q9NR46 | protein_coding | deleterious(0.02) | probably_damaging(0.999) | TCGA-AP-A051-01 | Endometrium | uterine corpus endometrioid carcinoma | Female | >=65 | I/II | Unknown | Unknown | SD |
| Page: 1 2 3 |
Top |
Related drugs of malignant transformation related genes |
| Identification of chemicals and drugs interact with genes involved in malignant transfromation |
| (DGIdb 4.0) |
| Entrez ID | Symbol | Category | Interaction Types | Drug Claim Name | Drug Name | PMIDs |
| Page: 1 |

Copyright 2023-Present -The University of Texas Health Science Center at Houston |