
|
|||||
|
 | |
| |
| |
| |
| |
| |
|
Gene: SH3GL1 |
Gene summary for SH3GL1 |
| Gene information | Species | Human | Gene symbol | SH3GL1 | Gene ID | 6455 |
| Gene name | SH3 domain containing GRB2 like 1, endophilin A2 | |
| Gene Alias | CNSA1 | |
| Cytomap | 19p13.3 | |
| Gene Type | protein-coding | GO ID | GO:0003008 | UniProtAcc | Q99961 |
Top |
Malignant transformation analysis |
| Identification of the aberrant gene expression in precancerous and cancerous lesions by comparing the gene expression of stem-like cells in diseased tissues with normal stem cells |
| Entrez ID | Symbol | Replicates | Species | Organ | Tissue | Adj P-value | Log2FC | Malignancy |
| 6455 | SH3GL1 | LZE2T | Human | Esophagus | ESCC | 1.31e-03 | 2.41e-01 | 0.082 |
| 6455 | SH3GL1 | LZE4T | Human | Esophagus | ESCC | 2.81e-04 | 2.01e-02 | 0.0811 |
| 6455 | SH3GL1 | LZE7T | Human | Esophagus | ESCC | 9.27e-05 | 1.10e-01 | 0.0667 |
| 6455 | SH3GL1 | LZE8T | Human | Esophagus | ESCC | 3.62e-02 | -3.56e-02 | 0.067 |
| 6455 | SH3GL1 | LZE20T | Human | Esophagus | ESCC | 4.99e-06 | 8.65e-02 | 0.0662 |
| 6455 | SH3GL1 | LZE22T | Human | Esophagus | ESCC | 3.20e-02 | 1.87e-01 | 0.068 |
| 6455 | SH3GL1 | LZE24T | Human | Esophagus | ESCC | 7.40e-11 | 3.23e-01 | 0.0596 |
| 6455 | SH3GL1 | P2T-E | Human | Esophagus | ESCC | 5.31e-18 | 1.92e-01 | 0.1177 |
| 6455 | SH3GL1 | P4T-E | Human | Esophagus | ESCC | 9.76e-21 | 2.88e-01 | 0.1323 |
| 6455 | SH3GL1 | P5T-E | Human | Esophagus | ESCC | 4.37e-13 | 5.98e-02 | 0.1327 |
| 6455 | SH3GL1 | P8T-E | Human | Esophagus | ESCC | 4.78e-26 | 5.79e-01 | 0.0889 |
| 6455 | SH3GL1 | P9T-E | Human | Esophagus | ESCC | 7.17e-17 | 2.11e-01 | 0.1131 |
| 6455 | SH3GL1 | P10T-E | Human | Esophagus | ESCC | 2.85e-27 | 5.78e-01 | 0.116 |
| 6455 | SH3GL1 | P11T-E | Human | Esophagus | ESCC | 7.68e-13 | 4.75e-01 | 0.1426 |
| 6455 | SH3GL1 | P12T-E | Human | Esophagus | ESCC | 1.07e-14 | 2.73e-01 | 0.1122 |
| 6455 | SH3GL1 | P15T-E | Human | Esophagus | ESCC | 9.25e-19 | 3.96e-01 | 0.1149 |
| 6455 | SH3GL1 | P16T-E | Human | Esophagus | ESCC | 9.38e-15 | 2.60e-01 | 0.1153 |
| 6455 | SH3GL1 | P17T-E | Human | Esophagus | ESCC | 3.06e-11 | 5.24e-01 | 0.1278 |
| 6455 | SH3GL1 | P19T-E | Human | Esophagus | ESCC | 9.40e-07 | 7.98e-01 | 0.1662 |
| 6455 | SH3GL1 | P20T-E | Human | Esophagus | ESCC | 4.21e-07 | 1.98e-01 | 0.1124 |
| Page: 1 2 3 4 5 6 |
| Tissue | Expression Dynamics | Abbreviation |
| Esophagus |  | ESCC: Esophageal squamous cell carcinoma |
| HGIN: High-grade intraepithelial neoplasias | ||
| LGIN: Low-grade intraepithelial neoplasias | ||
| Liver | 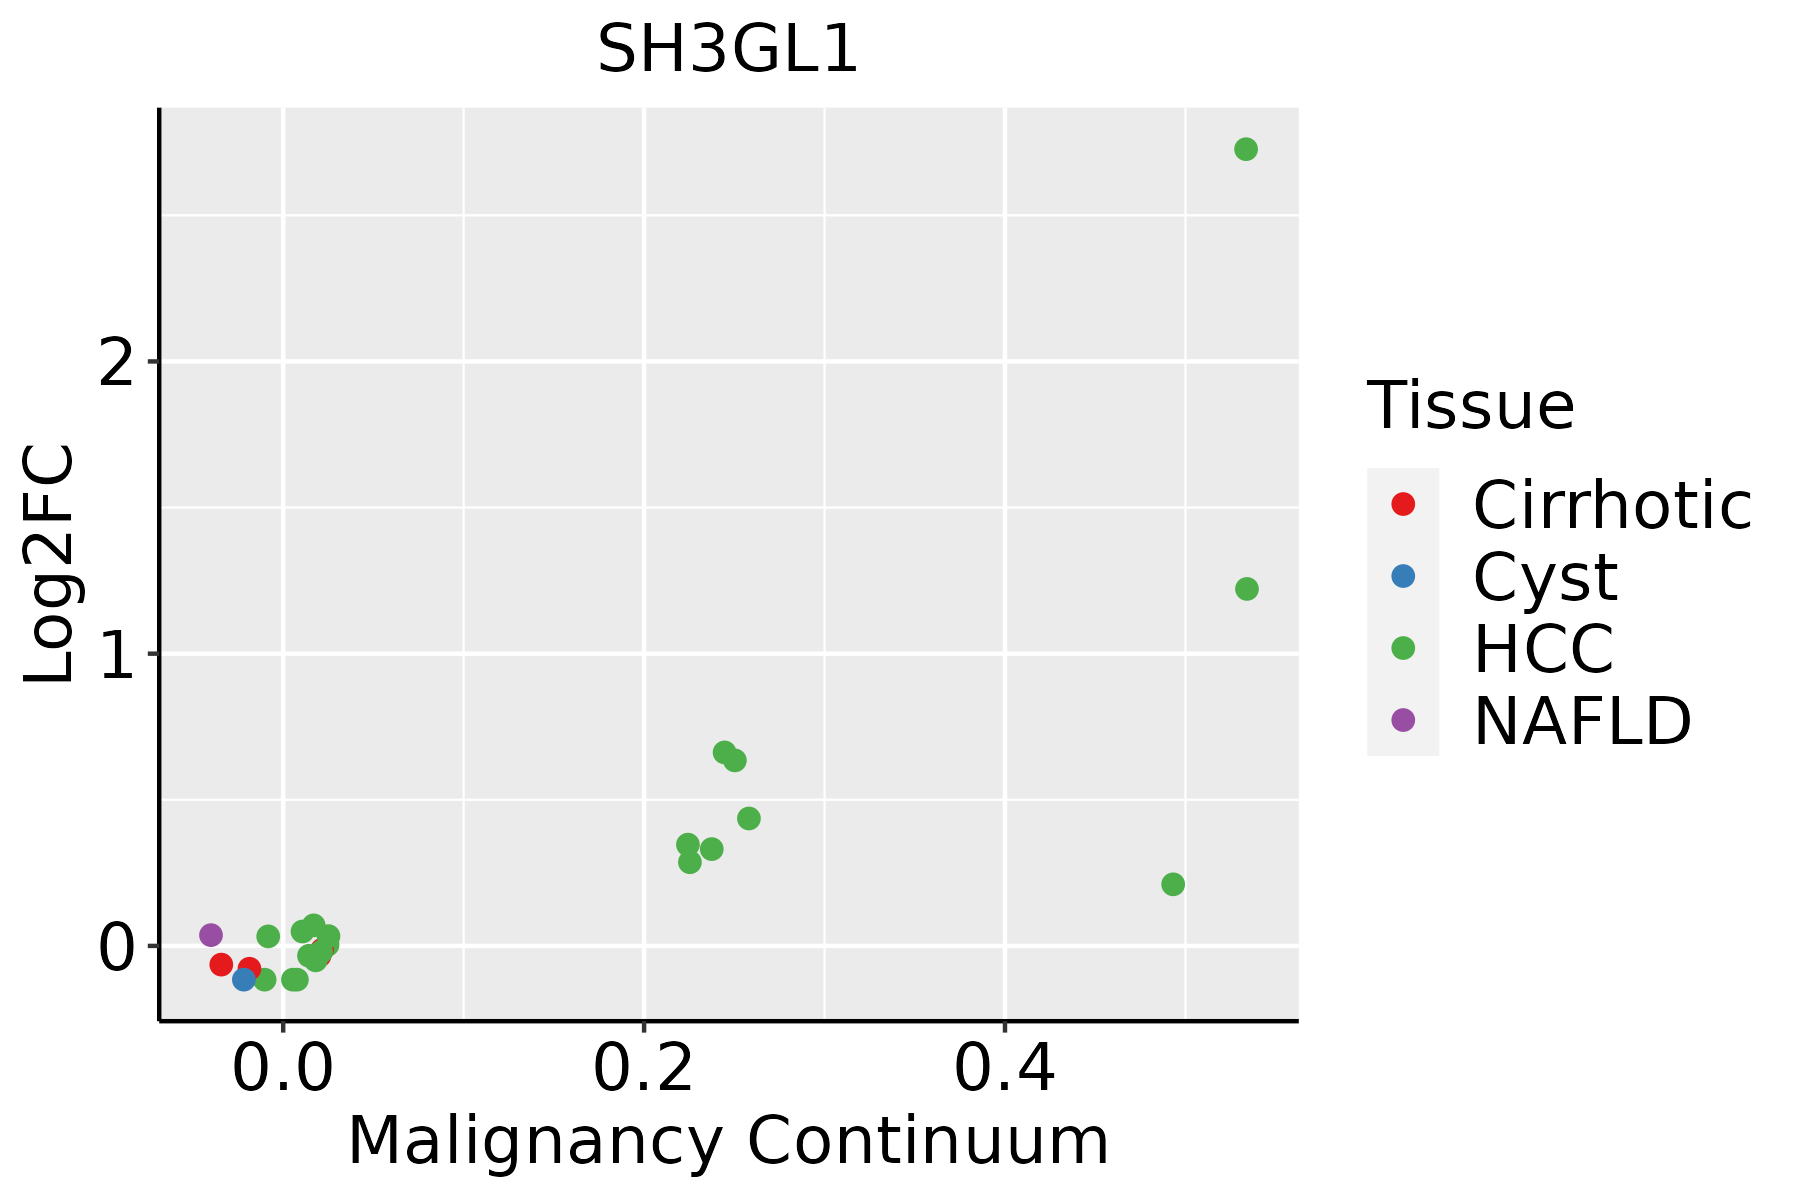 | HCC: Hepatocellular carcinoma |
| NAFLD: Non-alcoholic fatty liver disease | ||
| Oral Cavity | 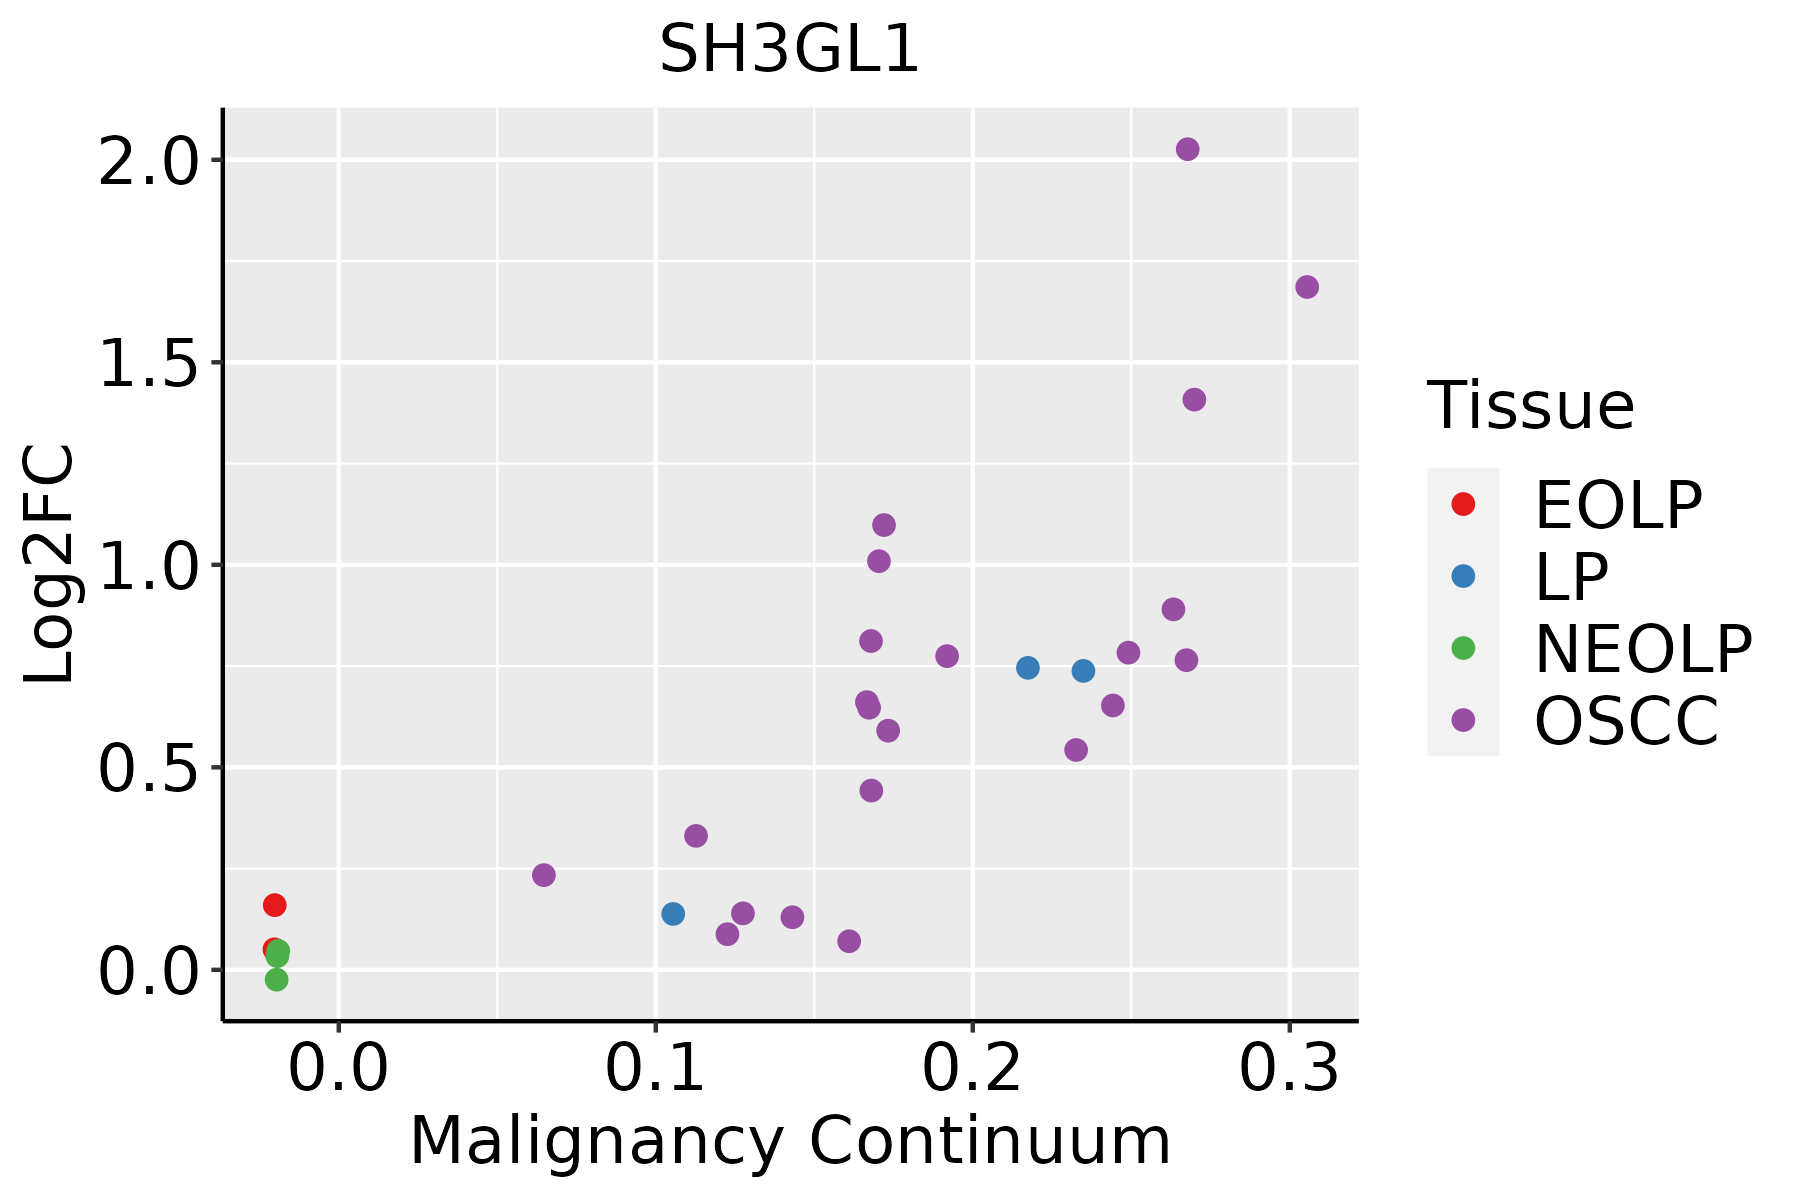 | EOLP: Erosive Oral lichen planus |
| LP: leukoplakia | ||
| NEOLP: Non-erosive oral lichen planus | ||
| OSCC: Oral squamous cell carcinoma | ||
| Skin | 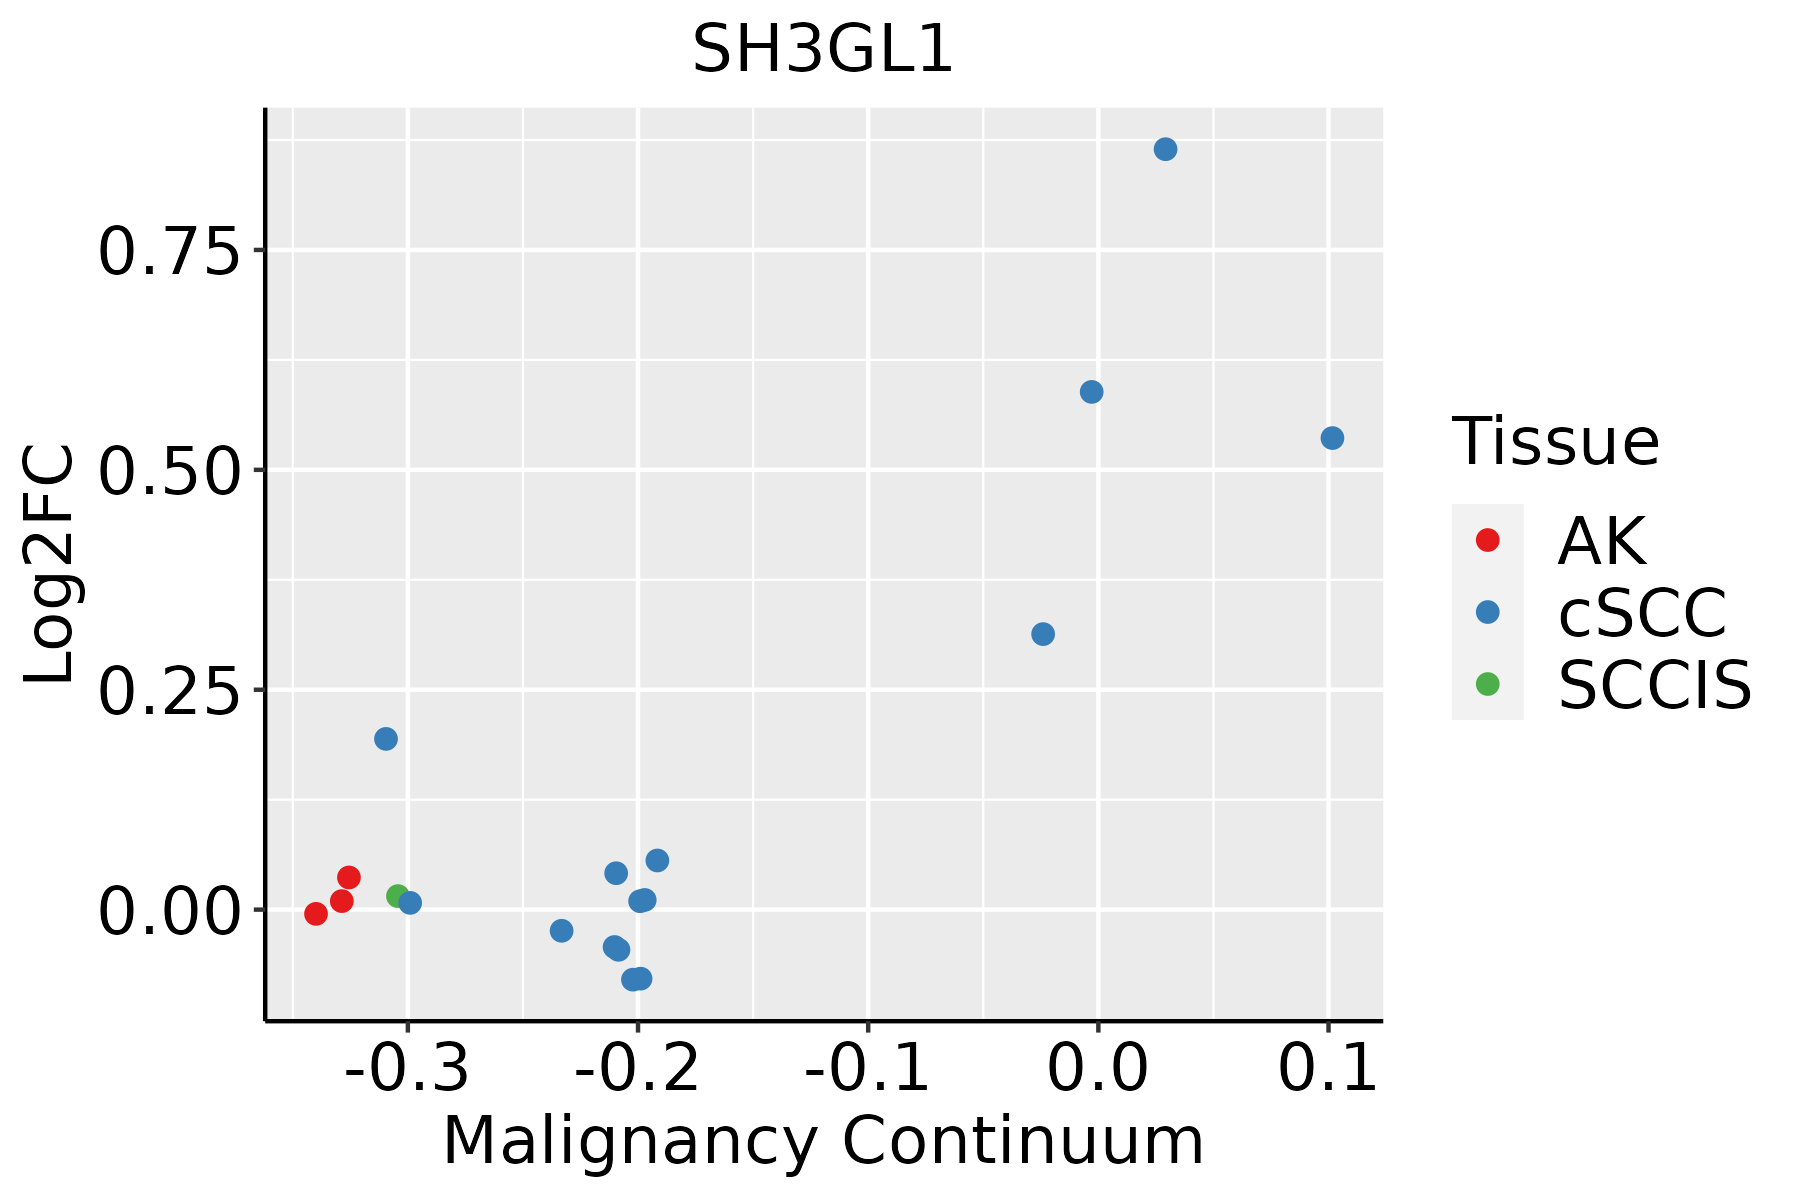 | AK: Actinic keratosis |
| cSCC: Cutaneous squamous cell carcinoma | ||
| SCCIS:squamous cell carcinoma in situ | ||
| Thyroid | 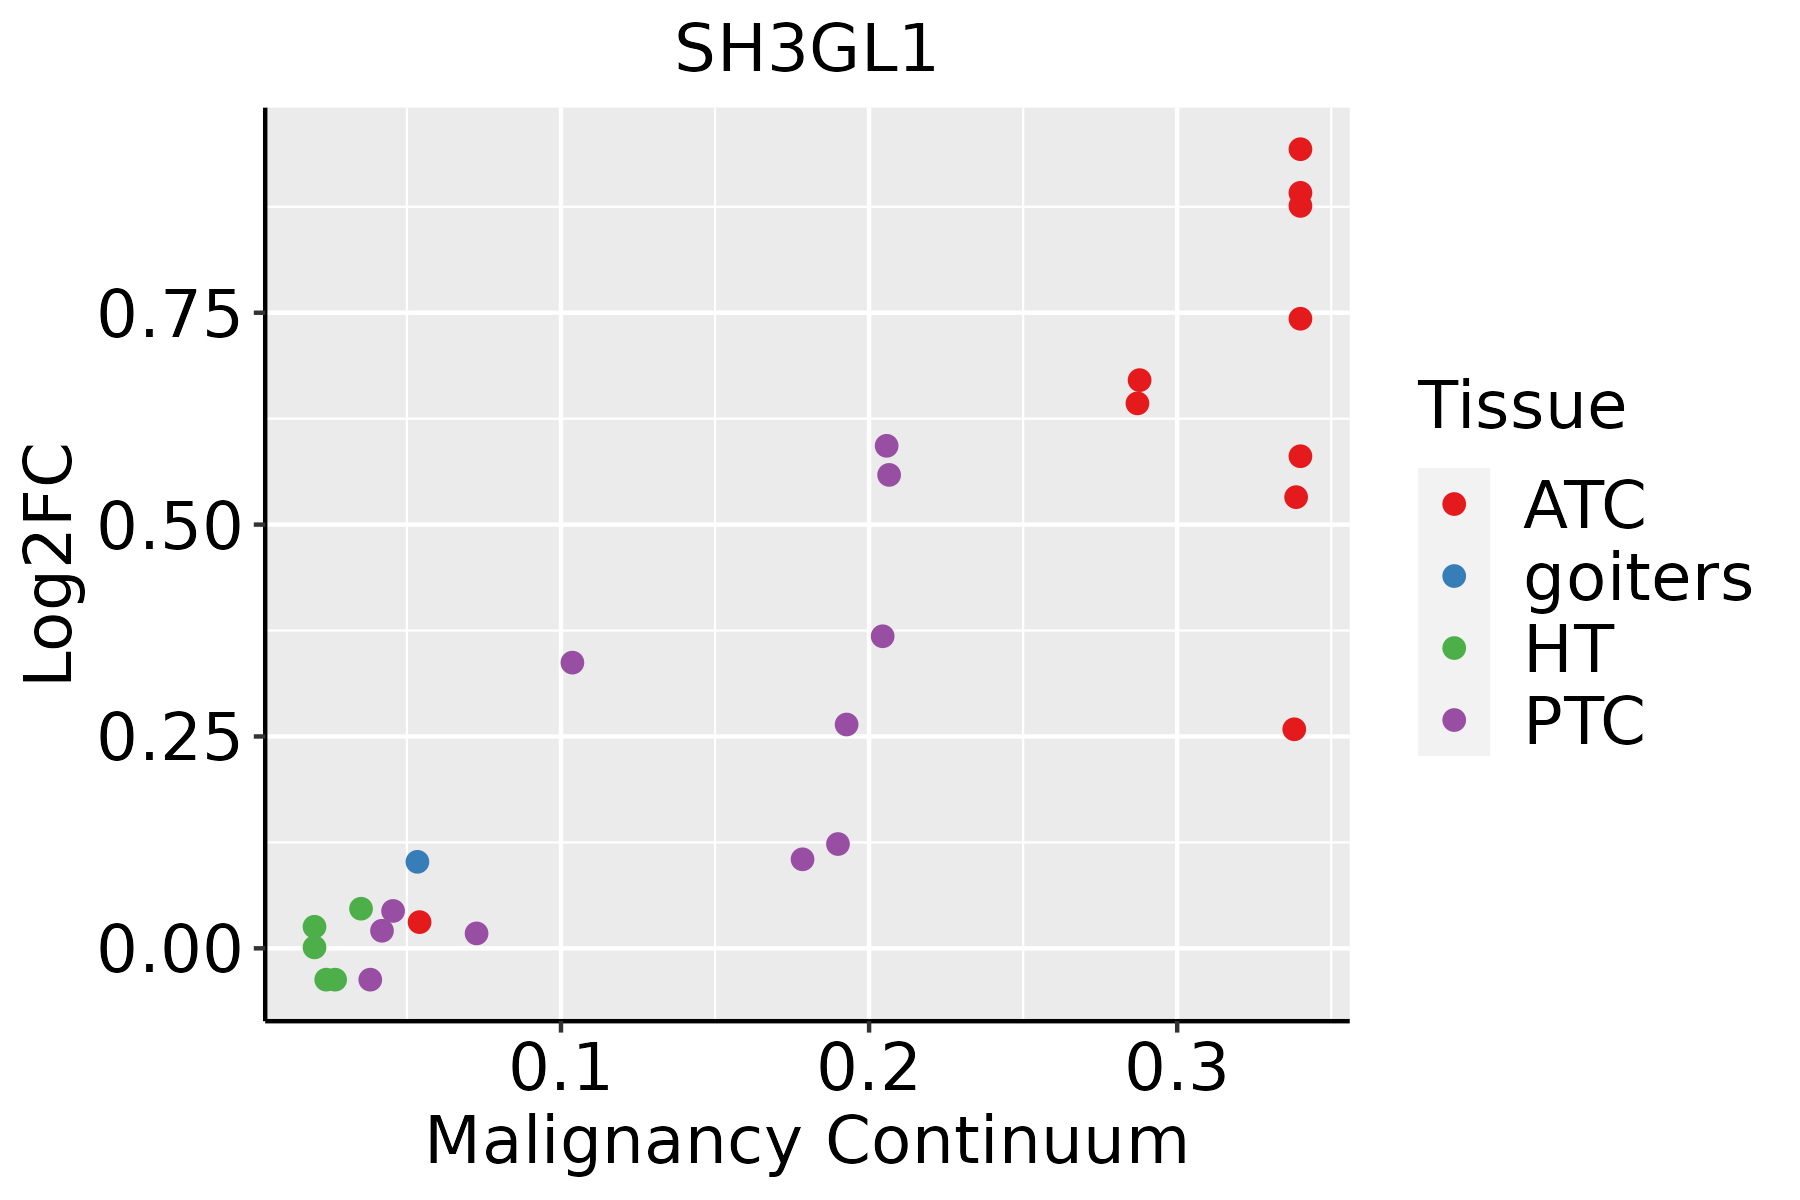 | ATC: Anaplastic thyroid cancer |
| HT: Hashimoto's thyroiditis | ||
| PTC: Papillary thyroid cancer |
| ∗log2FC in expression of this searched gene in stem-like cells from each diseased tissue sample relative to stem-like cells in normal samples in each tissue plotted against the malignancy continuum. Samples are colored based on if they are from different disease stage. |
Top |
Malignant transformation related pathway analysis |
| Find out the enriched GO biological processes and KEGG pathways involved in transition from healthy to precancer to cancer |
| Tissue | Disease Stage | Enriched GO biological Processes |
| Colorectum | AD |  |
| Colorectum | SER |  |
| Colorectum | MSS |  |
| Colorectum | MSI-H |  |
| Colorectum | FAP |  |
| ∗Top 15 enriched GO BP terms are showed in the bar plot of each disease state in each tissue. Each row represents a significant GO biological process which is colored according to the -log10(p.adjust). |
| Page: 1 2 3 4 5 6 7 8 9 |
| GO ID | Tissue | Disease Stage | Description | Gene Ratio | Bg Ratio | pvalue | p.adjust | Count |
| GO:0022411111 | Esophagus | ESCC | cellular component disassembly | 305/8552 | 443/18723 | 1.94e-23 | 4.57e-21 | 305 |
| GO:003298416 | Esophagus | ESCC | protein-containing complex disassembly | 151/8552 | 224/18723 | 3.45e-11 | 1.15e-09 | 151 |
| GO:003010018 | Esophagus | ESCC | regulation of endocytosis | 135/8552 | 211/18723 | 5.75e-08 | 1.02e-06 | 135 |
| GO:004580718 | Esophagus | ESCC | positive regulation of endocytosis | 69/8552 | 100/18723 | 1.97e-06 | 2.29e-05 | 69 |
| GO:00436245 | Esophagus | ESCC | cellular protein complex disassembly | 78/8552 | 136/18723 | 4.00e-03 | 1.62e-02 | 78 |
| GO:002241112 | Liver | HCC | cellular component disassembly | 282/7958 | 443/18723 | 1.02e-19 | 1.38e-17 | 282 |
| GO:003298411 | Liver | HCC | protein-containing complex disassembly | 138/7958 | 224/18723 | 5.59e-09 | 1.46e-07 | 138 |
| GO:003010021 | Liver | HCC | regulation of endocytosis | 117/7958 | 211/18723 | 9.56e-05 | 8.32e-04 | 117 |
| GO:004580721 | Liver | HCC | positive regulation of endocytosis | 59/7958 | 100/18723 | 6.35e-04 | 3.93e-03 | 59 |
| GO:00436242 | Liver | HCC | cellular protein complex disassembly | 71/7958 | 136/18723 | 1.39e-02 | 4.95e-02 | 71 |
| GO:002241119 | Oral cavity | OSCC | cellular component disassembly | 283/7305 | 443/18723 | 9.57e-27 | 3.37e-24 | 283 |
| GO:003298410 | Oral cavity | OSCC | protein-containing complex disassembly | 136/7305 | 224/18723 | 3.42e-11 | 1.13e-09 | 136 |
| GO:003010016 | Oral cavity | OSCC | regulation of endocytosis | 121/7305 | 211/18723 | 4.74e-08 | 8.80e-07 | 121 |
| GO:004580710 | Oral cavity | OSCC | positive regulation of endocytosis | 59/7305 | 100/18723 | 3.99e-05 | 3.48e-04 | 59 |
| GO:1903421 | Oral cavity | OSCC | regulation of synaptic vesicle recycling | 18/7305 | 27/18723 | 3.34e-03 | 1.42e-02 | 18 |
| GO:00436244 | Oral cavity | OSCC | cellular protein complex disassembly | 68/7305 | 136/18723 | 5.84e-03 | 2.24e-02 | 68 |
| GO:0022411110 | Oral cavity | LP | cellular component disassembly | 173/4623 | 443/18723 | 9.97e-12 | 7.44e-10 | 173 |
| GO:003010017 | Oral cavity | LP | regulation of endocytosis | 81/4623 | 211/18723 | 6.57e-06 | 1.29e-04 | 81 |
| GO:003298414 | Oral cavity | LP | protein-containing complex disassembly | 83/4623 | 224/18723 | 2.38e-05 | 3.86e-04 | 83 |
| GO:004580717 | Oral cavity | LP | positive regulation of endocytosis | 36/4623 | 100/18723 | 7.54e-03 | 4.16e-02 | 36 |
| Page: 1 2 3 |
| Pathway ID | Tissue | Disease Stage | Description | Gene Ratio | Bg Ratio | pvalue | p.adjust | qvalue | Count |
| hsa04144210 | Esophagus | ESCC | Endocytosis | 186/4205 | 251/8465 | 9.74e-16 | 4.66e-14 | 2.39e-14 | 186 |
| hsa0414437 | Esophagus | ESCC | Endocytosis | 186/4205 | 251/8465 | 9.74e-16 | 4.66e-14 | 2.39e-14 | 186 |
| hsa0414422 | Liver | HCC | Endocytosis | 178/4020 | 251/8465 | 2.03e-14 | 5.22e-13 | 2.91e-13 | 178 |
| hsa0414432 | Liver | HCC | Endocytosis | 178/4020 | 251/8465 | 2.03e-14 | 5.22e-13 | 2.91e-13 | 178 |
| hsa0414427 | Oral cavity | OSCC | Endocytosis | 174/3704 | 251/8465 | 9.42e-17 | 4.51e-15 | 2.29e-15 | 174 |
| hsa04144112 | Oral cavity | OSCC | Endocytosis | 174/3704 | 251/8465 | 9.42e-17 | 4.51e-15 | 2.29e-15 | 174 |
| hsa0414428 | Oral cavity | LP | Endocytosis | 121/2418 | 251/8465 | 1.89e-11 | 3.70e-10 | 2.38e-10 | 121 |
| hsa0414436 | Oral cavity | LP | Endocytosis | 121/2418 | 251/8465 | 1.89e-11 | 3.70e-10 | 2.38e-10 | 121 |
| hsa0414442 | Oral cavity | EOLP | Endocytosis | 71/1218 | 251/8465 | 5.28e-09 | 8.97e-08 | 5.29e-08 | 71 |
| hsa0414452 | Oral cavity | EOLP | Endocytosis | 71/1218 | 251/8465 | 5.28e-09 | 8.97e-08 | 5.29e-08 | 71 |
| Page: 1 |
Top |
Cell-cell communication analysis |
| Identification of potential cell-cell interactions between two cell types and their ligand-receptor pairs for different disease states |
| Ligand | Receptor | LRpair | Pathway | Tissue | Disease Stage |
| Page: 1 |
Top |
Single-cell gene regulatory network inference analysis |
| Find out the significant the regulons (TFs) and the target genes of each regulon across cell types for different disease states |
| TF | Cell Type | Tissue | Disease Stage | Target Gene | RSS | Regulon Activity |
| ∗The dot plots of a searched regulon are shown for all cell subpopulations in each disease state of each tissue based on the regulon specific score inferred using pySCENIC and by calculating the average expression. |
| Page: 1 |
Top |
Somatic mutation of malignant transformation related genes |
| Annotation of somatic variants for genes involved in malignant transformation |
| Hugo Symbol | Variant Class | Variant Classification | dbSNP RS | HGVSc | HGVSp | HGVSp Short | SWISSPROT | BIOTYPE | SIFT | PolyPhen | Tumor Sample Barcode | Tissue | Histology | Sex | Age | Stage | Therapy Types | Drugs | Outcome |
| SH3GL1 | SNV | Missense_Mutation | novel | c.228N>T | p.Lys76Asn | p.K76N | Q99961 | protein_coding | deleterious(0) | probably_damaging(0.99) | TCGA-AN-A046-01 | Breast | breast invasive carcinoma | Female | >=65 | I/II | Unknown | Unknown | SD |
| SH3GL1 | insertion | Frame_Shift_Ins | novel | c.77_78insTAAGGACTTATCTCCAGAAAAGAAC | p.Thr27LysfsTer13 | p.T27Kfs*13 | Q99961 | protein_coding | TCGA-AN-A0FX-01 | Breast | breast invasive carcinoma | Female | <65 | I/II | Unknown | Unknown | SD | ||
| SH3GL1 | SNV | Missense_Mutation | novel | c.846N>C | p.Lys282Asn | p.K282N | Q99961 | protein_coding | tolerated(0.3) | benign(0.066) | TCGA-C5-A1M7-01 | Cervix | cervical & endocervical cancer | Female | <65 | I/II | Unknown | Unknown | SD |
| SH3GL1 | SNV | Missense_Mutation | rs765879947 | c.888C>G | p.Ile296Met | p.I296M | Q99961 | protein_coding | tolerated(0.39) | benign(0.013) | TCGA-JW-A5VL-01 | Cervix | cervical & endocervical cancer | Female | <65 | I/II | Unknown | Unknown | SD |
| SH3GL1 | deletion | In_Frame_Del | novel | c.712_714delNNN | p.Glu238del | p.E238del | Q99961 | protein_coding | TCGA-FU-A3HZ-01 | Cervix | cervical & endocervical cancer | Female | <65 | I/II | Chemotherapy | cisplatin | CR | ||
| SH3GL1 | SNV | Missense_Mutation | c.161N>T | p.Thr54Ile | p.T54I | Q99961 | protein_coding | deleterious(0) | probably_damaging(0.969) | TCGA-AD-6889-01 | Colorectum | colon adenocarcinoma | Male | >=65 | I/II | Chemotherapy | xeloda | PD | |
| SH3GL1 | SNV | Missense_Mutation | rs150815092 | c.733N>T | p.Arg245Trp | p.R245W | Q99961 | protein_coding | deleterious(0.01) | possibly_damaging(0.778) | TCGA-AD-6890-01 | Colorectum | colon adenocarcinoma | Male | >=65 | I/II | Unknown | Unknown | SD |
| SH3GL1 | SNV | Missense_Mutation | rs868490265 | c.295N>T | p.Arg99Cys | p.R99C | Q99961 | protein_coding | deleterious(0) | possibly_damaging(0.901) | TCGA-CK-4951-01 | Colorectum | colon adenocarcinoma | Female | >=65 | I/II | Unknown | Unknown | PD |
| SH3GL1 | SNV | Missense_Mutation | c.805G>C | p.Glu269Gln | p.E269Q | Q99961 | protein_coding | tolerated(0.51) | benign(0.003) | TCGA-EI-7002-01 | Colorectum | rectum adenocarcinoma | Male | <65 | III/IV | Chemotherapy | irinotecan+5-fluorouracilim | SD | |
| SH3GL1 | SNV | Missense_Mutation | novel | c.142A>G | p.Thr48Ala | p.T48A | Q99961 | protein_coding | tolerated(0.81) | benign(0) | TCGA-A5-A0G1-01 | Endometrium | uterine corpus endometrioid carcinoma | Female | >=65 | I/II | Unknown | Unknown | SD |
| Page: 1 2 3 4 |
Top |
Related drugs of malignant transformation related genes |
| Identification of chemicals and drugs interact with genes involved in malignant transfromation |
| (DGIdb 4.0) |
| Entrez ID | Symbol | Category | Interaction Types | Drug Claim Name | Drug Name | PMIDs |
| Page: 1 |

Copyright 2023-Present -The University of Texas Health Science Center at Houston |