
|
|||||
|
 | |
| |
| |
| |
| |
| |
|
Gene: SH3BP5 |
Gene summary for SH3BP5 |
| Gene information | Species | Human | Gene symbol | SH3BP5 | Gene ID | 9467 |
| Gene name | SH3 domain binding protein 5 | |
| Gene Alias | SAB | |
| Cytomap | 3p25.1 | |
| Gene Type | protein-coding | GO ID | GO:0001932 | UniProtAcc | A0A024R2J3 |
Top |
Malignant transformation analysis |
| Identification of the aberrant gene expression in precancerous and cancerous lesions by comparing the gene expression of stem-like cells in diseased tissues with normal stem cells |
| Entrez ID | Symbol | Replicates | Species | Organ | Tissue | Adj P-value | Log2FC | Malignancy |
| 9467 | SH3BP5 | LZE21T | Human | Esophagus | ESCC | 2.16e-03 | 4.16e-01 | 0.0655 |
| 9467 | SH3BP5 | P2T-E | Human | Esophagus | ESCC | 1.93e-51 | 1.01e+00 | 0.1177 |
| 9467 | SH3BP5 | P4T-E | Human | Esophagus | ESCC | 7.89e-22 | 5.32e-01 | 0.1323 |
| 9467 | SH3BP5 | P5T-E | Human | Esophagus | ESCC | 6.18e-19 | 4.47e-01 | 0.1327 |
| 9467 | SH3BP5 | P8T-E | Human | Esophagus | ESCC | 3.43e-07 | 2.74e-01 | 0.0889 |
| 9467 | SH3BP5 | P9T-E | Human | Esophagus | ESCC | 2.48e-08 | 3.49e-01 | 0.1131 |
| 9467 | SH3BP5 | P10T-E | Human | Esophagus | ESCC | 3.02e-36 | 6.96e-01 | 0.116 |
| 9467 | SH3BP5 | P12T-E | Human | Esophagus | ESCC | 2.72e-38 | 8.66e-01 | 0.1122 |
| 9467 | SH3BP5 | P15T-E | Human | Esophagus | ESCC | 1.73e-04 | 2.52e-01 | 0.1149 |
| 9467 | SH3BP5 | P16T-E | Human | Esophagus | ESCC | 6.26e-22 | 4.06e-01 | 0.1153 |
| 9467 | SH3BP5 | P17T-E | Human | Esophagus | ESCC | 1.21e-04 | 4.94e-01 | 0.1278 |
| 9467 | SH3BP5 | P19T-E | Human | Esophagus | ESCC | 7.31e-03 | 4.10e-01 | 0.1662 |
| 9467 | SH3BP5 | P21T-E | Human | Esophagus | ESCC | 5.63e-09 | 1.58e-01 | 0.1617 |
| 9467 | SH3BP5 | P22T-E | Human | Esophagus | ESCC | 3.76e-08 | 9.55e-02 | 0.1236 |
| 9467 | SH3BP5 | P23T-E | Human | Esophagus | ESCC | 1.90e-30 | 8.66e-01 | 0.108 |
| 9467 | SH3BP5 | P24T-E | Human | Esophagus | ESCC | 2.62e-08 | 2.23e-01 | 0.1287 |
| 9467 | SH3BP5 | P26T-E | Human | Esophagus | ESCC | 1.45e-12 | 3.10e-01 | 0.1276 |
| 9467 | SH3BP5 | P27T-E | Human | Esophagus | ESCC | 3.77e-27 | 4.90e-01 | 0.1055 |
| 9467 | SH3BP5 | P28T-E | Human | Esophagus | ESCC | 5.93e-05 | 2.00e-01 | 0.1149 |
| 9467 | SH3BP5 | P30T-E | Human | Esophagus | ESCC | 3.28e-02 | 2.53e-01 | 0.137 |
| Page: 1 2 3 4 |
| Tissue | Expression Dynamics | Abbreviation |
| Esophagus | 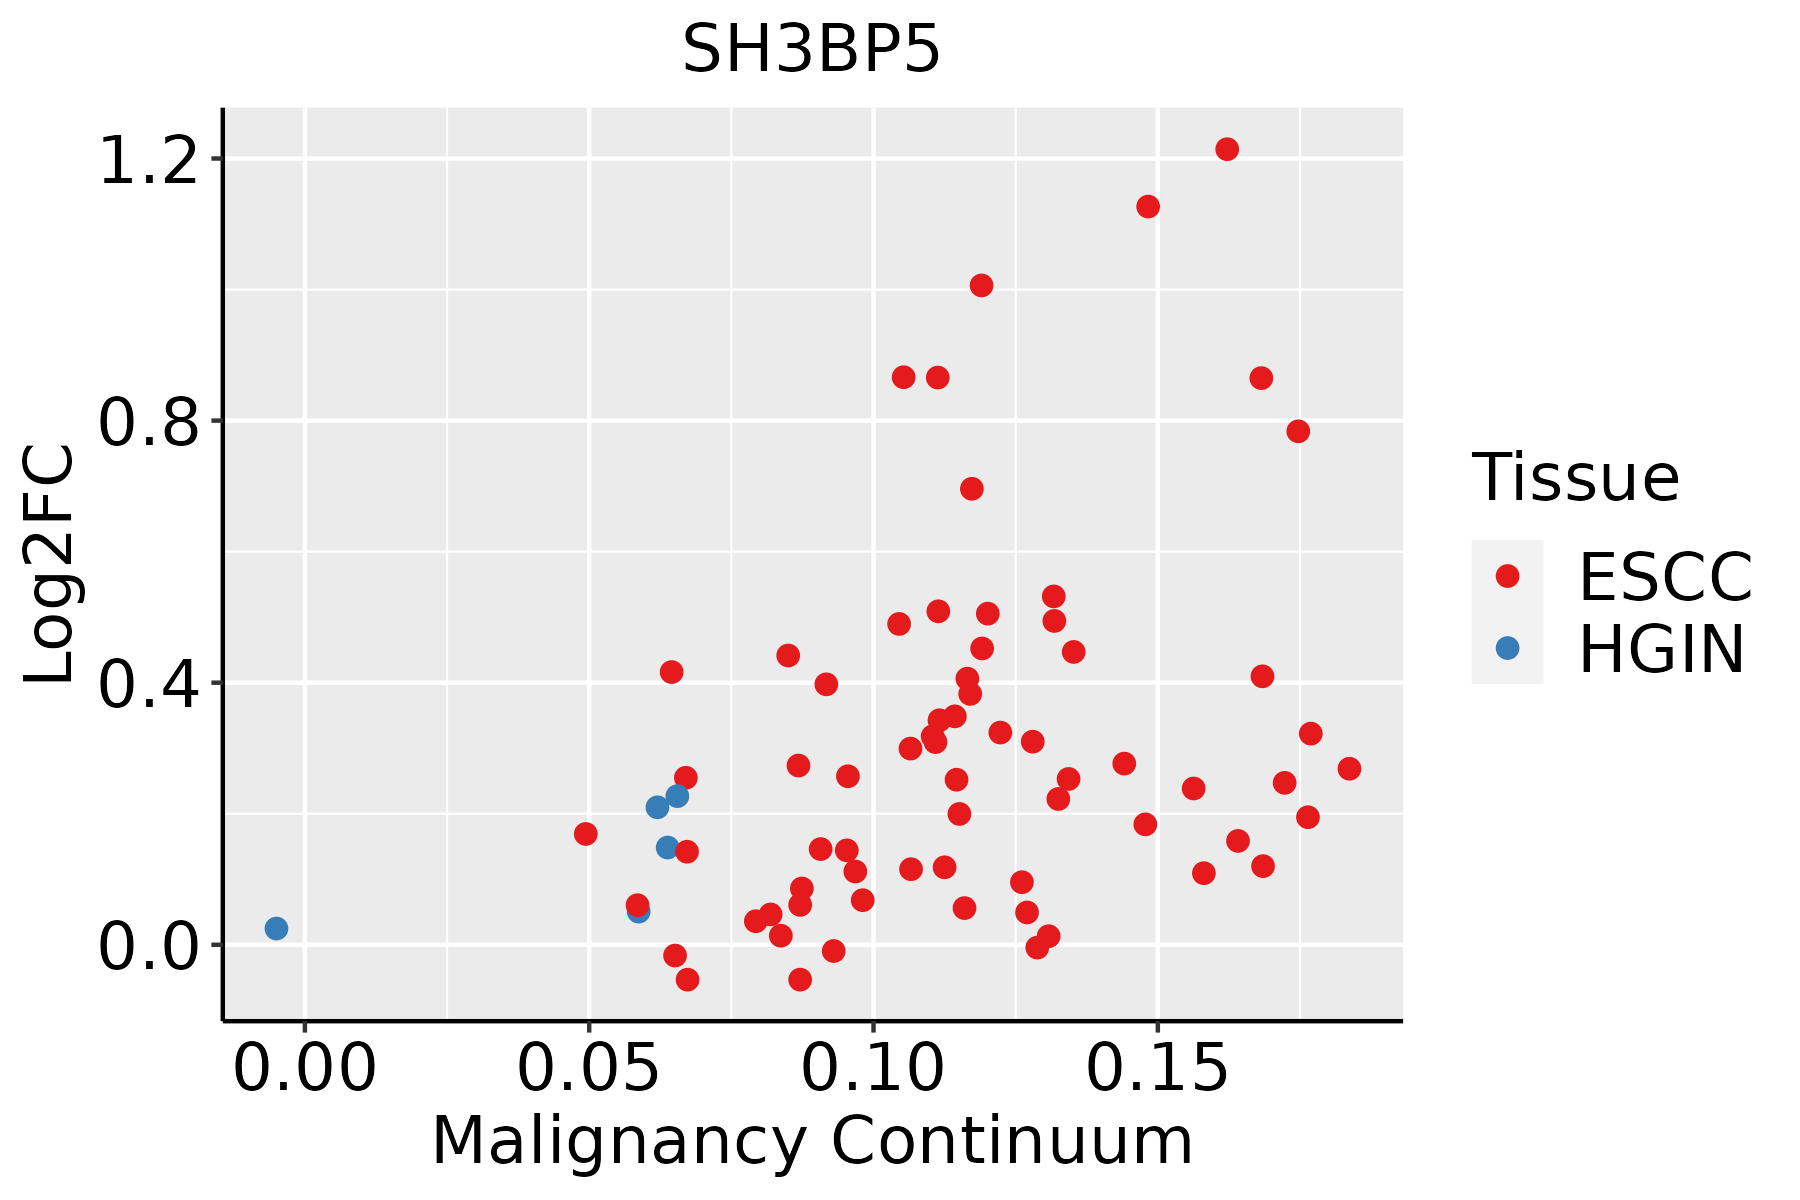 | ESCC: Esophageal squamous cell carcinoma |
| HGIN: High-grade intraepithelial neoplasias | ||
| LGIN: Low-grade intraepithelial neoplasias | ||
| Liver | 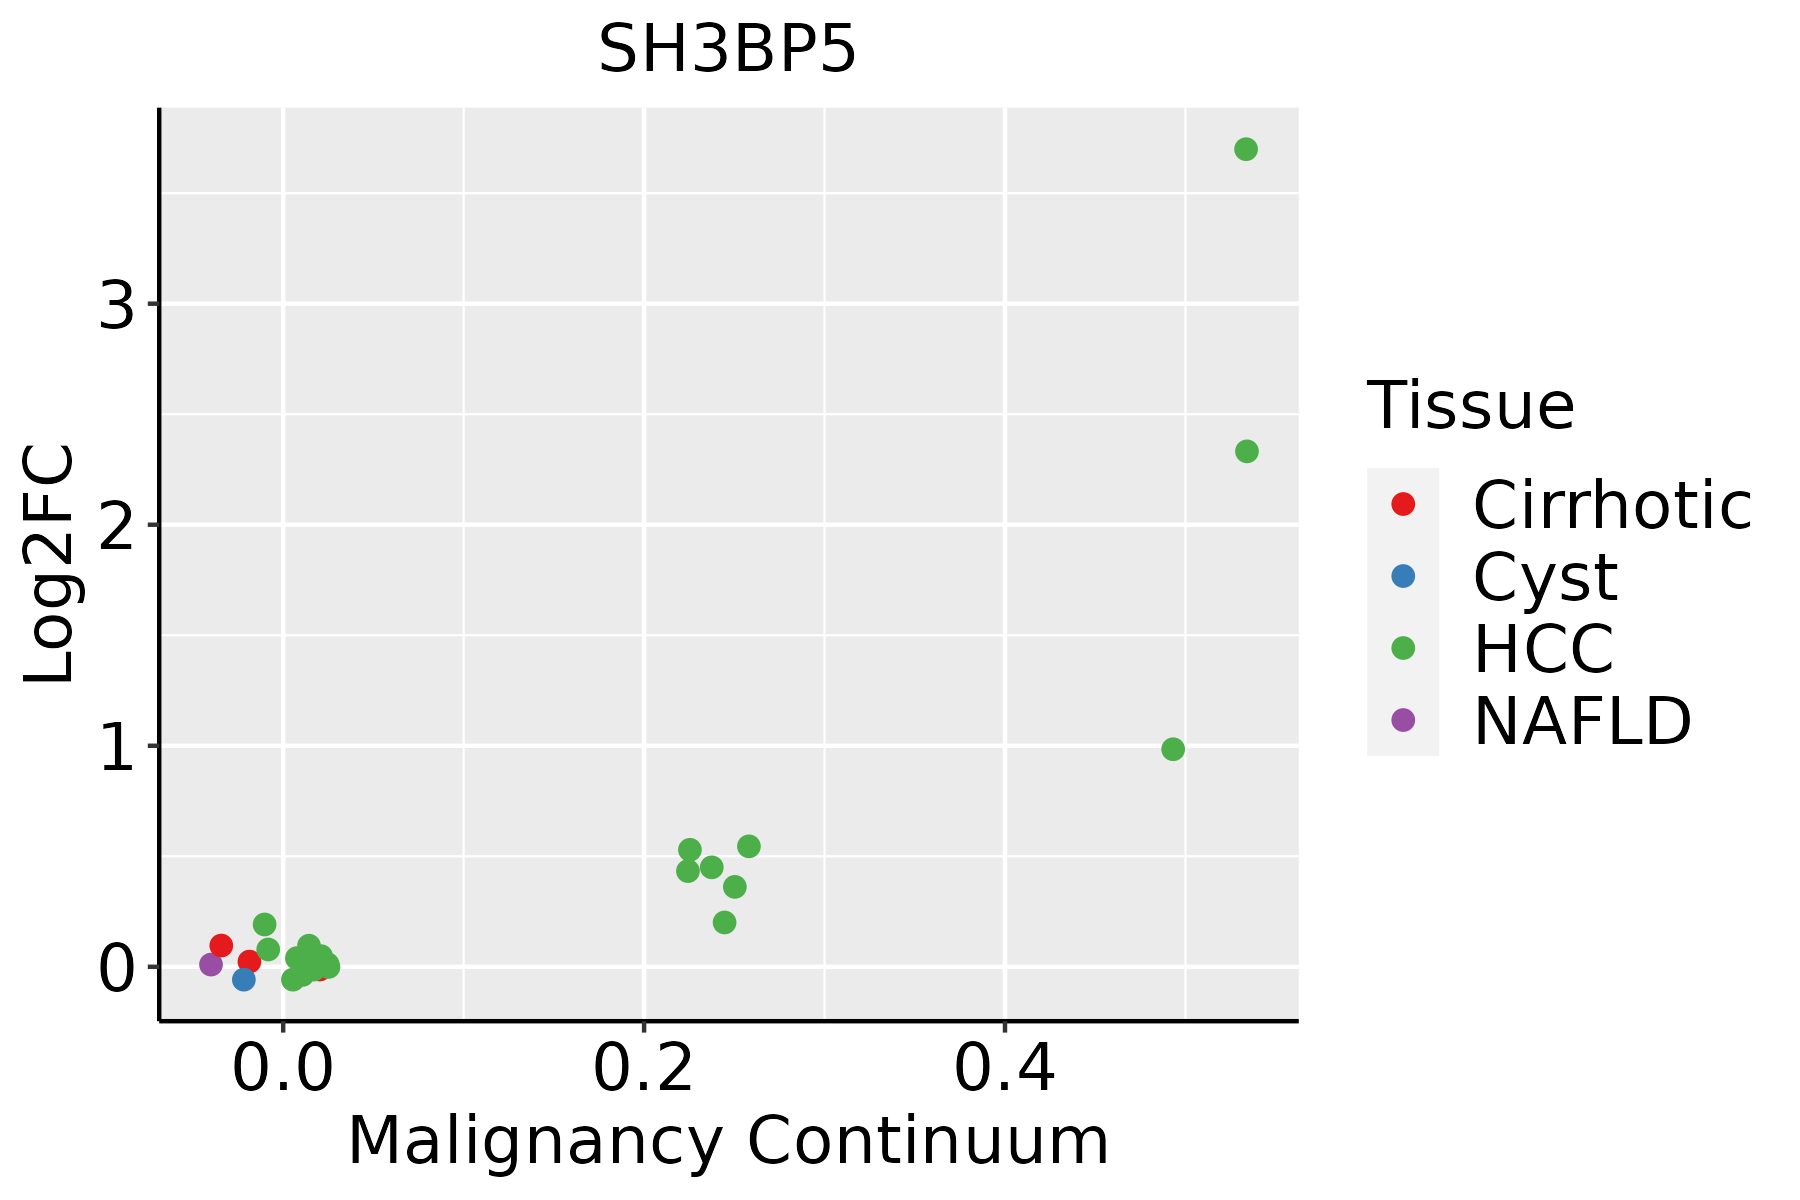 | HCC: Hepatocellular carcinoma |
| NAFLD: Non-alcoholic fatty liver disease | ||
| Oral Cavity | 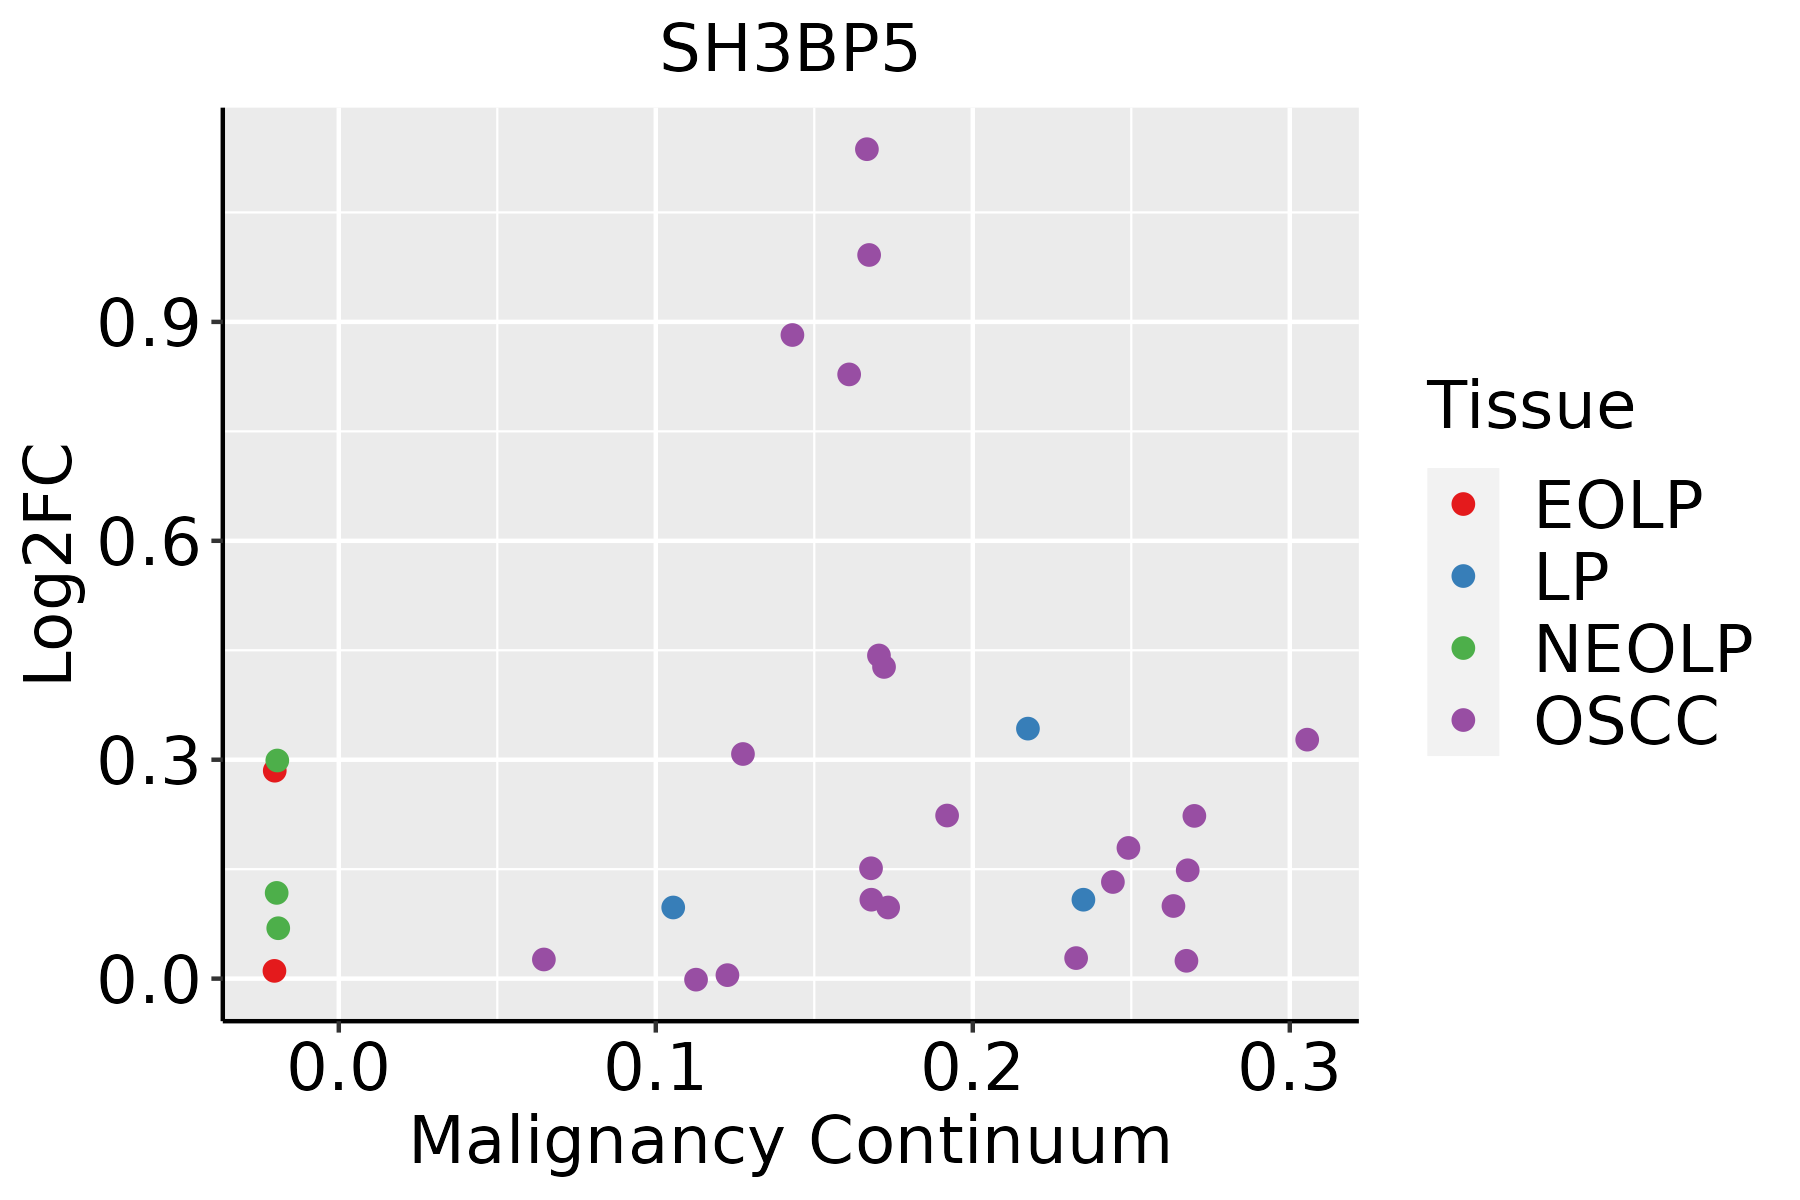 | EOLP: Erosive Oral lichen planus |
| LP: leukoplakia | ||
| NEOLP: Non-erosive oral lichen planus | ||
| OSCC: Oral squamous cell carcinoma | ||
| Thyroid |  | ATC: Anaplastic thyroid cancer |
| HT: Hashimoto's thyroiditis | ||
| PTC: Papillary thyroid cancer |
| ∗log2FC in expression of this searched gene in stem-like cells from each diseased tissue sample relative to stem-like cells in normal samples in each tissue plotted against the malignancy continuum. Samples are colored based on if they are from different disease stage. |
Top |
Malignant transformation related pathway analysis |
| Find out the enriched GO biological processes and KEGG pathways involved in transition from healthy to precancer to cancer |
| Tissue | Disease Stage | Enriched GO biological Processes |
| Colorectum | AD |  |
| Colorectum | SER |  |
| Colorectum | MSS |  |
| Colorectum | MSI-H |  |
| Colorectum | FAP |  |
| ∗Top 15 enriched GO BP terms are showed in the bar plot of each disease state in each tissue. Each row represents a significant GO biological process which is colored according to the -log10(p.adjust). |
| Page: 1 2 3 4 5 6 7 8 9 |
| GO ID | Tissue | Disease Stage | Description | Gene Ratio | Bg Ratio | pvalue | p.adjust | Count |
| GO:0010563 | Colorectum | AD | negative regulation of phosphorus metabolic process | 130/3918 | 442/18723 | 1.26e-05 | 2.76e-04 | 130 |
| GO:0045936 | Colorectum | AD | negative regulation of phosphate metabolic process | 129/3918 | 441/18723 | 1.81e-05 | 3.76e-04 | 129 |
| GO:0051348 | Colorectum | AD | negative regulation of transferase activity | 85/3918 | 268/18723 | 2.07e-05 | 4.19e-04 | 85 |
| GO:0042326 | Colorectum | AD | negative regulation of phosphorylation | 112/3918 | 385/18723 | 8.02e-05 | 1.27e-03 | 112 |
| GO:0001933 | Colorectum | AD | negative regulation of protein phosphorylation | 101/3918 | 342/18723 | 9.39e-05 | 1.42e-03 | 101 |
| GO:0006469 | Colorectum | AD | negative regulation of protein kinase activity | 65/3918 | 212/18723 | 5.21e-04 | 5.62e-03 | 65 |
| GO:0033673 | Colorectum | AD | negative regulation of kinase activity | 71/3918 | 237/18723 | 6.18e-04 | 6.47e-03 | 71 |
| GO:0061099 | Colorectum | AD | negative regulation of protein tyrosine kinase activity | 13/3918 | 31/18723 | 6.53e-03 | 4.06e-02 | 13 |
| GO:00513481 | Colorectum | SER | negative regulation of transferase activity | 70/2897 | 268/18723 | 4.27e-06 | 1.62e-04 | 70 |
| GO:00105631 | Colorectum | SER | negative regulation of phosphorus metabolic process | 101/2897 | 442/18723 | 2.39e-05 | 6.70e-04 | 101 |
| GO:00459361 | Colorectum | SER | negative regulation of phosphate metabolic process | 100/2897 | 441/18723 | 3.62e-05 | 9.39e-04 | 100 |
| GO:00019331 | Colorectum | SER | negative regulation of protein phosphorylation | 79/2897 | 342/18723 | 1.21e-04 | 2.49e-03 | 79 |
| GO:00423261 | Colorectum | SER | negative regulation of phosphorylation | 86/2897 | 385/18723 | 2.10e-04 | 3.78e-03 | 86 |
| GO:00336731 | Colorectum | SER | negative regulation of kinase activity | 57/2897 | 237/18723 | 3.48e-04 | 5.46e-03 | 57 |
| GO:00064691 | Colorectum | SER | negative regulation of protein kinase activity | 52/2897 | 212/18723 | 3.75e-04 | 5.74e-03 | 52 |
| GO:00513482 | Colorectum | MSS | negative regulation of transferase activity | 80/3467 | 268/18723 | 4.06e-06 | 1.17e-04 | 80 |
| GO:00105632 | Colorectum | MSS | negative regulation of phosphorus metabolic process | 118/3467 | 442/18723 | 1.18e-05 | 2.77e-04 | 118 |
| GO:00459362 | Colorectum | MSS | negative regulation of phosphate metabolic process | 117/3467 | 441/18723 | 1.74e-05 | 3.84e-04 | 117 |
| GO:00423262 | Colorectum | MSS | negative regulation of phosphorylation | 103/3467 | 385/18723 | 3.76e-05 | 7.17e-04 | 103 |
| GO:00019332 | Colorectum | MSS | negative regulation of protein phosphorylation | 93/3467 | 342/18723 | 4.54e-05 | 8.35e-04 | 93 |
| Page: 1 2 3 4 5 6 |
| Pathway ID | Tissue | Disease Stage | Description | Gene Ratio | Bg Ratio | pvalue | p.adjust | qvalue | Count |
| Page: 1 |
Top |
Cell-cell communication analysis |
| Identification of potential cell-cell interactions between two cell types and their ligand-receptor pairs for different disease states |
| Ligand | Receptor | LRpair | Pathway | Tissue | Disease Stage |
| Page: 1 |
Top |
Single-cell gene regulatory network inference analysis |
| Find out the significant the regulons (TFs) and the target genes of each regulon across cell types for different disease states |
| TF | Cell Type | Tissue | Disease Stage | Target Gene | RSS | Regulon Activity |
| ∗The dot plots of a searched regulon are shown for all cell subpopulations in each disease state of each tissue based on the regulon specific score inferred using pySCENIC and by calculating the average expression. |
| Page: 1 |
Top |
Somatic mutation of malignant transformation related genes |
| Annotation of somatic variants for genes involved in malignant transformation |
| Hugo Symbol | Variant Class | Variant Classification | dbSNP RS | HGVSc | HGVSp | HGVSp Short | SWISSPROT | BIOTYPE | SIFT | PolyPhen | Tumor Sample Barcode | Tissue | Histology | Sex | Age | Stage | Therapy Types | Drugs | Outcome |
| SH3BP5 | SNV | Missense_Mutation | rs757656126 | c.1171N>C | p.Glu391Gln | p.E391Q | O60239 | protein_coding | deleterious_low_confidence(0) | probably_damaging(0.994) | TCGA-A2-A4RW-01 | Breast | breast invasive carcinoma | Female | <65 | III/IV | Unknown | Unknown | SD |
| SH3BP5 | SNV | Missense_Mutation | c.781N>T | p.Arg261Trp | p.R261W | O60239 | protein_coding | deleterious(0) | probably_damaging(0.95) | TCGA-E2-A1IH-01 | Breast | breast invasive carcinoma | Female | >=65 | I/II | Hormone Therapy | aromasin | SD | |
| SH3BP5 | SNV | Missense_Mutation | novel | c.1342N>A | p.Asp448Asn | p.D448N | O60239 | protein_coding | tolerated_low_confidence(0.07) | benign(0) | TCGA-GM-A2DF-01 | Breast | breast invasive carcinoma | Female | <65 | I/II | Chemotherapy | taxol | CR |
| SH3BP5 | SNV | Missense_Mutation | novel | c.805N>T | p.Arg269Trp | p.R269W | O60239 | protein_coding | deleterious(0) | probably_damaging(0.927) | TCGA-PE-A5DE-01 | Breast | breast invasive carcinoma | Female | <65 | I/II | Chemotherapy | taxotere | CR |
| SH3BP5 | SNV | Missense_Mutation | novel | c.577C>T | p.Arg193Cys | p.R193C | O60239 | protein_coding | tolerated(0.06) | benign(0.022) | TCGA-2W-A8YY-01 | Cervix | cervical & endocervical cancer | Female | <65 | I/II | Chemotherapy | cisplatin | CR |
| SH3BP5 | SNV | Missense_Mutation | c.366C>A | p.Phe122Leu | p.F122L | O60239 | protein_coding | deleterious(0) | possibly_damaging(0.869) | TCGA-IR-A3LK-01 | Cervix | cervical & endocervical cancer | Female | >=65 | I/II | Chemotherapy | cisplatin | PD | |
| SH3BP5 | SNV | Missense_Mutation | c.785G>A | p.Arg262His | p.R262H | O60239 | protein_coding | deleterious(0.03) | benign(0.033) | TCGA-5M-AAT6-01 | Colorectum | colon adenocarcinoma | Female | <65 | III/IV | Unknown | Unknown | PD | |
| SH3BP5 | SNV | Missense_Mutation | c.571N>G | p.Met191Val | p.M191V | O60239 | protein_coding | tolerated(0.26) | benign(0.04) | TCGA-AA-3715-01 | Colorectum | colon adenocarcinoma | Male | >=65 | I/II | Unknown | Unknown | PD | |
| SH3BP5 | SNV | Missense_Mutation | c.785N>A | p.Arg262His | p.R262H | O60239 | protein_coding | deleterious(0.03) | benign(0.033) | TCGA-AD-5900-01 | Colorectum | colon adenocarcinoma | Male | >=65 | I/II | Unknown | Unknown | SD | |
| SH3BP5 | SNV | Missense_Mutation | c.214N>C | p.Lys72Gln | p.K72Q | O60239 | protein_coding | tolerated(0.1) | possibly_damaging(0.882) | TCGA-CA-5254-01 | Colorectum | colon adenocarcinoma | Female | <65 | I/II | Chemotherapy | oxaliplatin | CR |
| Page: 1 2 3 4 |
Top |
Related drugs of malignant transformation related genes |
| Identification of chemicals and drugs interact with genes involved in malignant transfromation |
| (DGIdb 4.0) |
| Entrez ID | Symbol | Category | Interaction Types | Drug Claim Name | Drug Name | PMIDs |
| Page: 1 |

Copyright 2023-Present -The University of Texas Health Science Center at Houston |