
|
|||||
|
 | |
| |
| |
| |
| |
| |
|
Gene: SH3BP2 |
Gene summary for SH3BP2 |
| Gene information | Species | Human | Gene symbol | SH3BP2 | Gene ID | 6452 |
| Gene name | SH3 domain binding protein 2 | |
| Gene Alias | 3BP-2 | |
| Cytomap | 4p16.3 | |
| Gene Type | protein-coding | GO ID | GO:0007154 | UniProtAcc | P78314 |
Top |
Malignant transformation analysis |
| Identification of the aberrant gene expression in precancerous and cancerous lesions by comparing the gene expression of stem-like cells in diseased tissues with normal stem cells |
| Entrez ID | Symbol | Replicates | Species | Organ | Tissue | Adj P-value | Log2FC | Malignancy |
| 6452 | SH3BP2 | HCC1_Meng | Human | Liver | HCC | 9.31e-16 | 1.25e-02 | 0.0246 |
| 6452 | SH3BP2 | HCC2_Meng | Human | Liver | HCC | 7.18e-05 | 6.63e-02 | 0.0107 |
| 6452 | SH3BP2 | HCC1 | Human | Liver | HCC | 9.59e-04 | 2.15e+00 | 0.5336 |
| 6452 | SH3BP2 | HCC2 | Human | Liver | HCC | 2.90e-16 | 2.91e+00 | 0.5341 |
| 6452 | SH3BP2 | S028 | Human | Liver | HCC | 5.54e-09 | 4.55e-01 | 0.2503 |
| 6452 | SH3BP2 | S029 | Human | Liver | HCC | 9.97e-04 | 4.10e-01 | 0.2581 |
| 6452 | SH3BP2 | male-WTA | Human | Thyroid | PTC | 3.77e-19 | 2.18e-01 | 0.1037 |
| 6452 | SH3BP2 | PTC01 | Human | Thyroid | PTC | 2.61e-03 | 4.46e-02 | 0.1899 |
| 6452 | SH3BP2 | PTC03 | Human | Thyroid | PTC | 6.94e-04 | 1.77e-01 | 0.1784 |
| 6452 | SH3BP2 | PTC04 | Human | Thyroid | PTC | 1.50e-09 | 1.46e-01 | 0.1927 |
| 6452 | SH3BP2 | PTC05 | Human | Thyroid | PTC | 1.05e-08 | 2.79e-01 | 0.2065 |
| 6452 | SH3BP2 | PTC06 | Human | Thyroid | PTC | 1.23e-12 | 2.74e-01 | 0.2057 |
| 6452 | SH3BP2 | PTC07 | Human | Thyroid | PTC | 1.23e-02 | 9.50e-02 | 0.2044 |
| 6452 | SH3BP2 | ATC09 | Human | Thyroid | ATC | 2.78e-14 | 4.03e-01 | 0.2871 |
| 6452 | SH3BP2 | ATC12 | Human | Thyroid | ATC | 1.34e-02 | 5.07e-02 | 0.34 |
| 6452 | SH3BP2 | ATC13 | Human | Thyroid | ATC | 9.68e-25 | 4.86e-01 | 0.34 |
| 6452 | SH3BP2 | ATC1 | Human | Thyroid | ATC | 2.05e-14 | 4.67e-01 | 0.2878 |
| 6452 | SH3BP2 | ATC2 | Human | Thyroid | ATC | 9.94e-09 | 5.14e-01 | 0.34 |
| 6452 | SH3BP2 | ATC5 | Human | Thyroid | ATC | 5.24e-29 | 5.10e-01 | 0.34 |
| Page: 1 |
| Tissue | Expression Dynamics | Abbreviation |
| Liver | 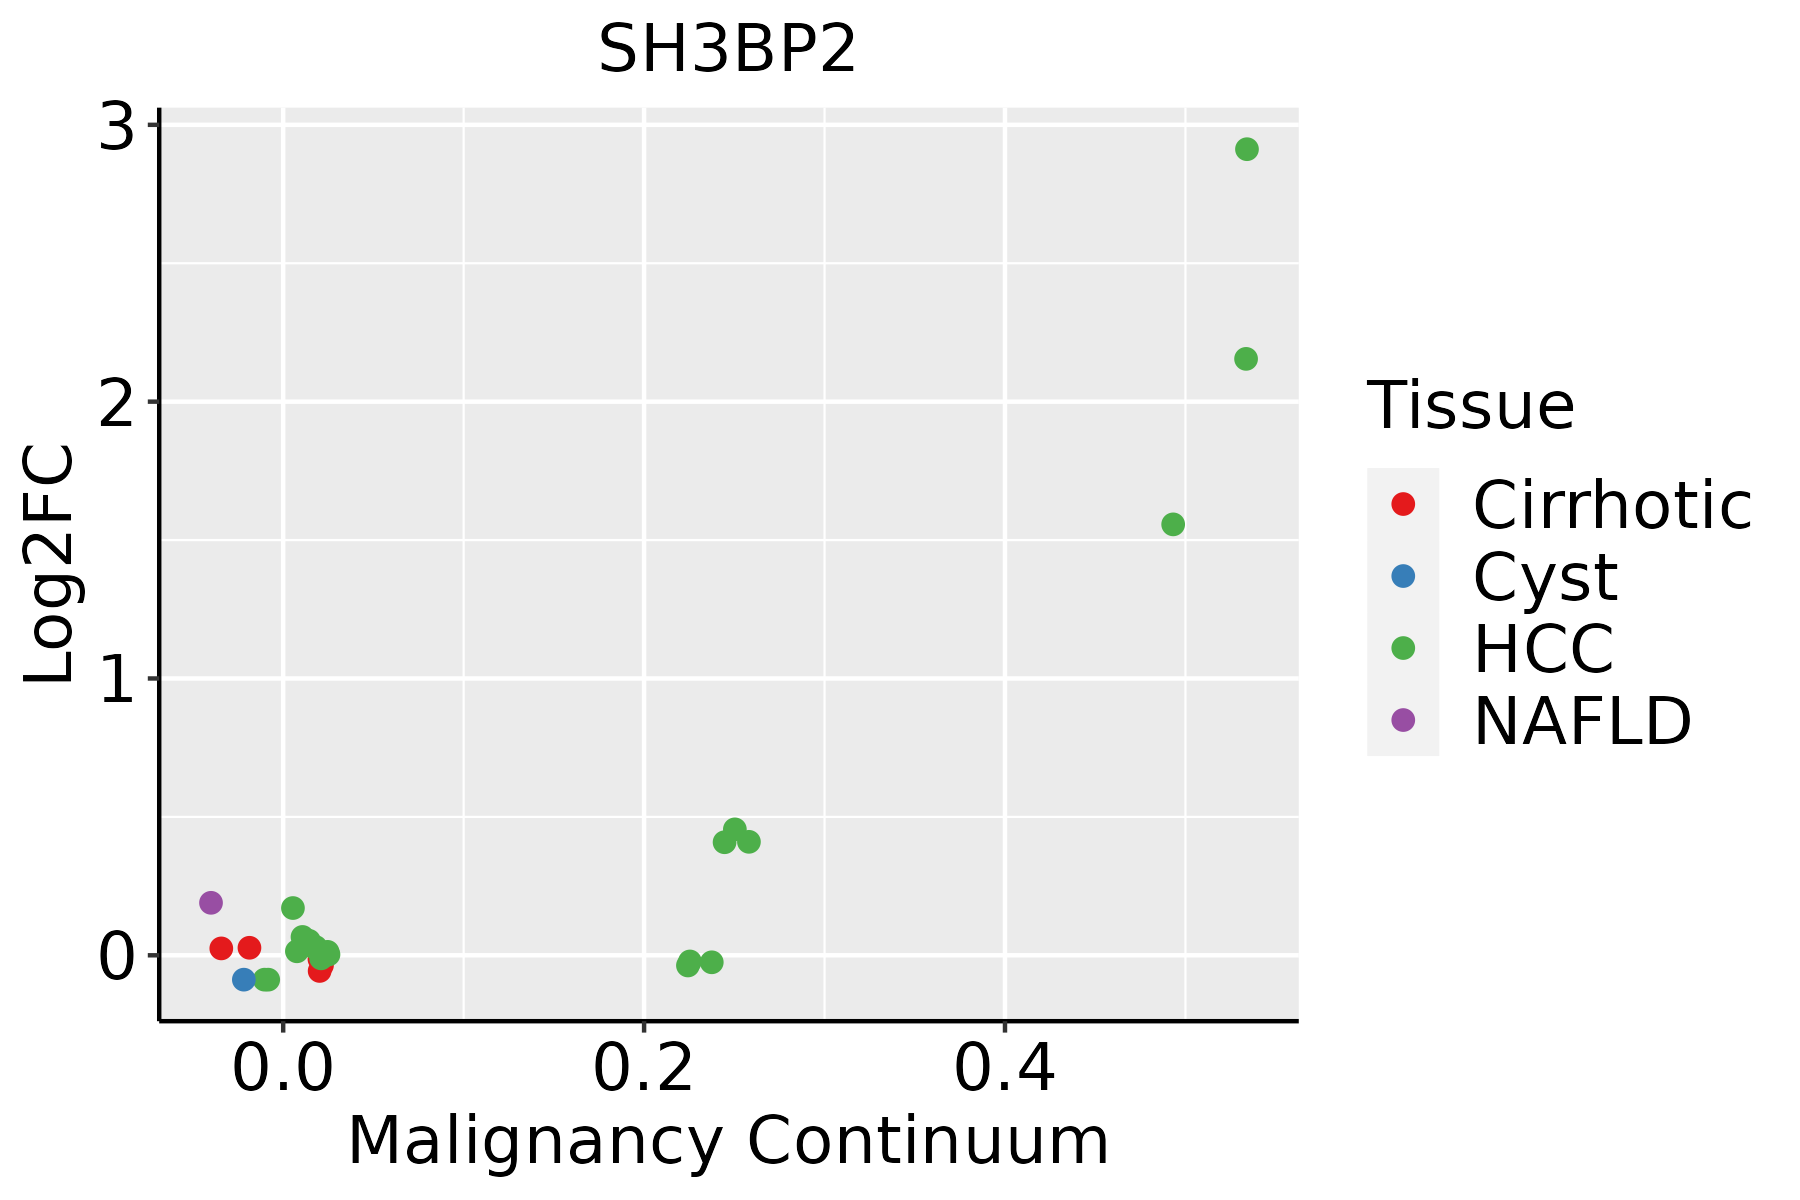 | HCC: Hepatocellular carcinoma |
| NAFLD: Non-alcoholic fatty liver disease | ||
| Thyroid |  | ATC: Anaplastic thyroid cancer |
| HT: Hashimoto's thyroiditis | ||
| PTC: Papillary thyroid cancer |
| ∗log2FC in expression of this searched gene in stem-like cells from each diseased tissue sample relative to stem-like cells in normal samples in each tissue plotted against the malignancy continuum. Samples are colored based on if they are from different disease stage. |
Top |
Malignant transformation related pathway analysis |
| Find out the enriched GO biological processes and KEGG pathways involved in transition from healthy to precancer to cancer |
| Tissue | Disease Stage | Enriched GO biological Processes |
| Colorectum | AD |  |
| Colorectum | SER |  |
| Colorectum | MSS |  |
| Colorectum | MSI-H |  |
| Colorectum | FAP |  |
| ∗Top 15 enriched GO BP terms are showed in the bar plot of each disease state in each tissue. Each row represents a significant GO biological process which is colored according to the -log10(p.adjust). |
| Page: 1 2 3 4 5 6 7 8 9 |
| GO ID | Tissue | Disease Stage | Description | Gene Ratio | Bg Ratio | pvalue | p.adjust | Count |
| Page: 1 |
| Pathway ID | Tissue | Disease Stage | Description | Gene Ratio | Bg Ratio | pvalue | p.adjust | qvalue | Count |
| Page: 1 |
Top |
Cell-cell communication analysis |
| Identification of potential cell-cell interactions between two cell types and their ligand-receptor pairs for different disease states |
| Ligand | Receptor | LRpair | Pathway | Tissue | Disease Stage |
| Page: 1 |
Top |
Single-cell gene regulatory network inference analysis |
| Find out the significant the regulons (TFs) and the target genes of each regulon across cell types for different disease states |
| TF | Cell Type | Tissue | Disease Stage | Target Gene | RSS | Regulon Activity |
| ∗The dot plots of a searched regulon are shown for all cell subpopulations in each disease state of each tissue based on the regulon specific score inferred using pySCENIC and by calculating the average expression. |
| Page: 1 |
Top |
Somatic mutation of malignant transformation related genes |
| Annotation of somatic variants for genes involved in malignant transformation |
| Hugo Symbol | Variant Class | Variant Classification | dbSNP RS | HGVSc | HGVSp | HGVSp Short | SWISSPROT | BIOTYPE | SIFT | PolyPhen | Tumor Sample Barcode | Tissue | Histology | Sex | Age | Stage | Therapy Types | Drugs | Outcome |
| SH3BP2 | SNV | Missense_Mutation | c.241C>T | p.Pro81Ser | p.P81S | P78314 | protein_coding | deleterious(0.01) | probably_damaging(0.999) | TCGA-A8-A08P-01 | Breast | breast invasive carcinoma | Female | >=65 | III/IV | Chemotherapy | 5-fluorouracil | CR | |
| SH3BP2 | SNV | Missense_Mutation | rs200207198 | c.250N>A | p.Val84Met | p.V84M | P78314 | protein_coding | deleterious(0) | probably_damaging(0.999) | TCGA-C5-A7UE-01 | Cervix | cervical & endocervical cancer | Female | <65 | I/II | Chemotherapy | cisplatin | SD |
| SH3BP2 | SNV | Missense_Mutation | novel | c.899G>A | p.Gly300Asp | p.G300D | P78314 | protein_coding | deleterious_low_confidence(0.01) | probably_damaging(0.999) | TCGA-EA-A3HU-01 | Cervix | cervical & endocervical cancer | Female | <65 | I/II | Unknown | Unknown | SD |
| SH3BP2 | SNV | Missense_Mutation | novel | c.1068G>C | p.Glu356Asp | p.E356D | P78314 | protein_coding | tolerated_low_confidence(0.15) | benign(0.007) | TCGA-VS-A9UP-01 | Cervix | cervical & endocervical cancer | Female | <65 | I/II | Chemotherapy | cisplatin | PD |
| SH3BP2 | SNV | Missense_Mutation | c.971N>A | p.Cys324Tyr | p.C324Y | P78314 | protein_coding | tolerated_low_confidence(0.12) | benign(0) | TCGA-A6-6653-01 | Colorectum | colon adenocarcinoma | Male | >=65 | I/II | Unknown | Unknown | SD | |
| SH3BP2 | SNV | Missense_Mutation | rs779608979 | c.338N>A | p.Arg113His | p.R113H | P78314 | protein_coding | tolerated(0.15) | possibly_damaging(0.642) | TCGA-AA-A00N-01 | Colorectum | colon adenocarcinoma | Male | >=65 | I/II | Unknown | Unknown | PD |
| SH3BP2 | SNV | Missense_Mutation | c.1324N>T | p.Pro442Ser | p.P442S | P78314 | protein_coding | tolerated_low_confidence(0.07) | possibly_damaging(0.532) | TCGA-CK-4951-01 | Colorectum | colon adenocarcinoma | Female | >=65 | I/II | Unknown | Unknown | PD | |
| SH3BP2 | SNV | Missense_Mutation | rs763371314 | c.1325N>T | p.Pro442Leu | p.P442L | P78314 | protein_coding | deleterious_low_confidence(0.04) | probably_damaging(0.963) | TCGA-CK-4951-01 | Colorectum | colon adenocarcinoma | Female | >=65 | I/II | Unknown | Unknown | PD |
| SH3BP2 | SNV | Missense_Mutation | c.1517N>T | p.Glu506Val | p.E506V | P78314 | protein_coding | deleterious_low_confidence(0) | possibly_damaging(0.593) | TCGA-CK-4951-01 | Colorectum | colon adenocarcinoma | Female | >=65 | I/II | Unknown | Unknown | PD | |
| SH3BP2 | SNV | Missense_Mutation | c.317N>A | p.Arg106His | p.R106H | P78314 | protein_coding | deleterious(0) | probably_damaging(0.938) | TCGA-G4-6309-01 | Colorectum | colon adenocarcinoma | Female | <65 | III/IV | Chemotherapy | xeloda | PD |
| Page: 1 2 3 4 5 6 7 8 |
Top |
Related drugs of malignant transformation related genes |
| Identification of chemicals and drugs interact with genes involved in malignant transfromation |
| (DGIdb 4.0) |
| Entrez ID | Symbol | Category | Interaction Types | Drug Claim Name | Drug Name | PMIDs |
| Page: 1 |

Copyright 2023-Present -The University of Texas Health Science Center at Houston |