
|
|||||
|
 | |
| |
| |
| |
| |
| |
|
Gene: SH3BP1 |
Gene summary for SH3BP1 |
| Gene information | Species | Human | Gene symbol | SH3BP1 | Gene ID | 23616 |
| Gene name | SH3 domain binding protein 1 | |
| Gene Alias | ARHGAP43 | |
| Cytomap | 22q13.1 | |
| Gene Type | protein-coding | GO ID | GO:0001667 | UniProtAcc | Q9Y3L3 |
Top |
Malignant transformation analysis |
| Identification of the aberrant gene expression in precancerous and cancerous lesions by comparing the gene expression of stem-like cells in diseased tissues with normal stem cells |
| Entrez ID | Symbol | Replicates | Species | Organ | Tissue | Adj P-value | Log2FC | Malignancy |
| 23616 | SH3BP1 | HTA11_3410_2000001011 | Human | Colorectum | AD | 2.84e-04 | 1.21e-01 | 0.0155 |
| 23616 | SH3BP1 | HTA11_2487_2000001011 | Human | Colorectum | SER | 3.70e-09 | 2.48e-01 | -0.1808 |
| 23616 | SH3BP1 | HTA11_1938_2000001011 | Human | Colorectum | AD | 8.58e-13 | 3.80e-01 | -0.0811 |
| 23616 | SH3BP1 | HTA11_78_2000001011 | Human | Colorectum | AD | 1.84e-03 | 1.43e-01 | -0.1088 |
| 23616 | SH3BP1 | HTA11_347_2000001011 | Human | Colorectum | AD | 8.14e-12 | 2.38e-01 | -0.1954 |
| 23616 | SH3BP1 | HTA11_3361_2000001011 | Human | Colorectum | AD | 1.41e-08 | 2.76e-01 | -0.1207 |
| 23616 | SH3BP1 | HTA11_83_2000001011 | Human | Colorectum | SER | 1.79e-04 | 1.89e-01 | -0.1526 |
| 23616 | SH3BP1 | HTA11_696_2000001011 | Human | Colorectum | AD | 5.26e-16 | 3.63e-01 | -0.1464 |
| 23616 | SH3BP1 | HTA11_866_2000001011 | Human | Colorectum | AD | 1.85e-08 | 2.15e-01 | -0.1001 |
| 23616 | SH3BP1 | HTA11_1391_2000001011 | Human | Colorectum | AD | 6.55e-21 | 5.27e-01 | -0.059 |
| 23616 | SH3BP1 | HTA11_2992_2000001011 | Human | Colorectum | SER | 2.44e-09 | 3.99e-01 | -0.1706 |
| 23616 | SH3BP1 | HTA11_5212_2000001011 | Human | Colorectum | AD | 8.16e-07 | 3.20e-01 | -0.2061 |
| 23616 | SH3BP1 | HTA11_546_2000001011 | Human | Colorectum | AD | 2.42e-10 | 3.45e-01 | -0.0842 |
| 23616 | SH3BP1 | HTA11_866_3004761011 | Human | Colorectum | AD | 9.76e-05 | 1.64e-01 | 0.096 |
| 23616 | SH3BP1 | HTA11_8622_2000001021 | Human | Colorectum | SER | 3.19e-02 | 1.60e-01 | 0.0528 |
| 23616 | SH3BP1 | HTA11_10623_2000001011 | Human | Colorectum | AD | 9.21e-08 | 3.16e-01 | -0.0177 |
| 23616 | SH3BP1 | HTA11_6801_2000001011 | Human | Colorectum | SER | 1.64e-05 | 3.27e-01 | 0.0171 |
| 23616 | SH3BP1 | HTA11_10711_2000001011 | Human | Colorectum | AD | 1.28e-04 | 1.62e-01 | 0.0338 |
| 23616 | SH3BP1 | HTA11_7696_3000711011 | Human | Colorectum | AD | 2.85e-07 | 2.46e-01 | 0.0674 |
| 23616 | SH3BP1 | HTA11_7469_2000001011 | Human | Colorectum | AD | 2.39e-03 | 3.72e-01 | -0.0124 |
| Page: 1 2 3 4 5 6 |
| Tissue | Expression Dynamics | Abbreviation |
| Colorectum (GSE201348) |  | FAP: Familial adenomatous polyposis |
| CRC: Colorectal cancer | ||
| Colorectum (HTA11) |  | AD: Adenomas |
| SER: Sessile serrated lesions | ||
| MSI-H: Microsatellite-high colorectal cancer | ||
| MSS: Microsatellite stable colorectal cancer | ||
| Esophagus | 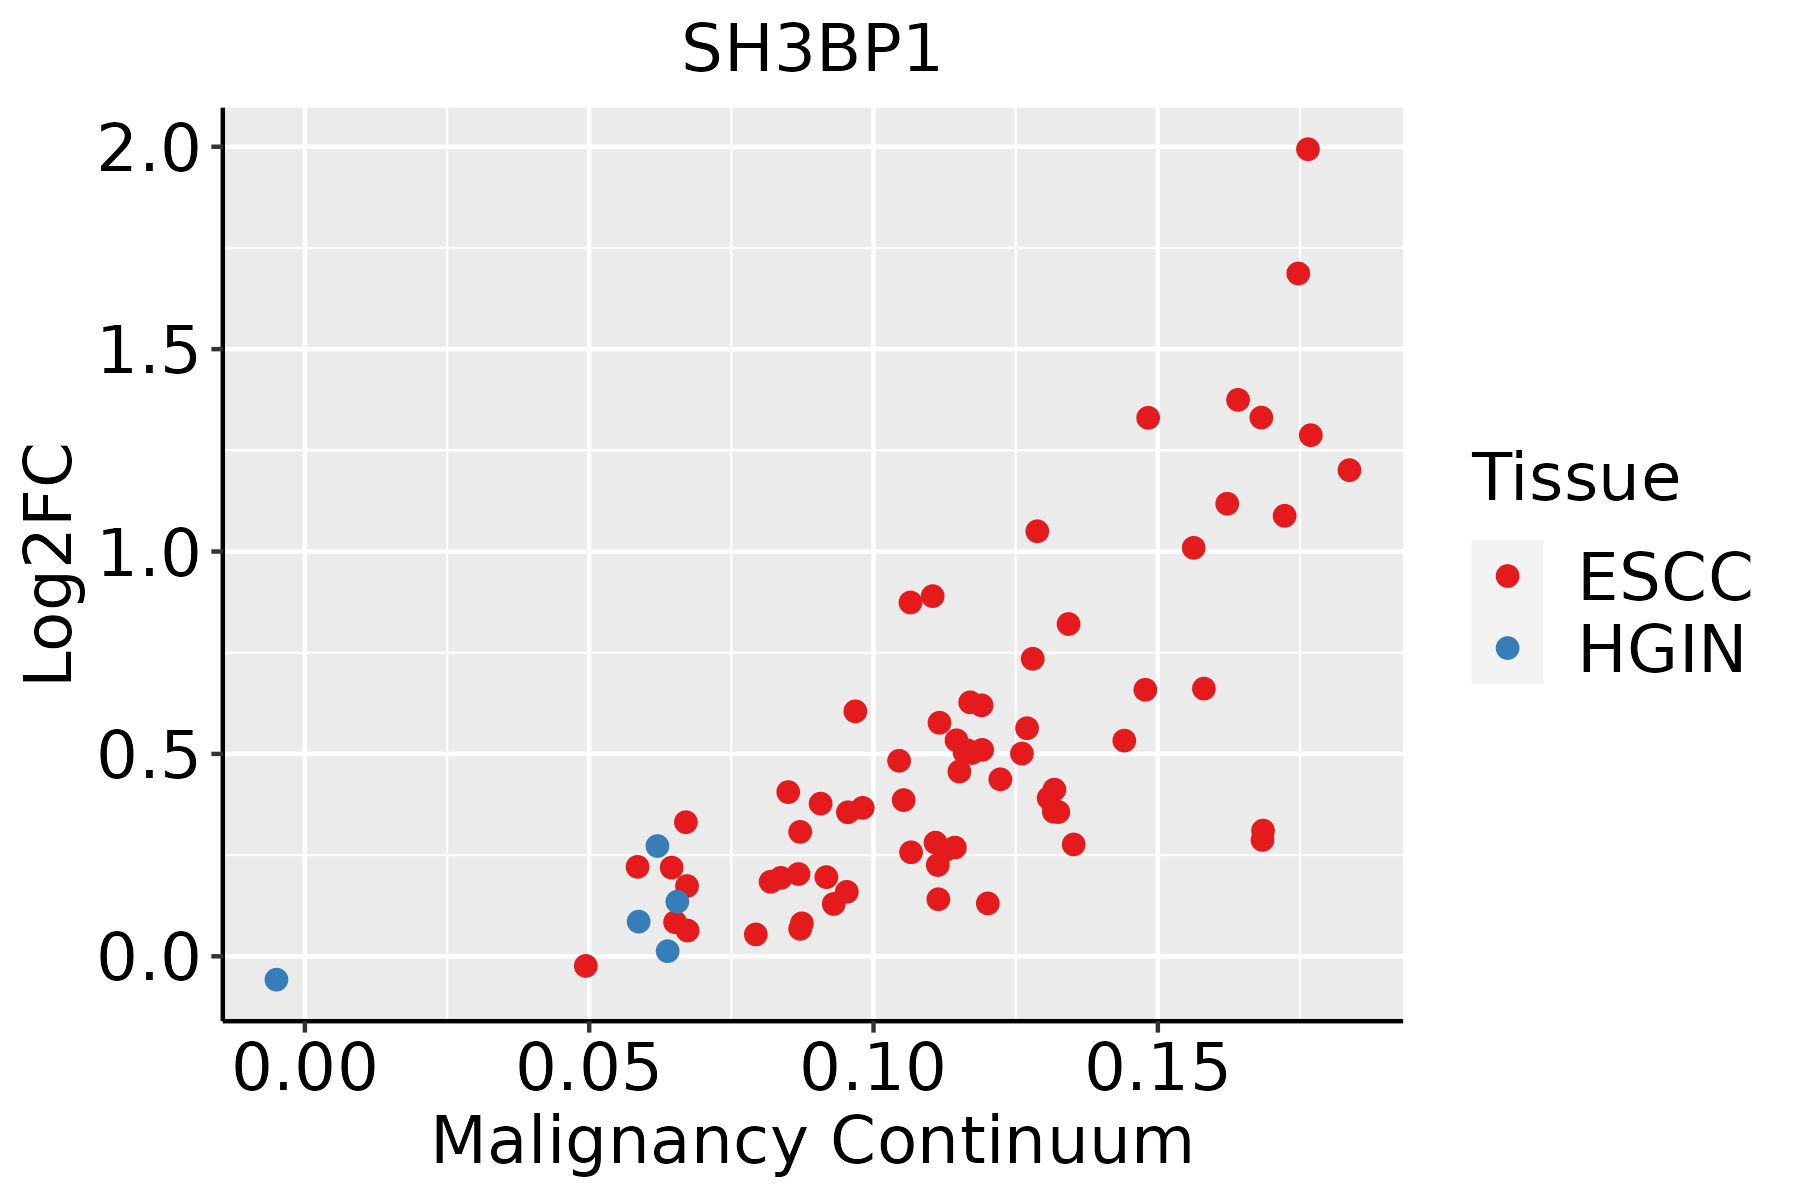 | ESCC: Esophageal squamous cell carcinoma |
| HGIN: High-grade intraepithelial neoplasias | ||
| LGIN: Low-grade intraepithelial neoplasias | ||
| Oral Cavity | 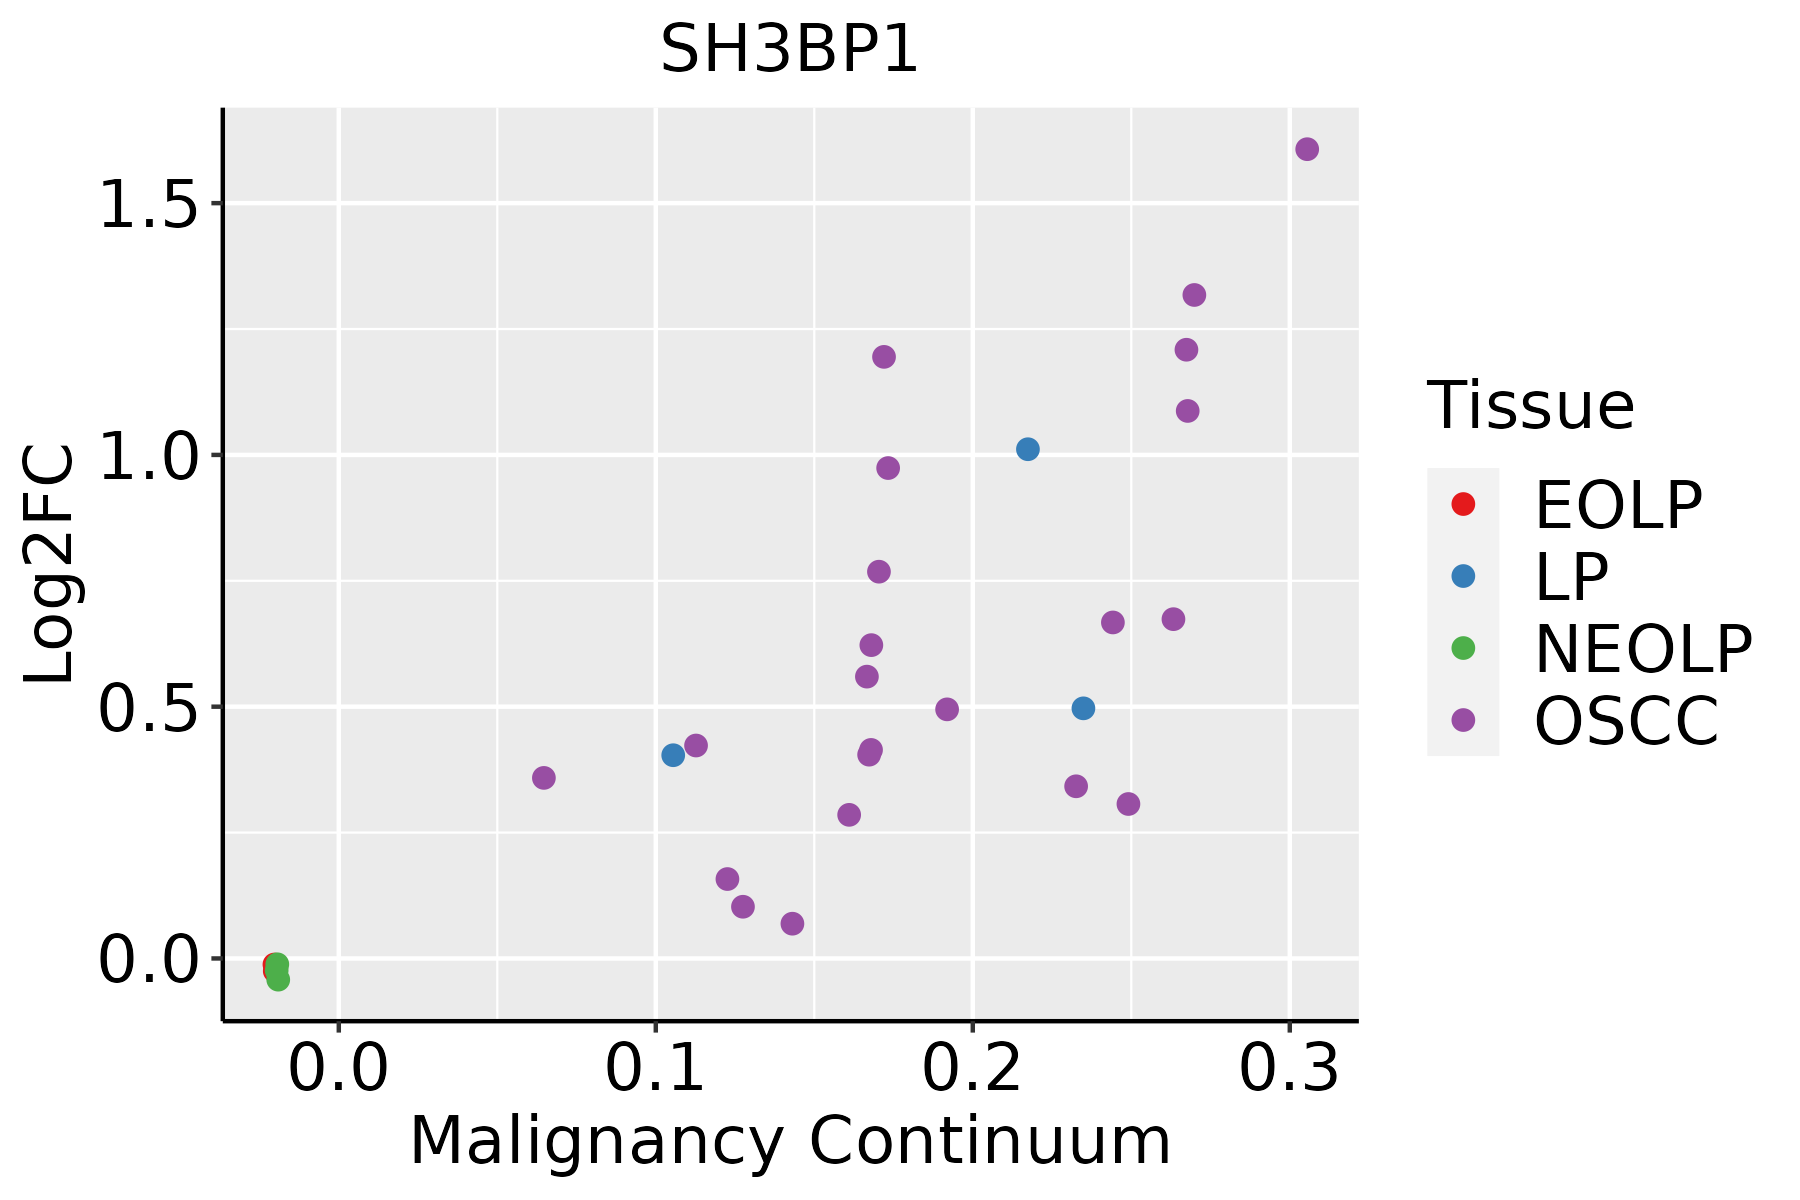 | EOLP: Erosive Oral lichen planus |
| LP: leukoplakia | ||
| NEOLP: Non-erosive oral lichen planus | ||
| OSCC: Oral squamous cell carcinoma | ||
| Skin | 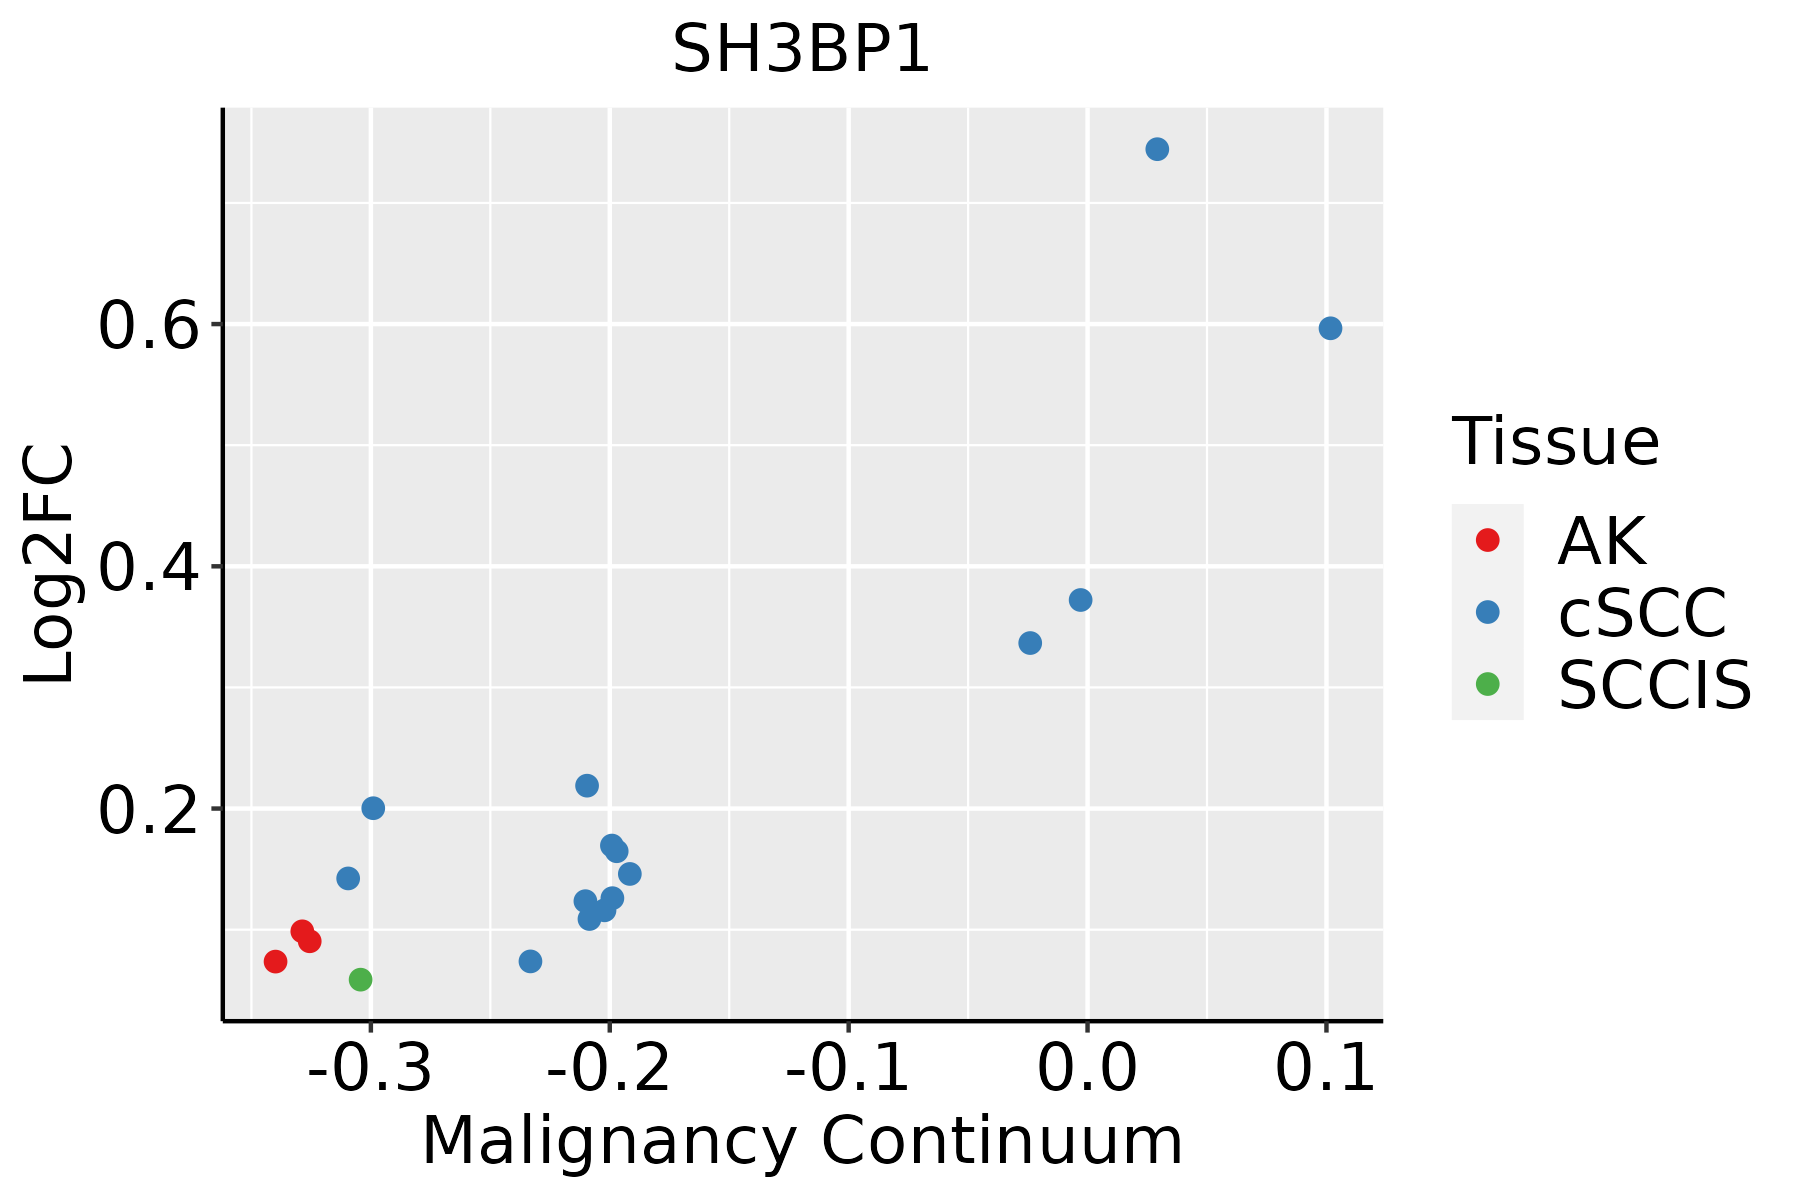 | AK: Actinic keratosis |
| cSCC: Cutaneous squamous cell carcinoma | ||
| SCCIS:squamous cell carcinoma in situ |
| ∗log2FC in expression of this searched gene in stem-like cells from each diseased tissue sample relative to stem-like cells in normal samples in each tissue plotted against the malignancy continuum. Samples are colored based on if they are from different disease stage. |
Top |
Malignant transformation related pathway analysis |
| Find out the enriched GO biological processes and KEGG pathways involved in transition from healthy to precancer to cancer |
| Tissue | Disease Stage | Enriched GO biological Processes |
| Colorectum | AD |  |
| Colorectum | SER |  |
| Colorectum | MSS |  |
| Colorectum | MSI-H |  |
| Colorectum | FAP |  |
| ∗Top 15 enriched GO BP terms are showed in the bar plot of each disease state in each tissue. Each row represents a significant GO biological process which is colored according to the -log10(p.adjust). |
| Page: 1 2 3 4 5 6 7 8 9 |
| GO ID | Tissue | Disease Stage | Description | Gene Ratio | Bg Ratio | pvalue | p.adjust | Count |
| GO:0007015 | Colorectum | AD | actin filament organization | 167/3918 | 442/18723 | 1.65e-16 | 7.94e-14 | 167 |
| GO:0032535 | Colorectum | AD | regulation of cellular component size | 142/3918 | 383/18723 | 1.74e-13 | 3.41e-11 | 142 |
| GO:1902903 | Colorectum | AD | regulation of supramolecular fiber organization | 139/3918 | 383/18723 | 2.01e-12 | 3.19e-10 | 139 |
| GO:0032970 | Colorectum | AD | regulation of actin filament-based process | 142/3918 | 397/18723 | 4.05e-12 | 5.90e-10 | 142 |
| GO:0110053 | Colorectum | AD | regulation of actin filament organization | 108/3918 | 278/18723 | 5.02e-12 | 6.98e-10 | 108 |
| GO:0008154 | Colorectum | AD | actin polymerization or depolymerization | 90/3918 | 218/18723 | 6.14e-12 | 8.23e-10 | 90 |
| GO:0008064 | Colorectum | AD | regulation of actin polymerization or depolymerization | 79/3918 | 188/18723 | 4.17e-11 | 4.74e-09 | 79 |
| GO:0030832 | Colorectum | AD | regulation of actin filament length | 79/3918 | 189/18723 | 5.71e-11 | 6.27e-09 | 79 |
| GO:0032956 | Colorectum | AD | regulation of actin cytoskeleton organization | 127/3918 | 358/18723 | 1.03e-10 | 1.04e-08 | 127 |
| GO:0022411 | Colorectum | AD | cellular component disassembly | 147/3918 | 443/18723 | 8.53e-10 | 6.76e-08 | 147 |
| GO:0034329 | Colorectum | AD | cell junction assembly | 136/3918 | 420/18723 | 2.02e-08 | 1.15e-06 | 136 |
| GO:0032984 | Colorectum | AD | protein-containing complex disassembly | 81/3918 | 224/18723 | 9.41e-08 | 4.65e-06 | 81 |
| GO:0007163 | Colorectum | AD | establishment or maintenance of cell polarity | 77/3918 | 218/18723 | 5.72e-07 | 2.08e-05 | 77 |
| GO:0043087 | Colorectum | AD | regulation of GTPase activity | 110/3918 | 348/18723 | 1.64e-06 | 5.03e-05 | 110 |
| GO:0007265 | Colorectum | AD | Ras protein signal transduction | 104/3918 | 337/18723 | 1.01e-05 | 2.35e-04 | 104 |
| GO:0030042 | Colorectum | AD | actin filament depolymerization | 27/3918 | 59/18723 | 1.65e-05 | 3.47e-04 | 27 |
| GO:0051056 | Colorectum | AD | regulation of small GTPase mediated signal transduction | 94/3918 | 302/18723 | 1.81e-05 | 3.76e-04 | 94 |
| GO:0001667 | Colorectum | AD | ameboidal-type cell migration | 137/3918 | 475/18723 | 2.17e-05 | 4.33e-04 | 137 |
| GO:0030010 | Colorectum | AD | establishment of cell polarity | 50/3918 | 143/18723 | 6.90e-05 | 1.11e-03 | 50 |
| GO:0030834 | Colorectum | AD | regulation of actin filament depolymerization | 24/3918 | 54/18723 | 8.58e-05 | 1.33e-03 | 24 |
| Page: 1 2 3 4 5 6 7 8 9 10 11 |
| Pathway ID | Tissue | Disease Stage | Description | Gene Ratio | Bg Ratio | pvalue | p.adjust | qvalue | Count |
| Page: 1 |
Top |
Cell-cell communication analysis |
| Identification of potential cell-cell interactions between two cell types and their ligand-receptor pairs for different disease states |
| Ligand | Receptor | LRpair | Pathway | Tissue | Disease Stage |
| Page: 1 |
Top |
Single-cell gene regulatory network inference analysis |
| Find out the significant the regulons (TFs) and the target genes of each regulon across cell types for different disease states |
| TF | Cell Type | Tissue | Disease Stage | Target Gene | RSS | Regulon Activity |
| ∗The dot plots of a searched regulon are shown for all cell subpopulations in each disease state of each tissue based on the regulon specific score inferred using pySCENIC and by calculating the average expression. |
| Page: 1 |
Top |
Somatic mutation of malignant transformation related genes |
| Annotation of somatic variants for genes involved in malignant transformation |
| Hugo Symbol | Variant Class | Variant Classification | dbSNP RS | HGVSc | HGVSp | HGVSp Short | SWISSPROT | BIOTYPE | SIFT | PolyPhen | Tumor Sample Barcode | Tissue | Histology | Sex | Age | Stage | Therapy Types | Drugs | Outcome |
| SH3BP1 | SNV | Missense_Mutation | c.147C>G | p.Ile49Met | p.I49M | Q9Y3L3 | protein_coding | deleterious(0.02) | possibly_damaging(0.541) | TCGA-AN-A0XP-01 | Breast | breast invasive carcinoma | Female | >=65 | III/IV | Unknown | Unknown | SD | |
| SH3BP1 | SNV | Missense_Mutation | c.532A>G | p.Ser178Gly | p.S178G | Q9Y3L3 | protein_coding | tolerated(0.33) | benign(0.015) | TCGA-D8-A1XK-01 | Breast | breast invasive carcinoma | Female | <65 | I/II | Chemotherapy | doxorubicine+cyclophosphamide | SD | |
| SH3BP1 | SNV | Missense_Mutation | novel | c.1623A>C | p.Arg541Ser | p.R541S | Q9Y3L3 | protein_coding | deleterious(0.04) | benign(0.01) | TCGA-E2-A1L8-01 | Breast | breast invasive carcinoma | Female | <65 | I/II | Chemotherapy | cyclophosphamide | SD |
| SH3BP1 | insertion | In_Frame_Ins | novel | c.1105_1106insGTTCTGCTCCGACCCGCACGC | p.Met369delinsSerSerAlaProThrArgThrLeu | p.M369delinsSSAPTRTL | Q9Y3L3 | protein_coding | TCGA-A7-A0D9-01 | Breast | breast invasive carcinoma | Female | <65 | I/II | Chemotherapy | taxotere | SD | ||
| SH3BP1 | insertion | In_Frame_Ins | novel | c.705_706insTCGATGGGCAGG | p.Ala235_Asp236insSerMetGlyArg | p.A235_D236insSMGR | Q9Y3L3 | protein_coding | TCGA-A8-A093-01 | Breast | breast invasive carcinoma | Female | <65 | I/II | Hormone Therapy | tamoxiphen | SD | ||
| SH3BP1 | insertion | Nonsense_Mutation | novel | c.630_631insAAGAATGACTGAATGGTGAATAACAGGTCACTGT | p.Ala211LysfsTer4 | p.A211Kfs*4 | Q9Y3L3 | protein_coding | TCGA-A8-A09W-01 | Breast | breast invasive carcinoma | Female | >=65 | III/IV | Unknown | Unknown | SD | ||
| SH3BP1 | SNV | Missense_Mutation | novel | c.552N>A | p.Met184Ile | p.M184I | Q9Y3L3 | protein_coding | tolerated(0.14) | benign(0.001) | TCGA-2W-A8YY-01 | Cervix | cervical & endocervical cancer | Female | <65 | I/II | Chemotherapy | cisplatin | CR |
| SH3BP1 | SNV | Missense_Mutation | rs754015130 | c.1372N>A | p.Val458Ile | p.V458I | Q9Y3L3 | protein_coding | tolerated(0.82) | benign(0.153) | TCGA-EA-A3HS-01 | Cervix | cervical & endocervical cancer | Female | <65 | I/II | Unknown | Unknown | SD |
| SH3BP1 | SNV | Missense_Mutation | novel | c.307G>A | p.Ala103Thr | p.A103T | Q9Y3L3 | protein_coding | tolerated(0.46) | benign(0.253) | TCGA-EA-A410-01 | Cervix | cervical & endocervical cancer | Female | <65 | I/II | Unknown | Unknown | SD |
| SH3BP1 | SNV | Missense_Mutation | c.1537N>A | p.Pro513Thr | p.P513T | Q9Y3L3 | protein_coding | tolerated(0.18) | benign(0.031) | TCGA-IR-A3LA-01 | Cervix | cervical & endocervical cancer | Female | <65 | I/II | Chemotherapy | cisplatin | CR |
| Page: 1 2 3 4 5 |
Top |
Related drugs of malignant transformation related genes |
| Identification of chemicals and drugs interact with genes involved in malignant transfromation |
| (DGIdb 4.0) |
| Entrez ID | Symbol | Category | Interaction Types | Drug Claim Name | Drug Name | PMIDs |
| Page: 1 |

Copyright 2023-Present -The University of Texas Health Science Center at Houston |