
|
|||||
|
 | |
| |
| |
| |
| |
| |
|
Gene: SH3BGRL2 |
Gene summary for SH3BGRL2 |
| Gene information | Species | Human | Gene symbol | SH3BGRL2 | Gene ID | 83699 |
| Gene name | SH3 domain binding glutamate rich protein like 2 | |
| Gene Alias | SH3BGRL2 | |
| Cytomap | 6q14.1 | |
| Gene Type | protein-coding | GO ID | GO:0005575 | UniProtAcc | Q9UJC5 |
Top |
Malignant transformation analysis |
| Identification of the aberrant gene expression in precancerous and cancerous lesions by comparing the gene expression of stem-like cells in diseased tissues with normal stem cells |
| Entrez ID | Symbol | Replicates | Species | Organ | Tissue | Adj P-value | Log2FC | Malignancy |
| 83699 | SH3BGRL2 | HTA11_3410_2000001011 | Human | Colorectum | AD | 2.67e-02 | -1.98e-01 | 0.0155 |
| 83699 | SH3BGRL2 | HTA11_78_2000001011 | Human | Colorectum | AD | 5.14e-03 | 5.06e-01 | -0.1088 |
| 83699 | SH3BGRL2 | HTA11_347_2000001011 | Human | Colorectum | AD | 5.42e-15 | 7.77e-01 | -0.1954 |
| 83699 | SH3BGRL2 | HTA11_411_2000001011 | Human | Colorectum | SER | 6.76e-03 | 9.07e-01 | -0.2602 |
| 83699 | SH3BGRL2 | HTA11_99999974143_84620 | Human | Colorectum | MSS | 8.74e-11 | -4.19e-01 | 0.3005 |
| 83699 | SH3BGRL2 | A001-C-207 | Human | Colorectum | FAP | 1.03e-02 | -9.55e-02 | 0.1278 |
| 83699 | SH3BGRL2 | A015-C-203 | Human | Colorectum | FAP | 2.47e-18 | -2.97e-01 | -0.1294 |
| 83699 | SH3BGRL2 | A015-C-204 | Human | Colorectum | FAP | 2.57e-04 | -2.42e-01 | -0.0228 |
| 83699 | SH3BGRL2 | A014-C-040 | Human | Colorectum | FAP | 2.86e-03 | -4.07e-01 | -0.1184 |
| 83699 | SH3BGRL2 | A002-C-201 | Human | Colorectum | FAP | 1.60e-10 | -2.54e-01 | 0.0324 |
| 83699 | SH3BGRL2 | A001-C-119 | Human | Colorectum | FAP | 9.05e-11 | -4.40e-01 | -0.1557 |
| 83699 | SH3BGRL2 | A001-C-108 | Human | Colorectum | FAP | 1.76e-15 | -3.35e-01 | -0.0272 |
| 83699 | SH3BGRL2 | A002-C-205 | Human | Colorectum | FAP | 2.65e-17 | -4.08e-01 | -0.1236 |
| 83699 | SH3BGRL2 | A001-C-104 | Human | Colorectum | FAP | 1.26e-03 | -1.87e-01 | 0.0184 |
| 83699 | SH3BGRL2 | A015-C-005 | Human | Colorectum | FAP | 3.08e-05 | -2.75e-01 | -0.0336 |
| 83699 | SH3BGRL2 | A015-C-006 | Human | Colorectum | FAP | 1.43e-13 | -4.65e-01 | -0.0994 |
| 83699 | SH3BGRL2 | A015-C-106 | Human | Colorectum | FAP | 9.02e-08 | -2.92e-01 | -0.0511 |
| 83699 | SH3BGRL2 | A002-C-114 | Human | Colorectum | FAP | 4.75e-14 | -3.52e-01 | -0.1561 |
| 83699 | SH3BGRL2 | A015-C-104 | Human | Colorectum | FAP | 1.52e-22 | -3.91e-01 | -0.1899 |
| 83699 | SH3BGRL2 | A001-C-014 | Human | Colorectum | FAP | 5.11e-11 | -1.88e-01 | 0.0135 |
| Page: 1 2 3 |
| Tissue | Expression Dynamics | Abbreviation |
| Colorectum (GSE201348) |  | FAP: Familial adenomatous polyposis |
| CRC: Colorectal cancer | ||
| Colorectum (HTA11) |  | AD: Adenomas |
| SER: Sessile serrated lesions | ||
| MSI-H: Microsatellite-high colorectal cancer | ||
| MSS: Microsatellite stable colorectal cancer | ||
| Liver |  | HCC: Hepatocellular carcinoma |
| NAFLD: Non-alcoholic fatty liver disease | ||
| Thyroid | 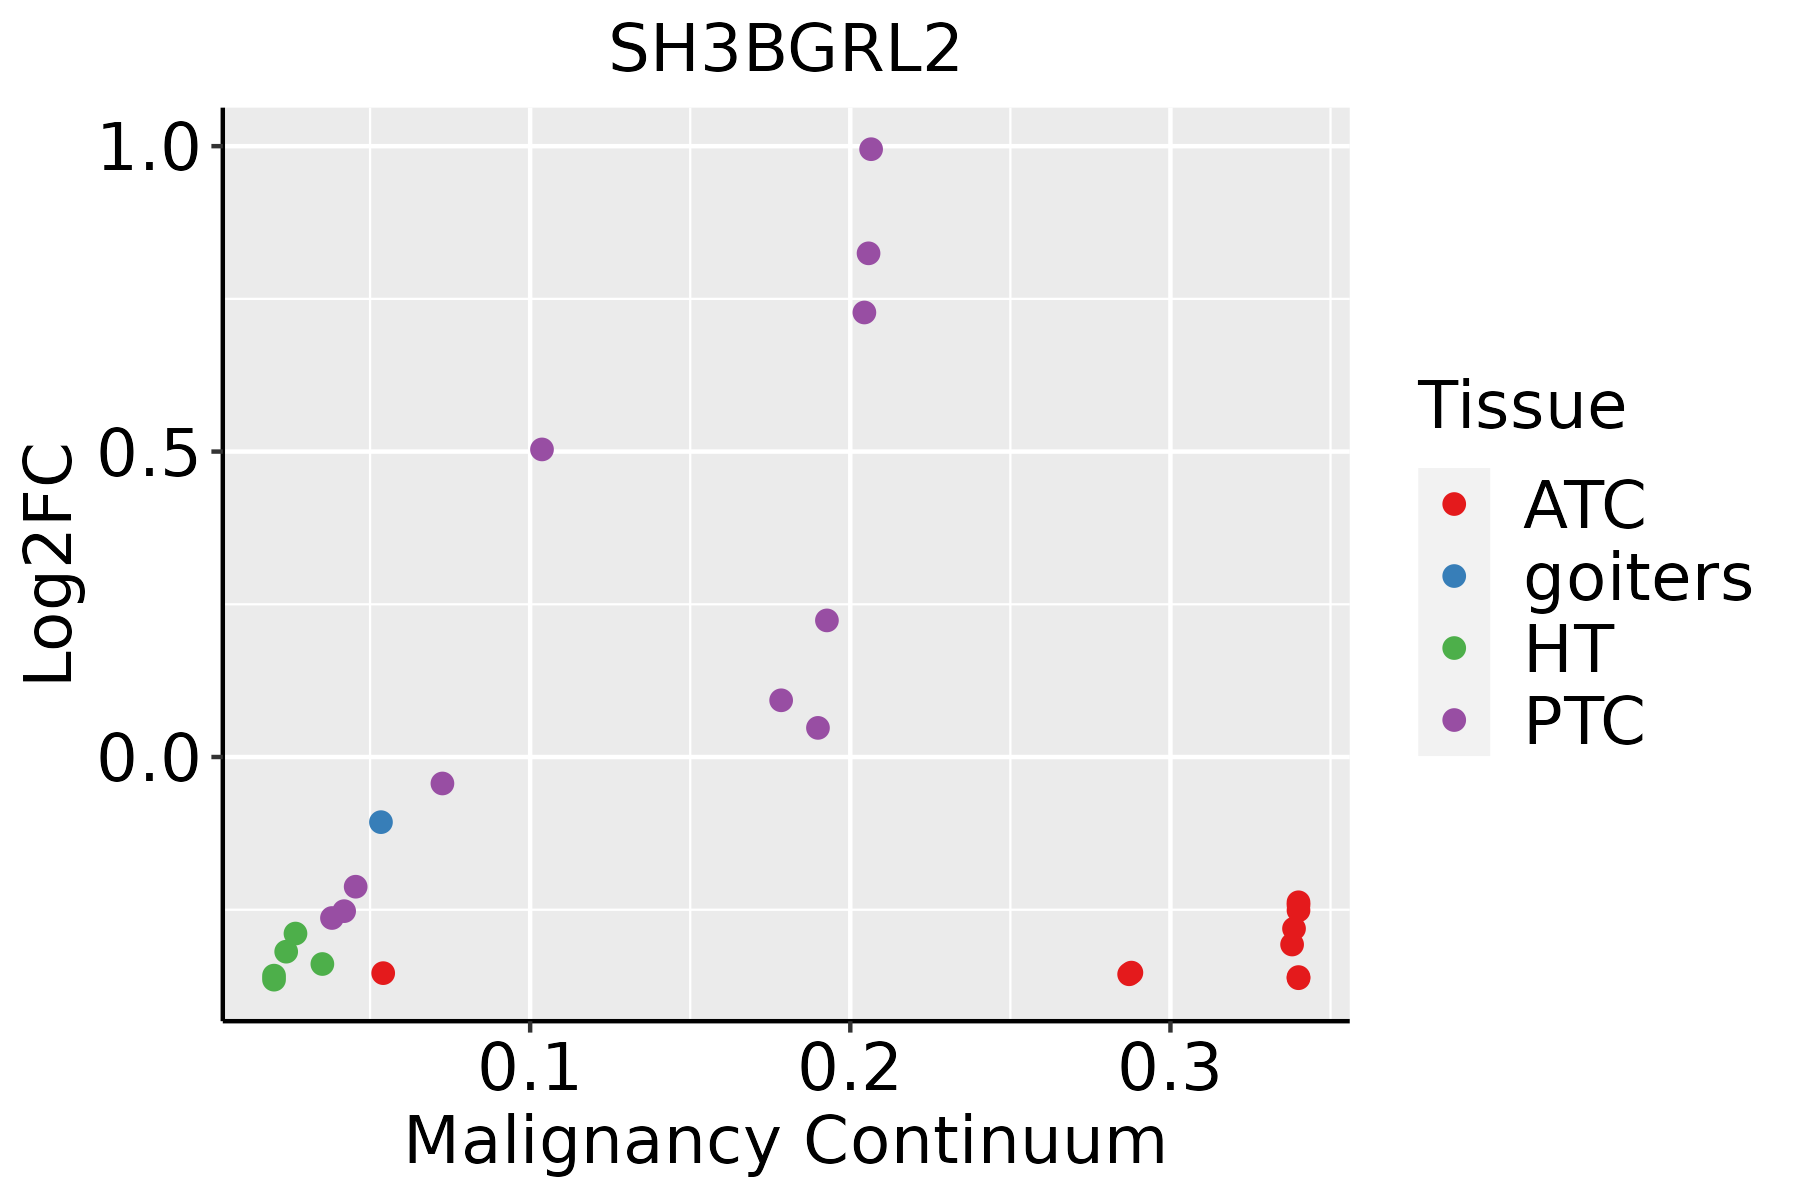 | ATC: Anaplastic thyroid cancer |
| HT: Hashimoto's thyroiditis | ||
| PTC: Papillary thyroid cancer |
| ∗log2FC in expression of this searched gene in stem-like cells from each diseased tissue sample relative to stem-like cells in normal samples in each tissue plotted against the malignancy continuum. Samples are colored based on if they are from different disease stage. |
Top |
Malignant transformation related pathway analysis |
| Find out the enriched GO biological processes and KEGG pathways involved in transition from healthy to precancer to cancer |
| Tissue | Disease Stage | Enriched GO biological Processes |
| Colorectum | AD |  |
| Colorectum | SER |  |
| Colorectum | MSS |  |
| Colorectum | MSI-H |  |
| Colorectum | FAP |  |
| ∗Top 15 enriched GO BP terms are showed in the bar plot of each disease state in each tissue. Each row represents a significant GO biological process which is colored according to the -log10(p.adjust). |
| Page: 1 2 3 4 5 6 7 8 9 |
| GO ID | Tissue | Disease Stage | Description | Gene Ratio | Bg Ratio | pvalue | p.adjust | Count |
| Page: 1 |
| Pathway ID | Tissue | Disease Stage | Description | Gene Ratio | Bg Ratio | pvalue | p.adjust | qvalue | Count |
| Page: 1 |
Top |
Cell-cell communication analysis |
| Identification of potential cell-cell interactions between two cell types and their ligand-receptor pairs for different disease states |
| Ligand | Receptor | LRpair | Pathway | Tissue | Disease Stage |
| Page: 1 |
Top |
Single-cell gene regulatory network inference analysis |
| Find out the significant the regulons (TFs) and the target genes of each regulon across cell types for different disease states |
| TF | Cell Type | Tissue | Disease Stage | Target Gene | RSS | Regulon Activity |
| ∗The dot plots of a searched regulon are shown for all cell subpopulations in each disease state of each tissue based on the regulon specific score inferred using pySCENIC and by calculating the average expression. |
| Page: 1 |
Top |
Somatic mutation of malignant transformation related genes |
| Annotation of somatic variants for genes involved in malignant transformation |
| Hugo Symbol | Variant Class | Variant Classification | dbSNP RS | HGVSc | HGVSp | HGVSp Short | SWISSPROT | BIOTYPE | SIFT | PolyPhen | Tumor Sample Barcode | Tissue | Histology | Sex | Age | Stage | Therapy Types | Drugs | Outcome |
| SH3BGRL2 | SNV | Missense_Mutation | rs371878206 | c.157N>A | p.Val53Ile | p.V53I | Q9UJC5 | protein_coding | tolerated(0.69) | benign(0) | TCGA-BH-A0B3-01 | Breast | breast invasive carcinoma | Female | <65 | I/II | Chemotherapy | cyclophosphamide | SD |
| SH3BGRL2 | SNV | Missense_Mutation | c.217N>A | p.Asp73Asn | p.D73N | Q9UJC5 | protein_coding | tolerated(0.1) | benign(0.101) | TCGA-F4-6703-01 | Colorectum | colon adenocarcinoma | Male | <65 | I/II | Unknown | Unknown | SD | |
| SH3BGRL2 | deletion | Frame_Shift_Del | c.164delC | p.Pro55ArgfsTer41 | p.P55Rfs*41 | Q9UJC5 | protein_coding | TCGA-D5-6930-01 | Colorectum | colon adenocarcinoma | Male | >=65 | I/II | Unknown | Unknown | SD | |||
| SH3BGRL2 | deletion | Frame_Shift_Del | c.164delC | p.Pro55ArgfsTer41 | p.P55Rfs*41 | Q9UJC5 | protein_coding | TCGA-G4-6628-01 | Colorectum | colon adenocarcinoma | Male | >=65 | I/II | Unknown | Unknown | SD | |||
| SH3BGRL2 | SNV | Missense_Mutation | rs371878206 | c.157N>A | p.Val53Ile | p.V53I | Q9UJC5 | protein_coding | tolerated(0.69) | benign(0) | TCGA-AP-A05O-01 | Endometrium | uterine corpus endometrioid carcinoma | Female | >=65 | I/II | Chemotherapy | carboplatin | PD |
| SH3BGRL2 | SNV | Missense_Mutation | novel | c.148N>C | p.Tyr50His | p.Y50H | Q9UJC5 | protein_coding | deleterious(0.05) | probably_damaging(0.982) | TCGA-EO-A22U-01 | Endometrium | uterine corpus endometrioid carcinoma | Female | >=65 | I/II | Unknown | Unknown | SD |
| SH3BGRL2 | SNV | Missense_Mutation | novel | c.182N>C | p.Gln61Pro | p.Q61P | Q9UJC5 | protein_coding | tolerated(0.32) | possibly_damaging(0.825) | TCGA-05-4420-01 | Lung | lung adenocarcinoma | Male | <65 | I/II | Unknown | Unknown | SD |
| SH3BGRL2 | SNV | Missense_Mutation | rs778281298 | c.181N>A | p.Gln61Lys | p.Q61K | Q9UJC5 | protein_coding | tolerated(0.44) | benign(0.038) | TCGA-55-7727-01 | Lung | lung adenocarcinoma | Male | >=65 | III/IV | Unknown | Unknown | SD |
| SH3BGRL2 | SNV | Missense_Mutation | novel | c.163N>A | p.Pro55Thr | p.P55T | Q9UJC5 | protein_coding | tolerated(0.41) | benign(0.007) | TCGA-77-7335-01 | Lung | lung squamous cell carcinoma | Female | <65 | III/IV | Unknown | Unknown | SD |
| SH3BGRL2 | SNV | Missense_Mutation | c.181C>G | p.Gln61Glu | p.Q61E | Q9UJC5 | protein_coding | tolerated(0.29) | benign(0.334) | TCGA-CQ-6221-01 | Oral cavity | head & neck squamous cell carcinoma | Male | >=65 | I/II | Unknown | Unknown | SD |
| Page: 1 2 |
Top |
Related drugs of malignant transformation related genes |
| Identification of chemicals and drugs interact with genes involved in malignant transfromation |
| (DGIdb 4.0) |
| Entrez ID | Symbol | Category | Interaction Types | Drug Claim Name | Drug Name | PMIDs |
| Page: 1 |

Copyright 2023-Present -The University of Texas Health Science Center at Houston |