
|
|||||
|
 | |
| |
| |
| |
| |
| |
|
Gene: SH2D2A |
Gene summary for SH2D2A |
| Gene information | Species | Human | Gene symbol | SH2D2A | Gene ID | 9047 |
| Gene name | SH2 domain containing 2A | |
| Gene Alias | F2771 | |
| Cytomap | 1q23.1 | |
| Gene Type | protein-coding | GO ID | GO:0001525 | UniProtAcc | Q5UBZ2 |
Top |
Malignant transformation analysis |
| Identification of the aberrant gene expression in precancerous and cancerous lesions by comparing the gene expression of stem-like cells in diseased tissues with normal stem cells |
| Entrez ID | Symbol | Replicates | Species | Organ | Tissue | Adj P-value | Log2FC | Malignancy |
| 9047 | SH2D2A | LZE4T | Human | Esophagus | ESCC | 1.33e-04 | 2.28e-01 | 0.0811 |
| 9047 | SH2D2A | LZE7T | Human | Esophagus | ESCC | 1.94e-06 | 4.11e-01 | 0.0667 |
| 9047 | SH2D2A | LZE24T | Human | Esophagus | ESCC | 1.72e-04 | 1.10e-01 | 0.0596 |
| 9047 | SH2D2A | LZE6T | Human | Esophagus | ESCC | 5.94e-27 | 1.08e+00 | 0.0845 |
| 9047 | SH2D2A | P2T-E | Human | Esophagus | ESCC | 6.39e-06 | 2.17e-01 | 0.1177 |
| 9047 | SH2D2A | P4T-E | Human | Esophagus | ESCC | 3.88e-03 | 1.11e-01 | 0.1323 |
| 9047 | SH2D2A | P5T-E | Human | Esophagus | ESCC | 1.54e-04 | 1.36e-01 | 0.1327 |
| 9047 | SH2D2A | P16T-E | Human | Esophagus | ESCC | 7.62e-07 | 1.63e-01 | 0.1153 |
| 9047 | SH2D2A | P17T-E | Human | Esophagus | ESCC | 1.32e-08 | 5.43e-01 | 0.1278 |
| 9047 | SH2D2A | P19T-E | Human | Esophagus | ESCC | 4.46e-04 | 8.53e-01 | 0.1662 |
| 9047 | SH2D2A | P21T-E | Human | Esophagus | ESCC | 6.85e-09 | 2.73e-01 | 0.1617 |
| 9047 | SH2D2A | P22T-E | Human | Esophagus | ESCC | 1.49e-14 | 2.87e-01 | 0.1236 |
| 9047 | SH2D2A | P23T-E | Human | Esophagus | ESCC | 9.40e-11 | 3.26e-01 | 0.108 |
| 9047 | SH2D2A | P24T-E | Human | Esophagus | ESCC | 2.83e-20 | 6.27e-01 | 0.1287 |
| 9047 | SH2D2A | P26T-E | Human | Esophagus | ESCC | 3.49e-03 | 7.47e-02 | 0.1276 |
| 9047 | SH2D2A | P28T-E | Human | Esophagus | ESCC | 1.85e-18 | 3.44e-01 | 0.1149 |
| 9047 | SH2D2A | P32T-E | Human | Esophagus | ESCC | 2.85e-03 | 9.92e-02 | 0.1666 |
| 9047 | SH2D2A | P36T-E | Human | Esophagus | ESCC | 3.15e-10 | 4.69e-01 | 0.1187 |
| 9047 | SH2D2A | P37T-E | Human | Esophagus | ESCC | 2.47e-13 | 3.74e-01 | 0.1371 |
| 9047 | SH2D2A | P47T-E | Human | Esophagus | ESCC | 8.06e-03 | 6.86e-02 | 0.1067 |
| Page: 1 2 3 |
| Tissue | Expression Dynamics | Abbreviation |
| Esophagus | 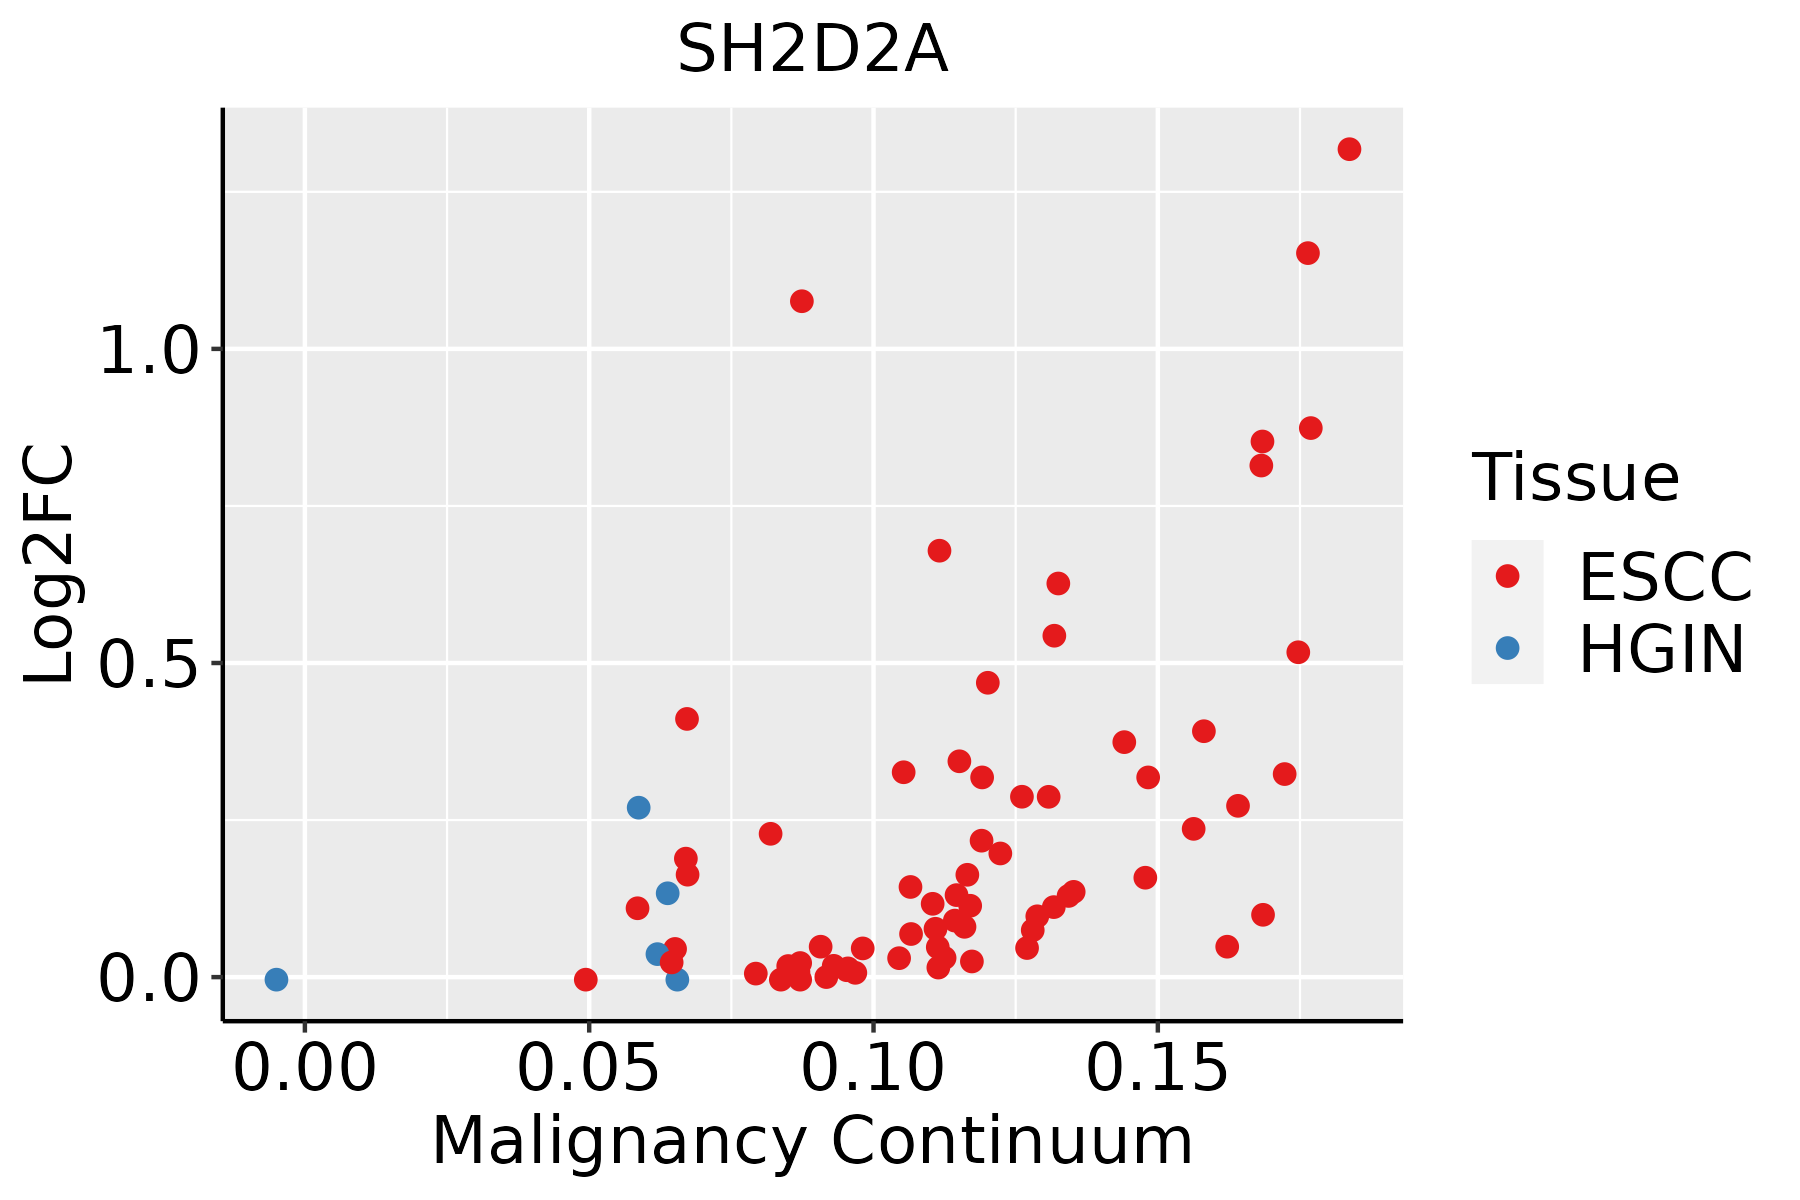 | ESCC: Esophageal squamous cell carcinoma |
| HGIN: High-grade intraepithelial neoplasias | ||
| LGIN: Low-grade intraepithelial neoplasias | ||
| Oral Cavity |  | EOLP: Erosive Oral lichen planus |
| LP: leukoplakia | ||
| NEOLP: Non-erosive oral lichen planus | ||
| OSCC: Oral squamous cell carcinoma |
| ∗log2FC in expression of this searched gene in stem-like cells from each diseased tissue sample relative to stem-like cells in normal samples in each tissue plotted against the malignancy continuum. Samples are colored based on if they are from different disease stage. |
Top |
Malignant transformation related pathway analysis |
| Find out the enriched GO biological processes and KEGG pathways involved in transition from healthy to precancer to cancer |
| Tissue | Disease Stage | Enriched GO biological Processes |
| Colorectum | AD |  |
| Colorectum | SER |  |
| Colorectum | MSS |  |
| Colorectum | MSI-H |  |
| Colorectum | FAP |  |
| ∗Top 15 enriched GO BP terms are showed in the bar plot of each disease state in each tissue. Each row represents a significant GO biological process which is colored according to the -log10(p.adjust). |
| Page: 1 2 3 4 5 6 7 8 9 |
| GO ID | Tissue | Disease Stage | Description | Gene Ratio | Bg Ratio | pvalue | p.adjust | Count |
| Page: 1 |
| Pathway ID | Tissue | Disease Stage | Description | Gene Ratio | Bg Ratio | pvalue | p.adjust | qvalue | Count |
| hsa04370 | Oral cavity | OSCC | VEGF signaling pathway | 37/3704 | 59/8465 | 2.53e-03 | 6.62e-03 | 3.37e-03 | 37 |
| hsa043701 | Oral cavity | OSCC | VEGF signaling pathway | 37/3704 | 59/8465 | 2.53e-03 | 6.62e-03 | 3.37e-03 | 37 |
| Page: 1 |
Top |
Cell-cell communication analysis |
| Identification of potential cell-cell interactions between two cell types and their ligand-receptor pairs for different disease states |
| Ligand | Receptor | LRpair | Pathway | Tissue | Disease Stage |
| Page: 1 |
Top |
Single-cell gene regulatory network inference analysis |
| Find out the significant the regulons (TFs) and the target genes of each regulon across cell types for different disease states |
| TF | Cell Type | Tissue | Disease Stage | Target Gene | RSS | Regulon Activity |
| ∗The dot plots of a searched regulon are shown for all cell subpopulations in each disease state of each tissue based on the regulon specific score inferred using pySCENIC and by calculating the average expression. |
| Page: 1 |
Top |
Somatic mutation of malignant transformation related genes |
| Annotation of somatic variants for genes involved in malignant transformation |
| Hugo Symbol | Variant Class | Variant Classification | dbSNP RS | HGVSc | HGVSp | HGVSp Short | SWISSPROT | BIOTYPE | SIFT | PolyPhen | Tumor Sample Barcode | Tissue | Histology | Sex | Age | Stage | Therapy Types | Drugs | Outcome |
| SH2D2A | SNV | Missense_Mutation | c.397G>A | p.Glu133Lys | p.E133K | Q9NP31 | protein_coding | deleterious(0) | probably_damaging(0.99) | TCGA-AC-A23H-01 | Breast | breast invasive carcinoma | Female | >=65 | I/II | Unknown | Unknown | PD | |
| SH2D2A | SNV | Missense_Mutation | c.1164N>C | p.Arg388Ser | p.R388S | Q9NP31 | protein_coding | deleterious_low_confidence(0) | benign(0.297) | TCGA-AO-A128-01 | Breast | breast invasive carcinoma | Female | <65 | I/II | Chemotherapy | doxorubicin | SD | |
| SH2D2A | SNV | Missense_Mutation | rs202237236 | c.1111N>A | p.Ala371Thr | p.A371T | Q9NP31 | protein_coding | tolerated_low_confidence(0.3) | benign(0.027) | TCGA-C5-A7CL-01 | Cervix | cervical & endocervical cancer | Female | <65 | III/IV | Chemotherapy | cisplatin | PD |
| SH2D2A | SNV | Missense_Mutation | c.373G>T | p.Gly125Trp | p.G125W | Q9NP31 | protein_coding | deleterious(0) | probably_damaging(1) | TCGA-AA-3710-01 | Colorectum | colon adenocarcinoma | Female | >=65 | I/II | Unknown | Unknown | SD | |
| SH2D2A | SNV | Missense_Mutation | c.725N>G | p.Glu242Gly | p.E242G | Q9NP31 | protein_coding | deleterious(0) | benign(0.439) | TCGA-AZ-6598-01 | Colorectum | colon adenocarcinoma | Female | >=65 | I/II | Unknown | Unknown | SD | |
| SH2D2A | SNV | Missense_Mutation | c.911G>C | p.Arg304Pro | p.R304P | Q9NP31 | protein_coding | deleterious(0) | possibly_damaging(0.906) | TCGA-AJ-A3BH-01 | Endometrium | uterine corpus endometrioid carcinoma | Female | Unknown | I/II | Unknown | Unknown | SD | |
| SH2D2A | SNV | Missense_Mutation | c.626N>T | p.Arg209Met | p.R209M | Q9NP31 | protein_coding | deleterious(0.03) | possibly_damaging(0.855) | TCGA-AP-A0LM-01 | Endometrium | uterine corpus endometrioid carcinoma | Female | <65 | III/IV | Chemotherapy | cisplatin | SD | |
| SH2D2A | SNV | Missense_Mutation | novel | c.511N>T | p.Ala171Ser | p.A171S | Q9NP31 | protein_coding | tolerated(0.21) | benign(0.023) | TCGA-AP-A1DK-01 | Endometrium | uterine corpus endometrioid carcinoma | Female | <65 | I/II | Unknown | Unknown | SD |
| SH2D2A | SNV | Missense_Mutation | novel | c.1039G>T | p.Gly347Cys | p.G347C | Q9NP31 | protein_coding | deleterious(0.02) | benign(0.204) | TCGA-AX-A1CE-01 | Endometrium | uterine corpus endometrioid carcinoma | Female | <65 | I/II | Unspecific | Paclitaxel | SD |
| SH2D2A | SNV | Missense_Mutation | novel | c.632A>G | p.Glu211Gly | p.E211G | Q9NP31 | protein_coding | deleterious(0.04) | benign(0.44) | TCGA-B5-A3FC-01 | Endometrium | uterine corpus endometrioid carcinoma | Female | <65 | I/II | Unknown | Unknown | SD |
| Page: 1 2 3 4 |
Top |
Related drugs of malignant transformation related genes |
| Identification of chemicals and drugs interact with genes involved in malignant transfromation |
| (DGIdb 4.0) |
| Entrez ID | Symbol | Category | Interaction Types | Drug Claim Name | Drug Name | PMIDs |
| Page: 1 |

Copyright 2023-Present -The University of Texas Health Science Center at Houston |