
|
|||||
|
 | |
| |
| |
| |
| |
| |
|
Gene: SH2B3 |
Gene summary for SH2B3 |
| Gene information | Species | Human | Gene symbol | SH2B3 | Gene ID | 10019 |
| Gene name | SH2B adaptor protein 3 | |
| Gene Alias | IDDM20 | |
| Cytomap | 12q24.12 | |
| Gene Type | protein-coding | GO ID | GO:0000165 | UniProtAcc | B7Z7K6 |
Top |
Malignant transformation analysis |
| Identification of the aberrant gene expression in precancerous and cancerous lesions by comparing the gene expression of stem-like cells in diseased tissues with normal stem cells |
| Entrez ID | Symbol | Replicates | Species | Organ | Tissue | Adj P-value | Log2FC | Malignancy |
| 10019 | SH2B3 | HCC1_Meng | Human | Liver | HCC | 2.36e-10 | 3.63e-02 | 0.0246 |
| 10019 | SH2B3 | HCC2 | Human | Liver | HCC | 2.53e-05 | 1.45e+00 | 0.5341 |
| 10019 | SH2B3 | Pt13.b | Human | Liver | HCC | 4.65e-07 | 2.04e-01 | 0.0251 |
| 10019 | SH2B3 | S027 | Human | Liver | HCC | 6.28e-07 | 5.44e-01 | 0.2446 |
| 10019 | SH2B3 | S028 | Human | Liver | HCC | 6.29e-12 | 5.15e-01 | 0.2503 |
| 10019 | SH2B3 | S029 | Human | Liver | HCC | 1.37e-13 | 6.61e-01 | 0.2581 |
| 10019 | SH2B3 | C21 | Human | Oral cavity | OSCC | 3.86e-06 | 1.94e-01 | 0.2678 |
| 10019 | SH2B3 | C30 | Human | Oral cavity | OSCC | 5.85e-11 | 5.17e-01 | 0.3055 |
| 10019 | SH2B3 | C38 | Human | Oral cavity | OSCC | 3.33e-03 | 4.37e-01 | 0.172 |
| 10019 | SH2B3 | C43 | Human | Oral cavity | OSCC | 1.34e-03 | 9.16e-02 | 0.1704 |
| 10019 | SH2B3 | EOLP-1 | Human | Oral cavity | EOLP | 1.25e-21 | 5.08e-01 | -0.0202 |
| 10019 | SH2B3 | SYSMH5 | Human | Oral cavity | OSCC | 1.51e-03 | 6.66e-02 | 0.0647 |
| Page: 1 |
| Tissue | Expression Dynamics | Abbreviation |
| Liver | 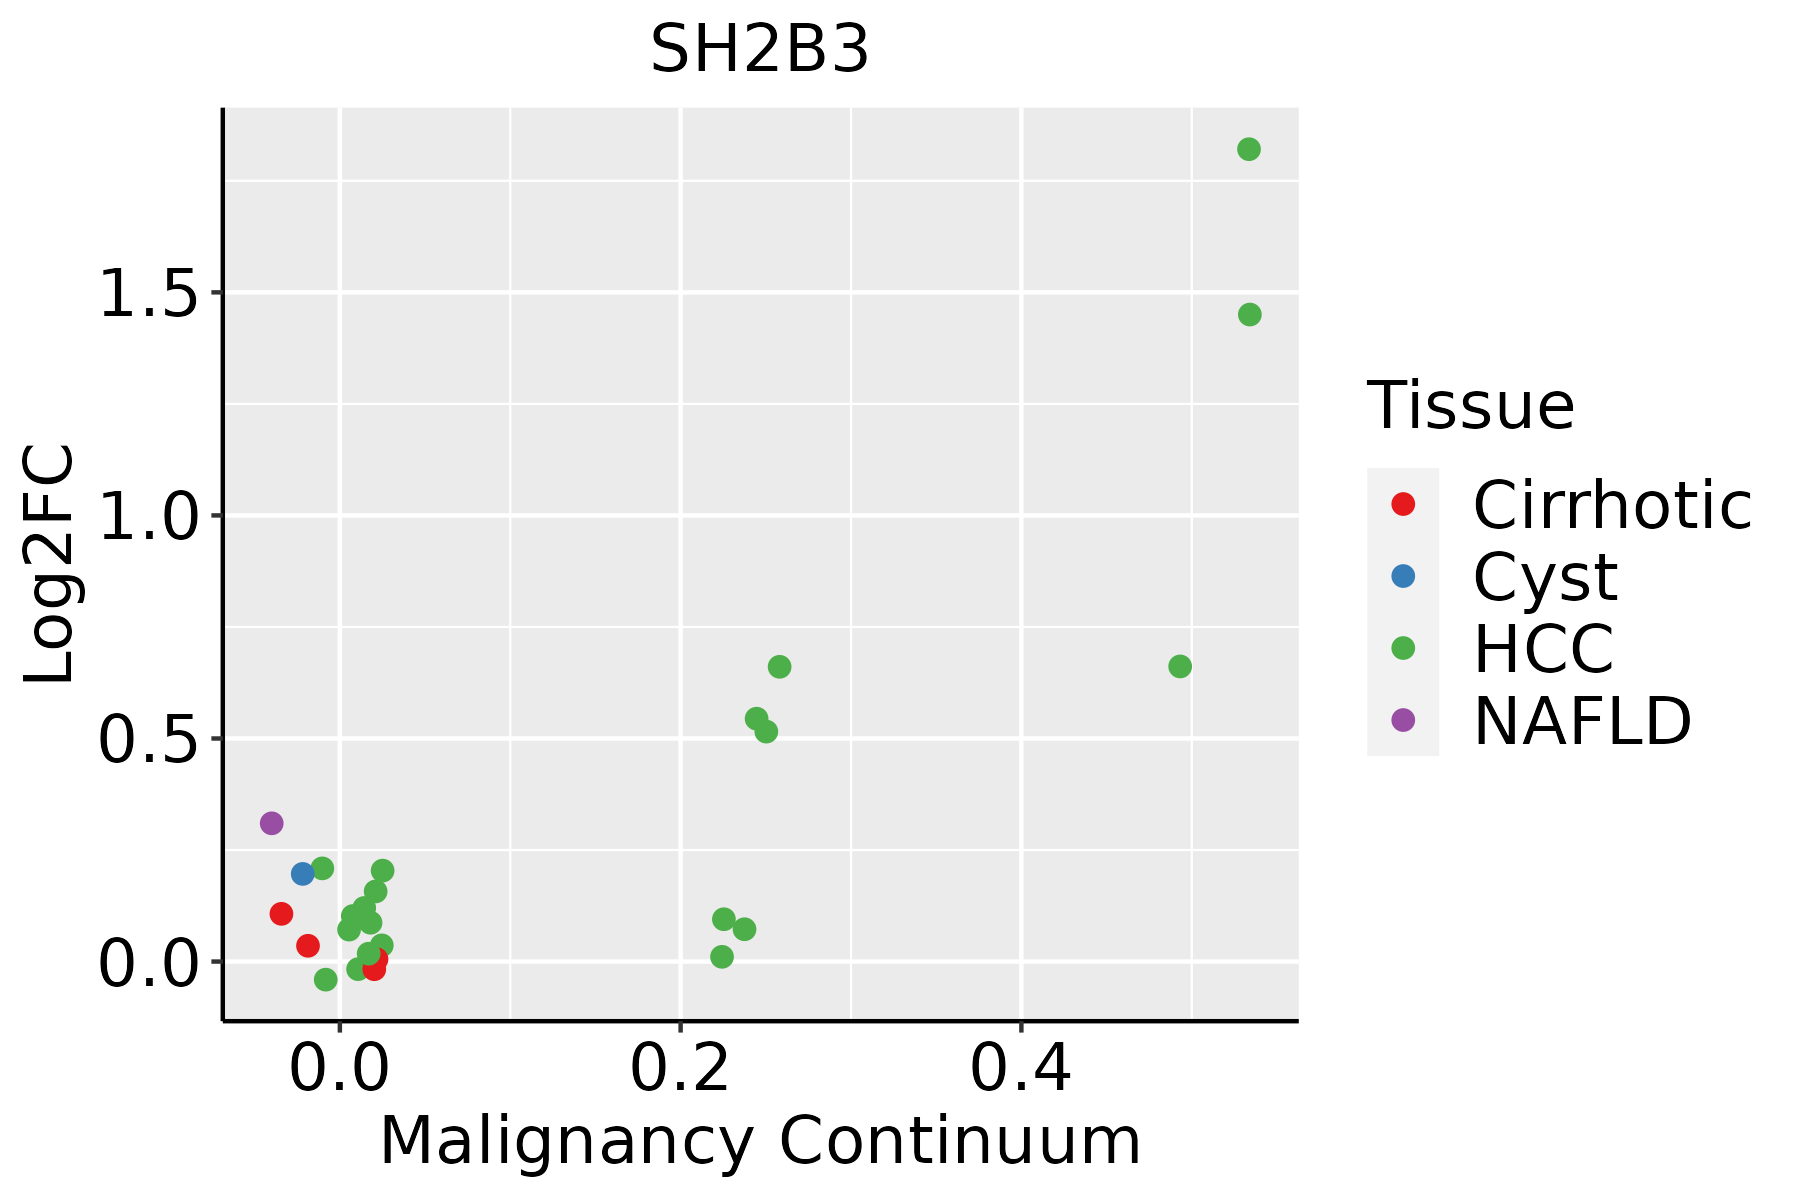 | HCC: Hepatocellular carcinoma |
| NAFLD: Non-alcoholic fatty liver disease | ||
| Oral Cavity | 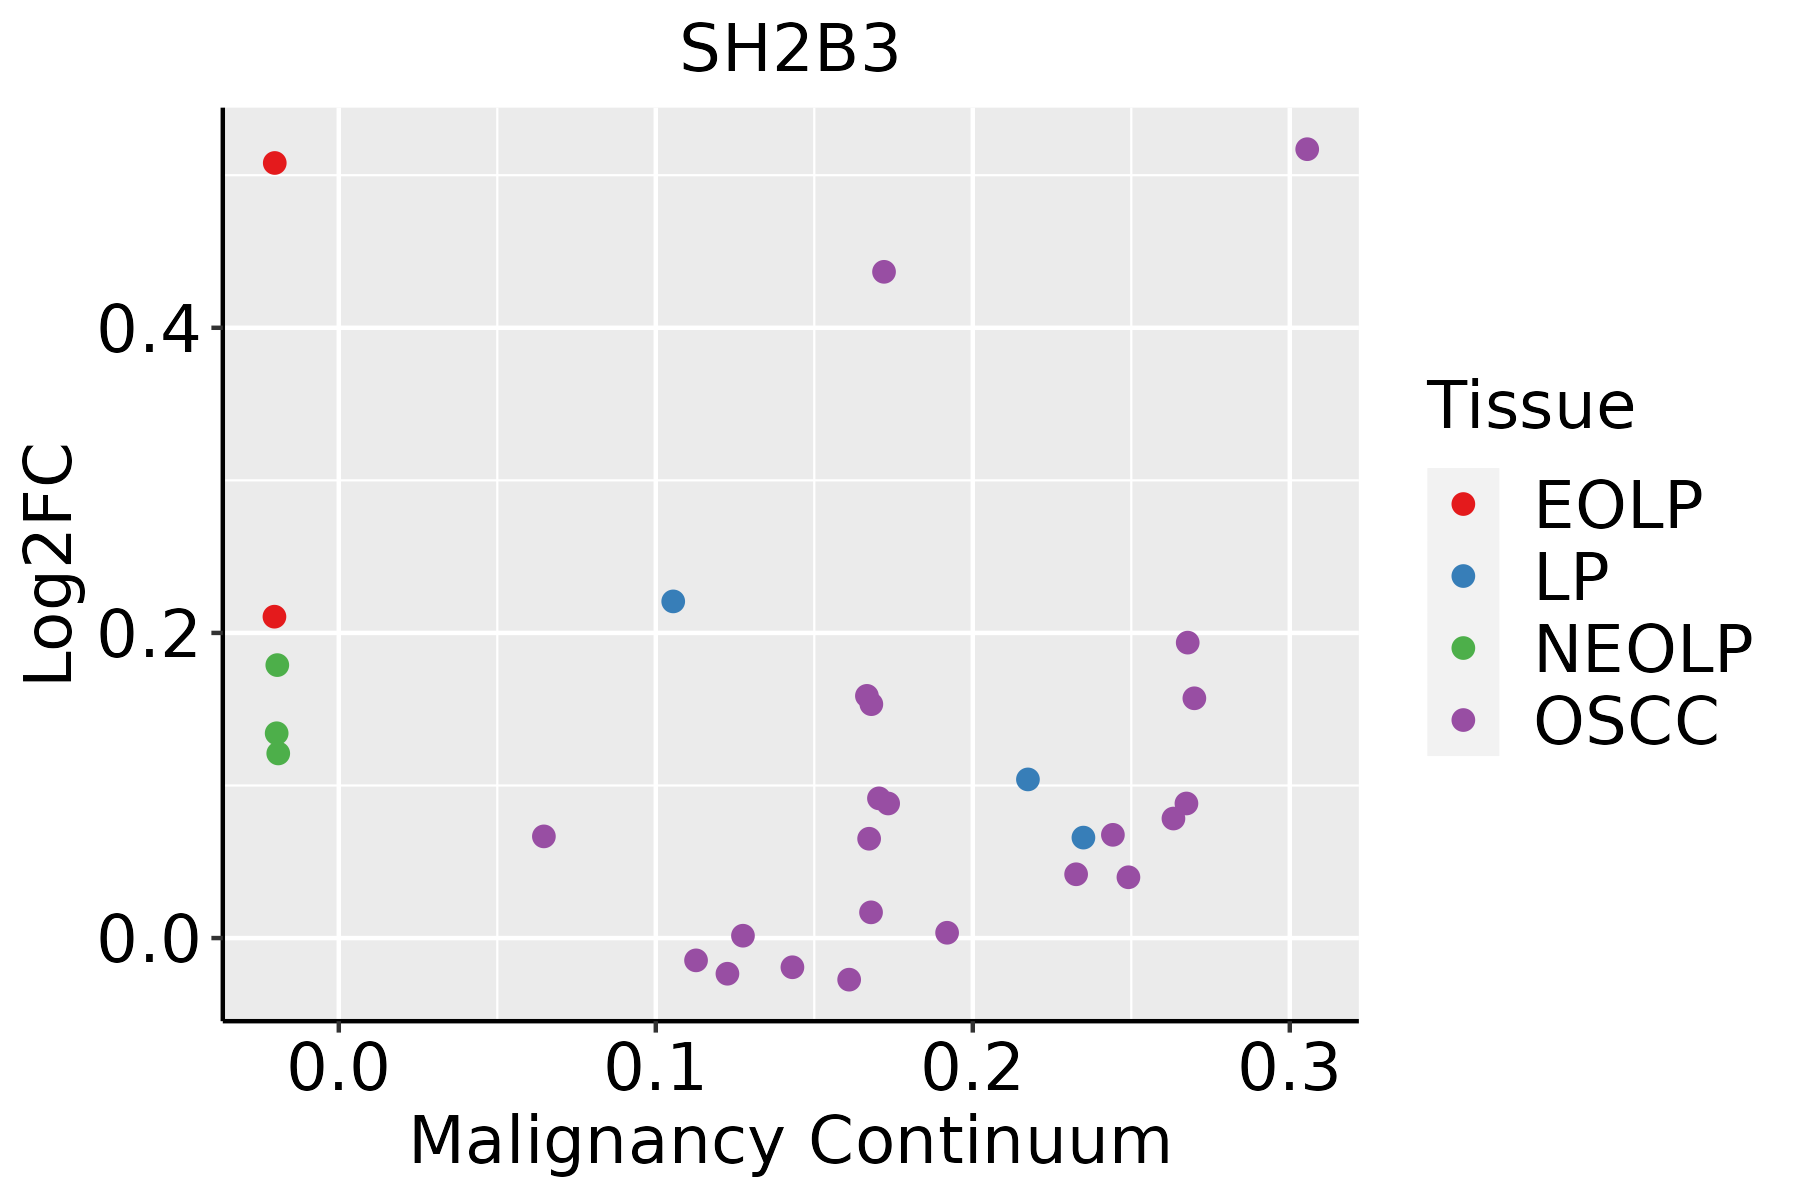 | EOLP: Erosive Oral lichen planus |
| LP: leukoplakia | ||
| NEOLP: Non-erosive oral lichen planus | ||
| OSCC: Oral squamous cell carcinoma |
| ∗log2FC in expression of this searched gene in stem-like cells from each diseased tissue sample relative to stem-like cells in normal samples in each tissue plotted against the malignancy continuum. Samples are colored based on if they are from different disease stage. |
Top |
Malignant transformation related pathway analysis |
| Find out the enriched GO biological processes and KEGG pathways involved in transition from healthy to precancer to cancer |
| Tissue | Disease Stage | Enriched GO biological Processes |
| Colorectum | AD |  |
| Colorectum | SER |  |
| Colorectum | MSS |  |
| Colorectum | MSI-H |  |
| Colorectum | FAP |  |
| ∗Top 15 enriched GO BP terms are showed in the bar plot of each disease state in each tissue. Each row represents a significant GO biological process which is colored according to the -log10(p.adjust). |
| Page: 1 2 3 4 5 6 7 8 9 |
| GO ID | Tissue | Disease Stage | Description | Gene Ratio | Bg Ratio | pvalue | p.adjust | Count |
| GO:001056322 | Liver | HCC | negative regulation of phosphorus metabolic process | 259/7958 | 442/18723 | 4.29e-12 | 1.92e-10 | 259 |
| GO:004593622 | Liver | HCC | negative regulation of phosphate metabolic process | 258/7958 | 441/18723 | 6.00e-12 | 2.60e-10 | 258 |
| GO:004232622 | Liver | HCC | negative regulation of phosphorylation | 227/7958 | 385/18723 | 3.98e-11 | 1.52e-09 | 227 |
| GO:005134822 | Liver | HCC | negative regulation of transferase activity | 166/7958 | 268/18723 | 8.97e-11 | 3.18e-09 | 166 |
| GO:003367322 | Liver | HCC | negative regulation of kinase activity | 144/7958 | 237/18723 | 9.76e-09 | 2.45e-07 | 144 |
| GO:000193322 | Liver | HCC | negative regulation of protein phosphorylation | 196/7958 | 342/18723 | 1.95e-08 | 4.63e-07 | 196 |
| GO:000646912 | Liver | HCC | negative regulation of protein kinase activity | 126/7958 | 212/18723 | 4.55e-07 | 7.49e-06 | 126 |
| GO:00301932 | Liver | HCC | regulation of blood coagulation | 46/7958 | 66/18723 | 7.12e-06 | 8.47e-05 | 46 |
| GO:003410122 | Liver | HCC | erythrocyte homeostasis | 79/7958 | 129/18723 | 1.32e-05 | 1.47e-04 | 79 |
| GO:000226222 | Liver | HCC | myeloid cell homeostasis | 93/7958 | 157/18723 | 1.67e-05 | 1.81e-04 | 93 |
| GO:19000462 | Liver | HCC | regulation of hemostasis | 46/7958 | 68/18723 | 2.43e-05 | 2.56e-04 | 46 |
| GO:003021812 | Liver | HCC | erythrocyte differentiation | 73/7958 | 120/18723 | 3.82e-05 | 3.80e-04 | 73 |
| GO:003009922 | Liver | HCC | myeloid cell differentiation | 200/7958 | 381/18723 | 4.64e-05 | 4.49e-04 | 200 |
| GO:00508182 | Liver | HCC | regulation of coagulation | 47/7958 | 71/18723 | 4.68e-05 | 4.50e-04 | 47 |
| GO:004206022 | Liver | HCC | wound healing | 219/7958 | 422/18723 | 5.34e-05 | 5.04e-04 | 219 |
| GO:007190021 | Liver | HCC | regulation of protein serine/threonine kinase activity | 189/7958 | 359/18723 | 5.97e-05 | 5.47e-04 | 189 |
| GO:004887222 | Liver | HCC | homeostasis of number of cells | 147/7958 | 272/18723 | 7.48e-05 | 6.70e-04 | 147 |
| GO:006104122 | Liver | HCC | regulation of wound healing | 78/7958 | 134/18723 | 1.73e-04 | 1.36e-03 | 78 |
| GO:190303421 | Liver | HCC | regulation of response to wounding | 94/7958 | 167/18723 | 2.19e-04 | 1.66e-03 | 94 |
| GO:00075962 | Liver | HCC | blood coagulation | 118/7958 | 217/18723 | 2.63e-04 | 1.94e-03 | 118 |
| Page: 1 2 3 4 5 6 7 |
| Pathway ID | Tissue | Disease Stage | Description | Gene Ratio | Bg Ratio | pvalue | p.adjust | qvalue | Count |
| hsa0472210 | Liver | HCC | Neurotrophin signaling pathway | 74/4020 | 119/8465 | 8.27e-04 | 3.26e-03 | 1.81e-03 | 74 |
| hsa0472211 | Liver | HCC | Neurotrophin signaling pathway | 74/4020 | 119/8465 | 8.27e-04 | 3.26e-03 | 1.81e-03 | 74 |
| hsa0472220 | Oral cavity | OSCC | Neurotrophin signaling pathway | 74/3704 | 119/8465 | 3.55e-05 | 1.49e-04 | 7.58e-05 | 74 |
| hsa04722110 | Oral cavity | OSCC | Neurotrophin signaling pathway | 74/3704 | 119/8465 | 3.55e-05 | 1.49e-04 | 7.58e-05 | 74 |
| hsa0472242 | Oral cavity | EOLP | Neurotrophin signaling pathway | 36/1218 | 119/8465 | 6.23e-06 | 3.87e-05 | 2.28e-05 | 36 |
| hsa0472252 | Oral cavity | EOLP | Neurotrophin signaling pathway | 36/1218 | 119/8465 | 6.23e-06 | 3.87e-05 | 2.28e-05 | 36 |
| Page: 1 |
Top |
Cell-cell communication analysis |
| Identification of potential cell-cell interactions between two cell types and their ligand-receptor pairs for different disease states |
| Ligand | Receptor | LRpair | Pathway | Tissue | Disease Stage |
| Page: 1 |
Top |
Single-cell gene regulatory network inference analysis |
| Find out the significant the regulons (TFs) and the target genes of each regulon across cell types for different disease states |
| TF | Cell Type | Tissue | Disease Stage | Target Gene | RSS | Regulon Activity |
| ∗The dot plots of a searched regulon are shown for all cell subpopulations in each disease state of each tissue based on the regulon specific score inferred using pySCENIC and by calculating the average expression. |
| Page: 1 |
Top |
Somatic mutation of malignant transformation related genes |
| Annotation of somatic variants for genes involved in malignant transformation |
| Hugo Symbol | Variant Class | Variant Classification | dbSNP RS | HGVSc | HGVSp | HGVSp Short | SWISSPROT | BIOTYPE | SIFT | PolyPhen | Tumor Sample Barcode | Tissue | Histology | Sex | Age | Stage | Therapy Types | Drugs | Outcome |
| SH2B3 | SNV | Missense_Mutation | rs765614074 | c.1099G>A | p.Gly367Ser | p.G367S | Q9UQQ2 | protein_coding | deleterious(0) | probably_damaging(1) | TCGA-AN-A0AK-01 | Breast | breast invasive carcinoma | Female | >=65 | I/II | Unknown | Unknown | SD |
| SH2B3 | SNV | Missense_Mutation | rs559278672 | c.1192N>T | p.Arg398Cys | p.R398C | Q9UQQ2 | protein_coding | deleterious(0) | probably_damaging(0.997) | TCGA-BH-A0DS-01 | Breast | breast invasive carcinoma | Female | >=65 | III/IV | Chemotherapy | cyclophosphamide | SD |
| SH2B3 | insertion | In_Frame_Ins | novel | c.780_781insTTTGGGCTGCCTCTGCTTTCCATCCCT | p.Val260_Arg261insPheGlyLeuProLeuLeuSerIlePro | p.V260_R261insFGLPLLSIP | Q9UQQ2 | protein_coding | TCGA-A2-A0EX-01 | Breast | breast invasive carcinoma | Female | <65 | I/II | Hormone Therapy | tamoxiphen | SD | ||
| SH2B3 | SNV | Missense_Mutation | novel | c.56N>A | p.Pro19Gln | p.P19Q | Q9UQQ2 | protein_coding | deleterious(0.02) | benign(0.012) | TCGA-DS-A1OD-01 | Cervix | cervical & endocervical cancer | Female | <65 | I/II | Chemotherapy | cisplatin | SD |
| SH2B3 | SNV | Missense_Mutation | rs374482426 | c.1393G>A | p.Val465Ile | p.V465I | Q9UQQ2 | protein_coding | tolerated(0.84) | benign(0.069) | TCGA-AA-3947-01 | Colorectum | colon adenocarcinoma | Female | <65 | I/II | Unknown | Unknown | SD |
| SH2B3 | SNV | Missense_Mutation | c.1693C>A | p.Leu565Met | p.L565M | Q9UQQ2 | protein_coding | tolerated(0.17) | benign(0.155) | TCGA-AA-A02R-01 | Colorectum | colon adenocarcinoma | Female | >=65 | I/II | Unknown | Unknown | PD | |
| SH2B3 | SNV | Missense_Mutation | c.1507N>A | p.Ser503Thr | p.S503T | Q9UQQ2 | protein_coding | tolerated(0.47) | benign(0.005) | TCGA-AY-6196-01 | Colorectum | colon adenocarcinoma | Male | <65 | III/IV | Unknown | Unknown | SD | |
| SH2B3 | SNV | Missense_Mutation | novel | c.1231G>A | p.Ala411Thr | p.A411T | Q9UQQ2 | protein_coding | deleterious(0) | probably_damaging(0.996) | TCGA-F4-6856-01 | Colorectum | colon adenocarcinoma | Male | <65 | I/II | Ancillary | leucovorin | CR |
| SH2B3 | SNV | Missense_Mutation | c.674N>A | p.Arg225His | p.R225H | Q9UQQ2 | protein_coding | deleterious(0) | probably_damaging(0.983) | TCGA-WS-AB45-01 | Colorectum | colon adenocarcinoma | Female | <65 | I/II | Unknown | Unknown | SD | |
| SH2B3 | SNV | Missense_Mutation | novel | c.1175N>A | p.Arg392Gln | p.R392Q | Q9UQQ2 | protein_coding | deleterious(0) | probably_damaging(1) | TCGA-A5-A0G1-01 | Endometrium | uterine corpus endometrioid carcinoma | Female | >=65 | I/II | Unknown | Unknown | SD |
| Page: 1 2 3 4 |
Top |
Related drugs of malignant transformation related genes |
| Identification of chemicals and drugs interact with genes involved in malignant transfromation |
| (DGIdb 4.0) |
| Entrez ID | Symbol | Category | Interaction Types | Drug Claim Name | Drug Name | PMIDs |
| 10019 | SH2B3 | CLINICALLY ACTIONABLE, KINASE | candesartan | CANDESARTAN | 31327267 |
| Page: 1 |

Copyright 2023-Present -The University of Texas Health Science Center at Houston |